تقرير بحثي حول معنويات سوق العملات المشفرة (2024.07.19-07.26): انخفض سعر الإيثريوم بأكثر من 7.5%، وخرج رأس مال الإيثريوم من التداول
Ethereum price drops more than 7.5%, ETHE outflow surges

Data from Coinglass
ETHE is Grayscales Ethereum trust ETF with a fee of 2.5%. The Ethereum spot ETF had an overall net outflow of $133 million on the second day of listing. The culprit was Grayscales ETHE, which caused the sharp drop in Ethereum this week, with ETH falling to as low as around $3,100.
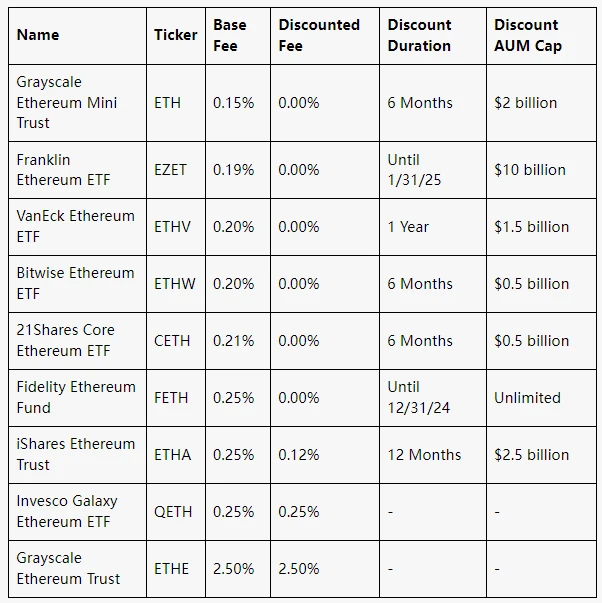
For most investors, the decision comes down to fees. Eight of the nine ETFs have management fees between 0.15% and 0.25%. Grayscale Ethereum Mini Trust (ETH), a new fund created specifically for listing as an ETF, has a management fee of just 0.15%. These fees will be waived completely for the first six months after listing or until the funds assets under management (AUM) reaches $2 billion.
There are about 5 days until the next Fed meeting (2024.08.01)
https://hk.investing.com/economic-calendar/interest-rate-decision-168
التحليل الفني لبيئة السوق والمشاعر

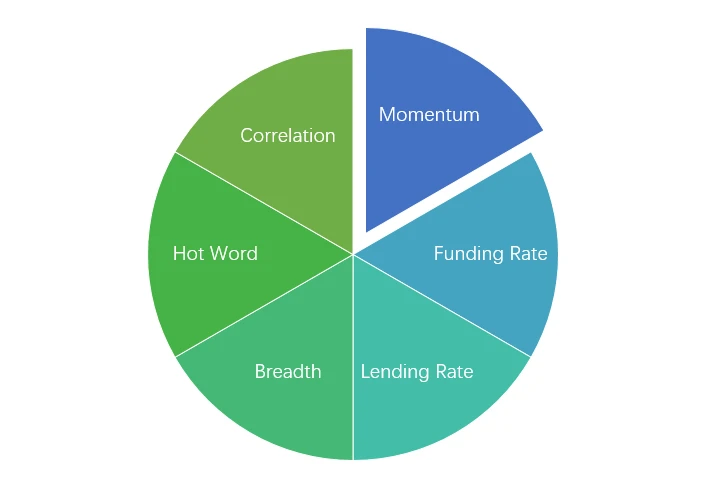
مكونات تحليل المشاعر

المؤشرات الفنية
اتجاه السعر
BTC price rose 2.83% in the past week, while ETH price fell -7.33%.
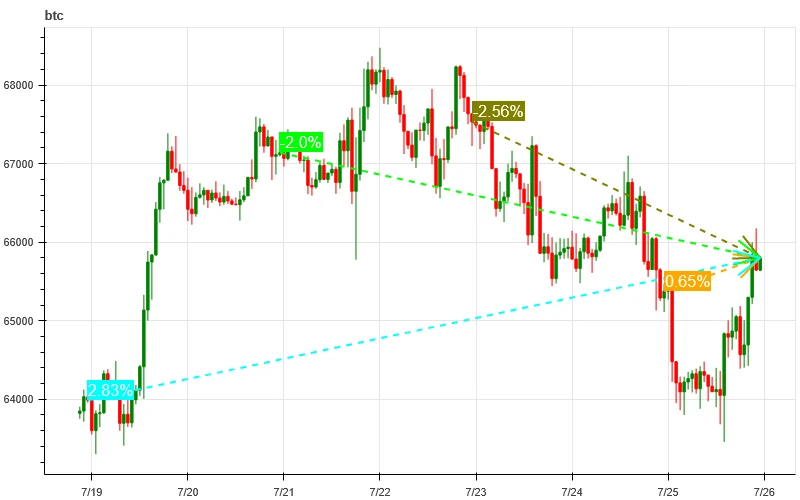
الصورة أعلاه هي الرسم البياني لسعر BTC في الأسبوع الماضي.
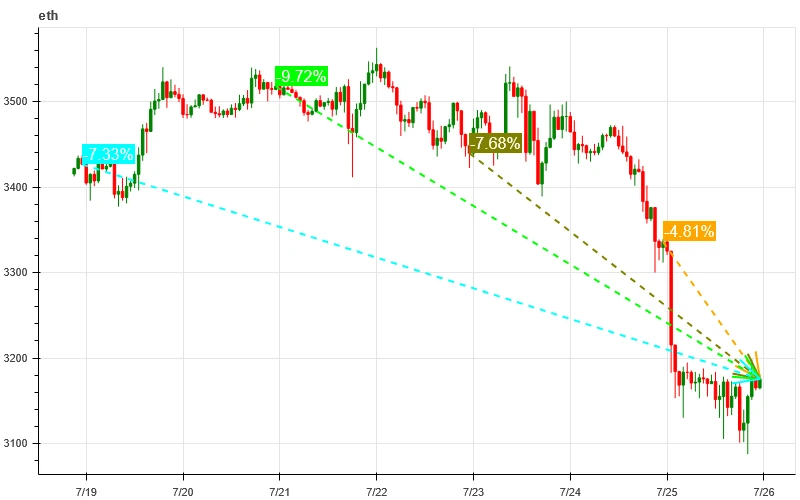
الصورة أعلاه هي الرسم البياني لسعر ETH في الأسبوع الماضي.

ويبين الجدول معدل تغير الأسعار خلال الأسبوع الماضي.
مخطط توزيع حجم السعر (الدعم والمقاومة)
In the past week, BTC rose and then fell back into the concentrated trading area, while ETH fell and formed a new concentrated trading area at a low level.
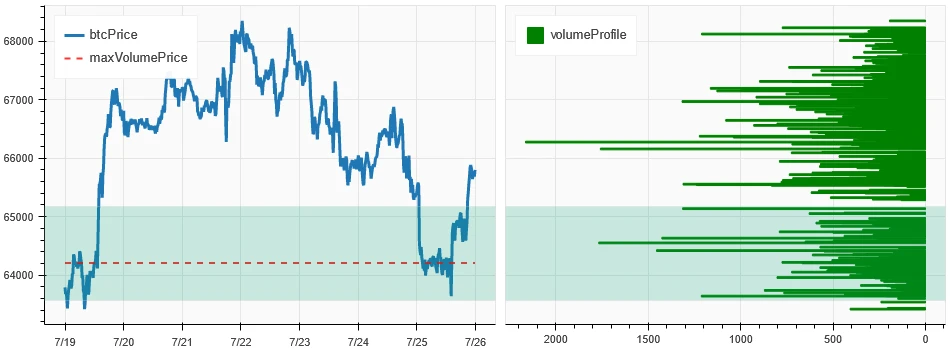
توضح الصورة أعلاه توزيع مناطق التداول الكثيفة لـ BTC في الأسبوع الماضي.
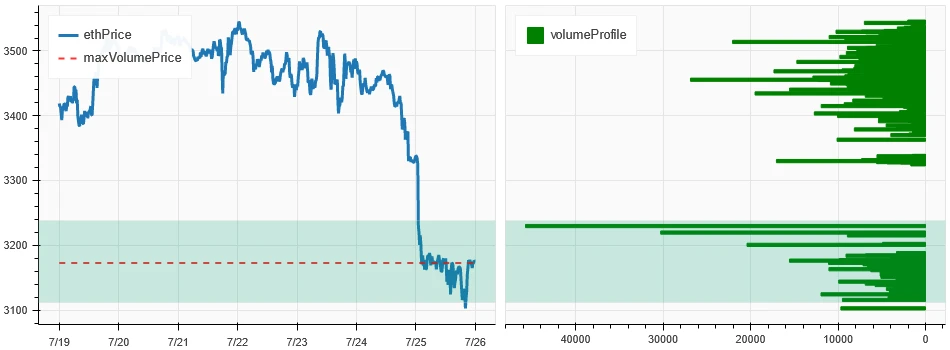
توضح الصورة أعلاه توزيع مناطق التداول الكثيفة لـ ETH في الأسبوع الماضي.

يوضح الجدول نطاق التداول الأسبوعي المكثف لـ BTC و ETH في الأسبوع الماضي.
الحجم والفائدة المفتوحة
The biggest volume this past week was when BTC rose on July 19 and ETH fell on July 25; open interest rose for both BTC and ETH.
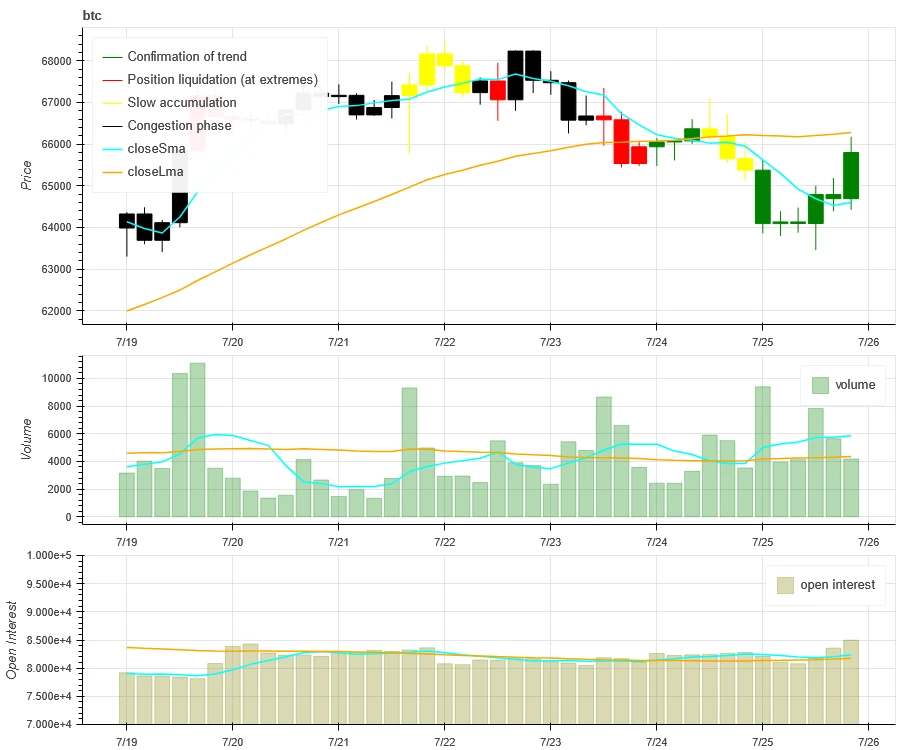
يظهر الجزء العلوي من الصورة أعلاه اتجاه سعر BTC، ويظهر الوسط حجم التداول، ويظهر الجزء السفلي الفائدة المفتوحة، والأزرق الفاتح هو متوسط يوم واحد، والبرتقالي هو متوسط 7 أيام. يمثل لون خط K الحالة الحالية، والأخضر يعني أن ارتفاع السعر مدعوم من حجم التداول، والأحمر يعني إغلاق المراكز، والأصفر يعني تراكم المراكز ببطء، والأسود يعني حالة الازدحام.
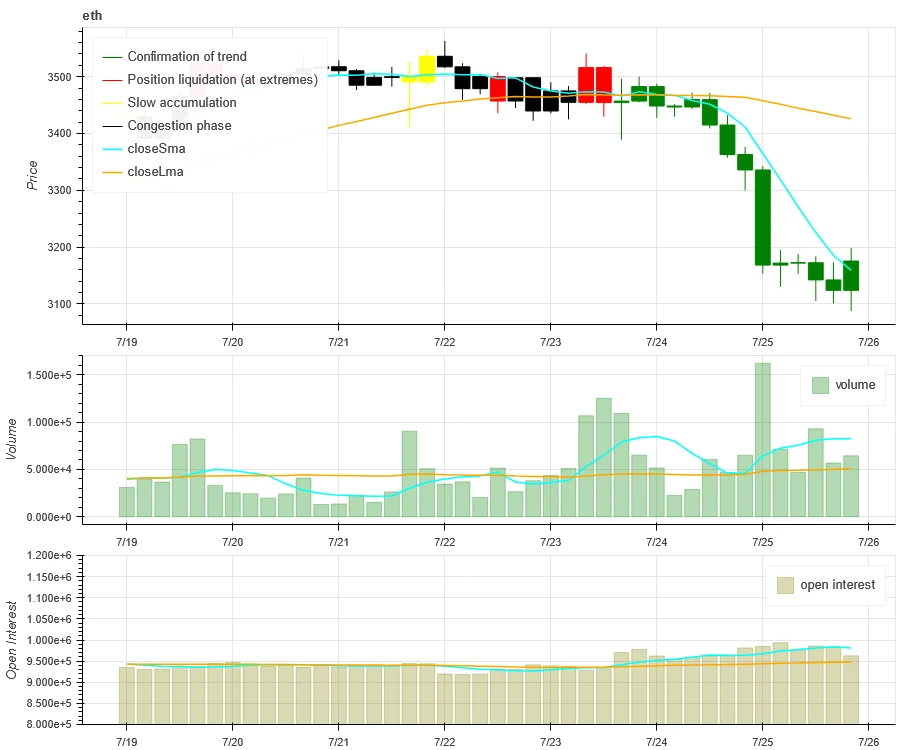
يُظهر الجزء العلوي من الصورة أعلاه اتجاه سعر ETH، والوسط هو حجم التداول، والأسفل هو الفائدة المفتوحة، والأزرق الفاتح هو متوسط يوم واحد، والبرتقالي هو متوسط 7 أيام. يمثل لون الخط K الحالة الحالية، والأخضر يعني أن ارتفاع الأسعار مدعوم بحجم التداول، والأحمر يعني إغلاق المراكز، والأصفر يتراكم المراكز ببطء، والأسود مزدحم.
التقلبات التاريخية مقابل التقلبات الضمنية
Historical volatility was highest this past week with BTC at 7.23 and ETH at 7.25; implied volatility was up with BTC and down with ETH.
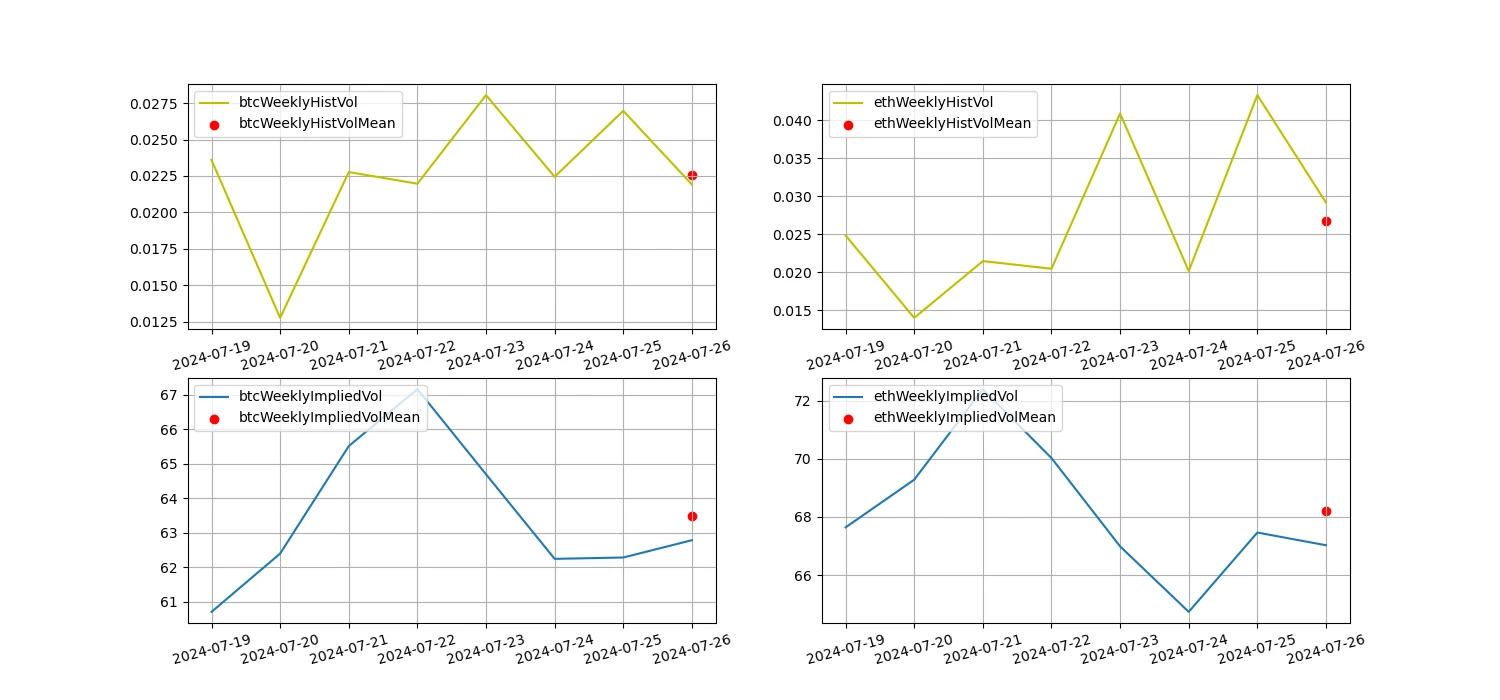
الخط الأصفر هو التقلب التاريخي، والخط الأزرق هو التقلب الضمني، والنقطة الحمراء هي متوسطه على مدى 7 أيام.
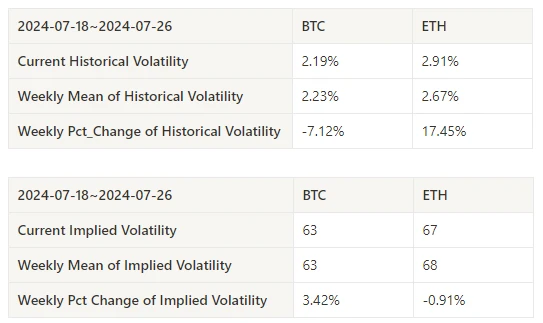
الحدث مدفوعة
There were no major data releases in the past week.
مؤشرات المشاعر
معنويات الزخم
In the past week, among Bitcoin/Gold/Nasdaq/Hang Seng Index/CSI 300, Bitcoin was the strongest, while Hang Seng Index performed the worst.
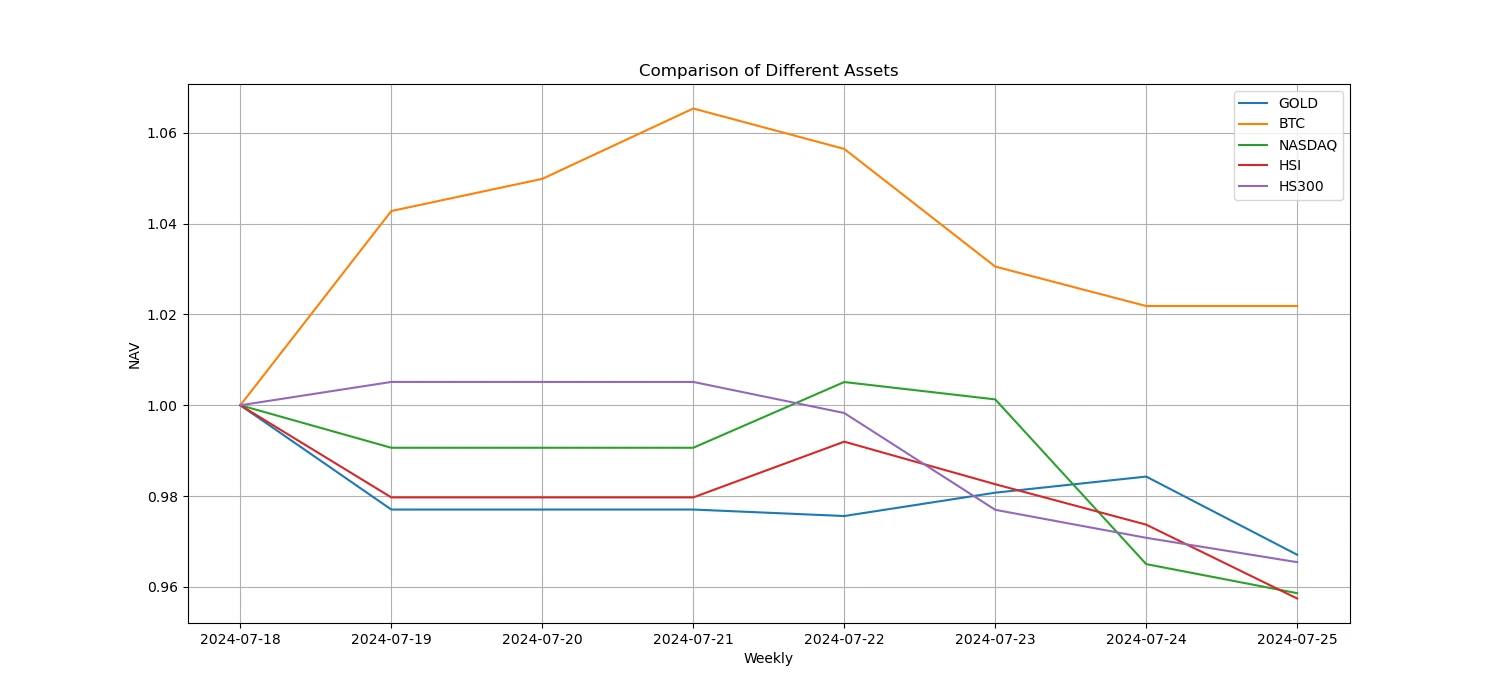
الصورة أعلاه توضح اتجاه الأصول المختلفة في الأسبوع الماضي.

معدل الإقراض _ معنويات الإقراض
The average annualized return on USD lending over the past week was 9.2%, and short-term interest rates fell to 6%.
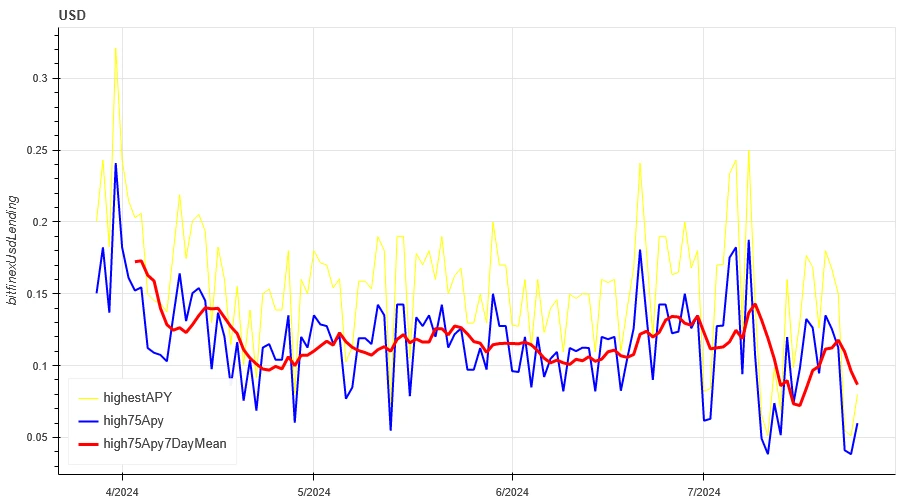
الخط الأصفر هو أعلى سعر لسعر الفائدة بالدولار الأمريكي، والخط الأزرق هو 75% من أعلى سعر، والخط الأحمر هو متوسط 7 أيام من 75% من أعلى سعر.

يوضح الجدول متوسط عوائد أسعار الفائدة بالدولار الأمريكي في أيام الاحتفاظ المختلفة في الماضي
معدل التمويل_معنويات الرافعة المالية للعقد
The average annualized return on BTC fees in the past week was 5.3%, and contract leverage sentiment rebounded from a low level.
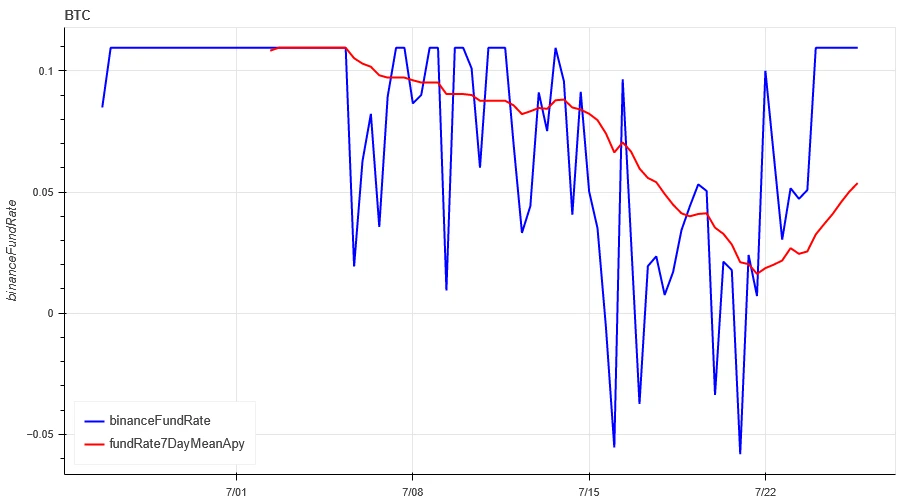
الخط الأزرق هو معدل تمويل BTC على Binance، والخط الأحمر هو متوسطه على مدار 7 أيام

يوضح الجدول متوسط عائد رسوم BTC لأيام الاحتفاظ المختلفة في الماضي.
ارتباط السوق_الإجماع الشعور
The correlation among the 129 coins selected in the past week was around 0.75, and the consistency between different varieties fell sharply and then rebounded.
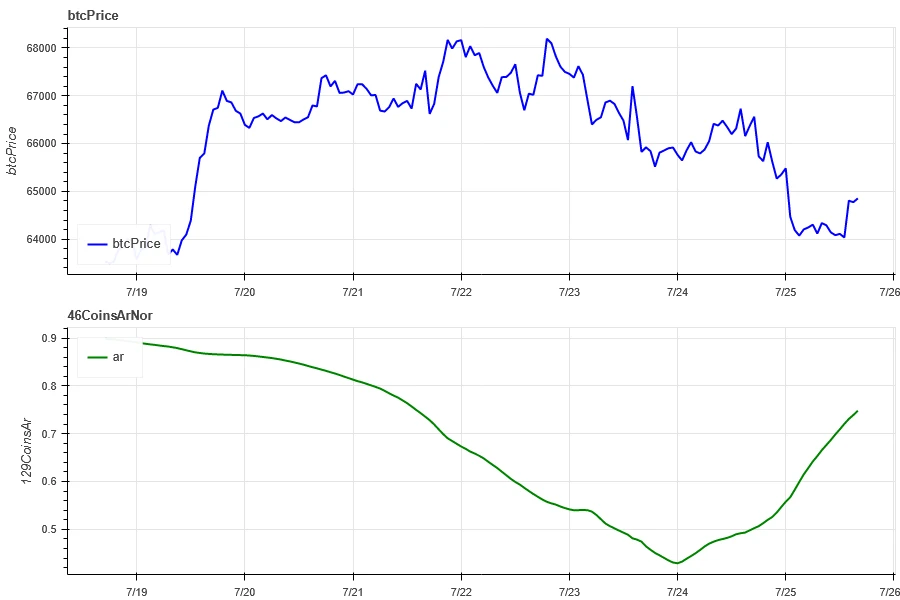
في الصورة أعلاه، الخط الأزرق هو سعر البيتكوين، والخط الأخضر هو [1000 floki، 1000 lunc، 1000 pepe، 1000 shib، 100 0x ec، 1inch، aave، ada، agix، algo، ankr، ant، ape، apt، arb، ar، astr، atom، audio، avax، axs، bal، band، bat، bch، bigtime، blur، bnb، btc، celo، cfx، chz، ckb، comp، crv، cvx، cyber، dash، doge، dot، dydx، egld، enj، ens، eos، إلخ، eth، fet، fil، flow، ftm، fxs، gala، gmt، gmx، grt، hbar، hot، icp، icx، imx، inj، iost، iotx، jasmy، kava، klay، ksm، ldo، link، loom، lpt، lqty، lrc، ltc، luna 2، magic، mana، matic، meme، mina، mkr، near، neo، Ocean، one، ont، op، pendle، qnt، qtum، rndr، rose، rune، rvn، sand، sei، sfp، skl , snx , sol, ssv, stg, storj, stx, sui, sushi, sxp, theta, tia, trx, t, uma, uni, vet, wave, wld, woo, xem, xlm, xmr, xrp, xtz, yfi, zec, zen, zil, zrx] الارتباط العام
اتساع السوق_المعنويات العامة
Among the 129 coins selected in the past week, 30% of the coins were priced above the 30-day moving average, 10% of the coins were priced above the 30-day moving average relative to BTC, 15% of the coins were more than 20% away from the lowest price in the past 30 days, and 20% of the coins were less than 10% away from the highest price in the past 30 days. The market breadth indicator in the past week showed that most coins in the overall market returned to a downward trend.
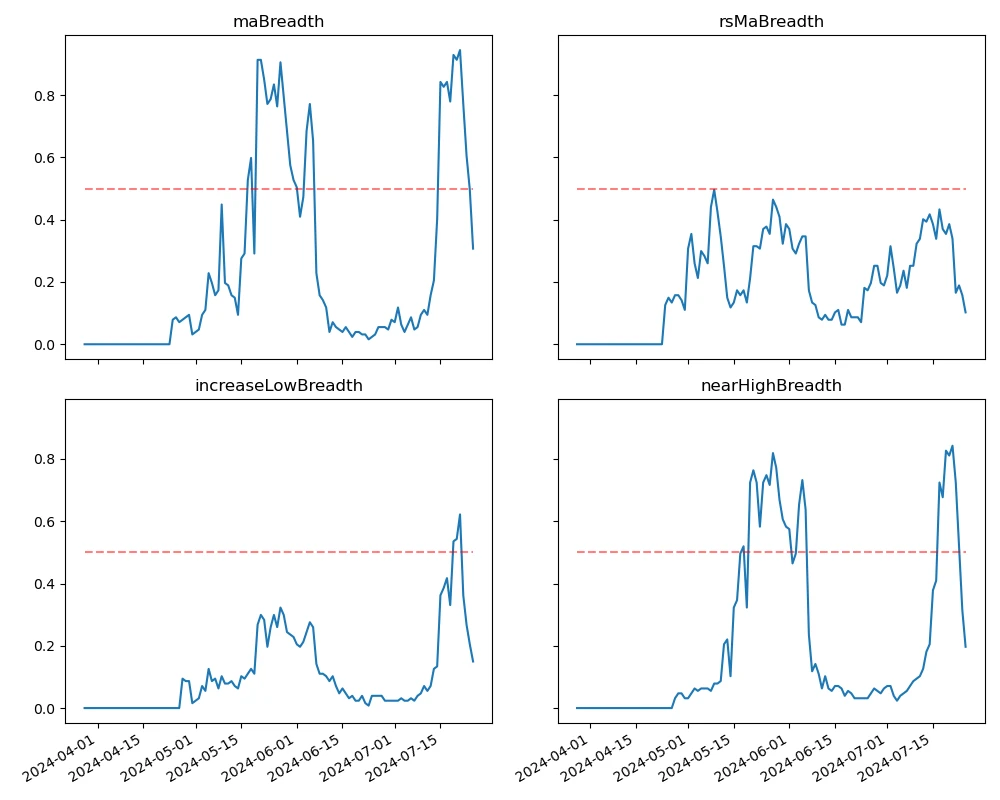
الصورة أعلاه هي [bnb، btc، sol، eth، 1000 floki، 1000 lunc، 1000 pepe، 1000 sats، 1000 shib، 100 0x ec، 1inch، aave، ada، agix، ai، algo، alt، ankr، ape، apt، arb، ar، astr، atom، avax، axs، bal، band،bat، bch، bigtime، Blur، cake، celo، cfx، chz، ckb، comp، crv، cvx، Cyber، Dash، doge، dot، dydx، egld، enj، ens، eos،etc، fet، fil،flow، ftm، fxs، gala، gmt، gmx، grt، hbar، hot، icp، icx، idu، imx، inj، iost، iotx، jasmy، jto، jup، kava، klay، ksm، ldo، link، loom، lpt، lqty، lrc، ltc، luna 2، السحر، مانا، مانتا، قناع، ماتيتش، ميمي، مينا ، mkr، قريب، neo، nfp، محيط، واحد، ont، op، ordi، pendle، pyth، qnt، qtum، rndr، robin، rose، rune، rvn، sand، sei، sfp، skl، snx، ssv، stg , storj, stx, sui, sushi, sxp, ثيتا, tia, trx, t, uma, uni, vet, waves, wif, wld, woo,xai, xem, xlm, xmr, xrp, xtz, yfi, zec، zen، zil، zrx] نسبة 30 يومًا لكل مؤشر عرض

لخص
In the past week, the market performance of Bitcoin and Ethereum was different. Bitcoin fluctuated widely within the range, with the trading volume reaching the highest point on July 19 when it rose, the open interest volume increased, the implied volatility increased, and the funding rate rebounded, indicating that market sentiment has warmed up. Ethereum, on the other hand, fell in price after the shock, mainly affected by the outflow of ETHE funds, with the trading volume reaching the highest point on July 25 when it fell, the open interest volume increased, and the implied volatility decreased. The market breadth indicator shows that most cryptocurrencies have returned to a downward trend, indicating that the entire market has been dominated by declines in the past week.
تويتر: @ https://x.com/CTA_ChannelCmt
موقع إلكتروني: قناة سمت.كوم
This article is sourced from the internet: Crypto Market Sentiment Research Report (2024.07.19-07.26): Ethereum price fell by more than 7.5%, and ETHE capital outflow surged
Related: After zkSync, what other potential airdrop projects are worth paying attention to?
Original author: zuc l1 ck , crypto KOL Original translation: Felix, PANews After the zkSync airdrop incident, airdrops for first-tier projects seem to have lost their meaning. This is a new era. Second-tier projects have low airdrop costs, fast airdrops, and strong scalability. Crypto KOL zuc l1 ck counted the airdrop data received by individuals. The data proves that the second- and third-tier projects bring the most benefits, and there is no large amount of money invested in these projects. The following are potential airdrop projects worth paying attention to this year. Berachain Berachain is an Ethereum Virtual Machine (EVM) compatible L1 built on Cosmos SDK. The following is an interactive guide: Add Berachain Artio to your wallet: https://chainlist.org/chain/80085 Connect your wallet Add Berachain Artio to Metamask Approve and switch…


