شرح مفصل لمؤشر الخوف والجشع: ما هو الدور التوجيهي الذي يلعبه معنويات السوق؟
Original author: Crypto_Painter (X: @ @CryptoPainter_X )
With BTC recent brief drop below the $60,000 mark, market sentiment did a 180-degree turn overnight, going from 75% greed a week ago straight to 30% fear;
Is the market really that fearful?
Since many people are talking about this index, let鈥檚 analyze it thoroughly today and see what kind of guidance the market sentiment index provides for trading.
First, we need to understand how the FG index is calculated?
It is calculated using 5 main weights:
1. Volatility: The current volatility of BTC price relative to the past 30 and 90 days. An abnormal increase in volatility can sometimes be a sign of excessive fear in the market.
2. Momentum and Volume: Momentum and volume relative to the past 30 and 90 days. Abnormally high buying volume relative to the past 30 and 90 days may indicate that the market has become too greedy, and vice versa.
3. Social Media: Analyze sentiment on social media to see the type and volume of sentiment at a specific time relative to historical norms.
4. BTC dominance rate: Bitcoin advantage over other cryptocurrencies.
5. Google Trends: Use Google Trends for a range of relevant Bitcoin search terms to identify periods of strong growth or decline in Google searches.
After understanding the above information, we can further understand the reasons for the changes in the fear and greed index;
Obviously, the main reason for the current 30 fear index of BTC is not 1 and 2, because its volatility and trading volume have not increased significantly at the weekly level, so the factors that are more likely to affect the index should come from 3 to 5;
The social media data is not available, so I can only rely on my personal experience that users on Twitter are not extremely panicked, but many are buying at the bottom.
Google Trends, on the other hand, maintained a slight increase with no significant changes;
Then the main change can only appear in BTCs dominance rate. When the market fell sharply the day before yesterday, many people found that altcoins did not follow the decline at all, which led to a sharp decline in BTCs dominance rate, which dropped by nearly 4% from the local high. It should be noted that in terms of the market value of cryptocurrencies, a 4% drop is indeed not a small number! And this may be the main reason for the rapid decline of the fear and greed index;
Therefore, we can draw the conclusion that there is no technical fear in BTC at the moment, but the change in the calculation results of the index is simply due to the strength of altcoins.
Now comes the interesting part. Has this situation ever happened in history?
I divided the BTC Fear and Greed Index into numerical areas and manually marked them on the BTC weekly chart, and I got the following chart:
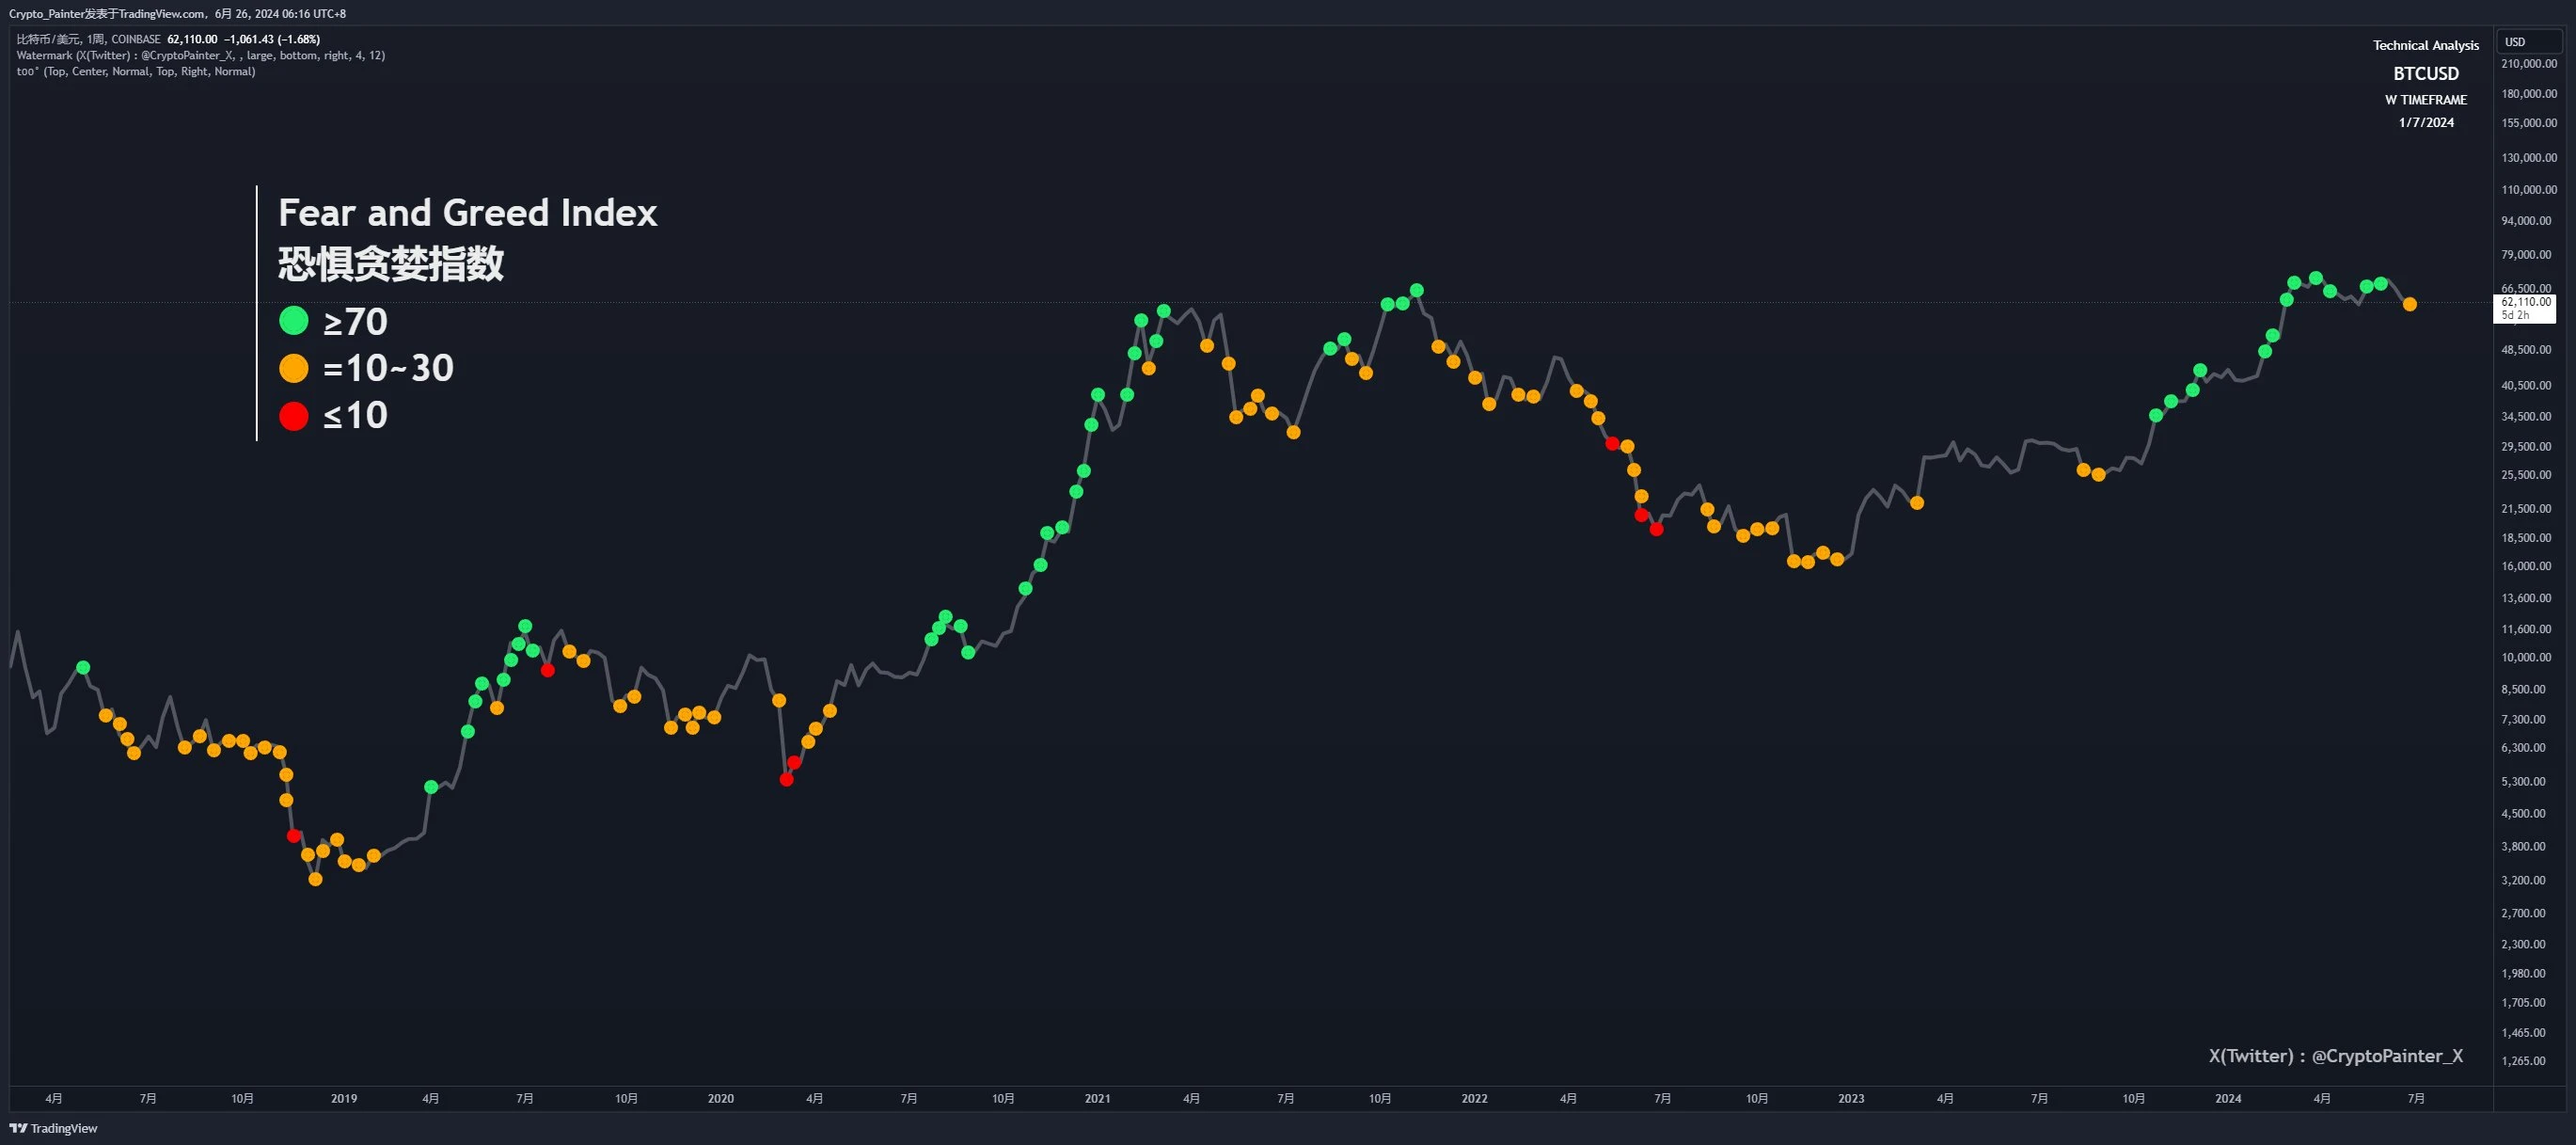
The green mark indicates that the BTC Fear and Greed Index has historically been above 70, which means that it is generally in a greedy or extremely greedy stage;
The orange mark indicates the fear stage where the index is between 10 and 30;
Finally, the red mark represents the period of extreme fear in BTC in history;
For the time being, we regard the unmarked positions as the neutral stage of normal fluctuations in market sentiment;
From the green arrow in the figure below you can see:

In the last two BTC halving cycles, if a bull market came, the Fear and Greed Index would show a series of long-term green greed marks;
After the green greed mark lasts for a long time, an orange fear mark will suddenly appear, just like this time. If this orange fear mark fails to last for more than 3 weeks and BTC re-enters the greed state, it often heralds the arrival of a bull market!
If this orange fear mark starts to appear continuously for more than 3 weeks, there is a high probability that BTC will usher in a huge correction or directly end the bull market;
Therefore, we can analyze the significance of the Fear and Greed Index from a dialectical perspective, that is, the market sentiment of fear often represents an excellent bargain hunting and increasing positions during a bull market, and before the bull market is about to end, it represents an excellent opportunity to escape the top;
However, from my personal perspective, the current market situation seems to be somewhat biased towards the latter, mainly for two reasons:
1. The price did not break a new high and did not rise continuously, but it clearly turned from the bullish trend before March to a wide range of fluctuations;
2. The volatility lasts too long and the market sentiment is often greedy;
Of course, I am not suggesting that everyone should escape the top. It has been clearly stated above that the most suitable basis for judgment is the occurrence of fear for three consecutive weeks, not just a few days at the moment. After all, there was fear for two consecutive weeks in September 2021, but the price eventually rebounded and broke a new high!
After talking about greed, lets take a look at extreme fear (
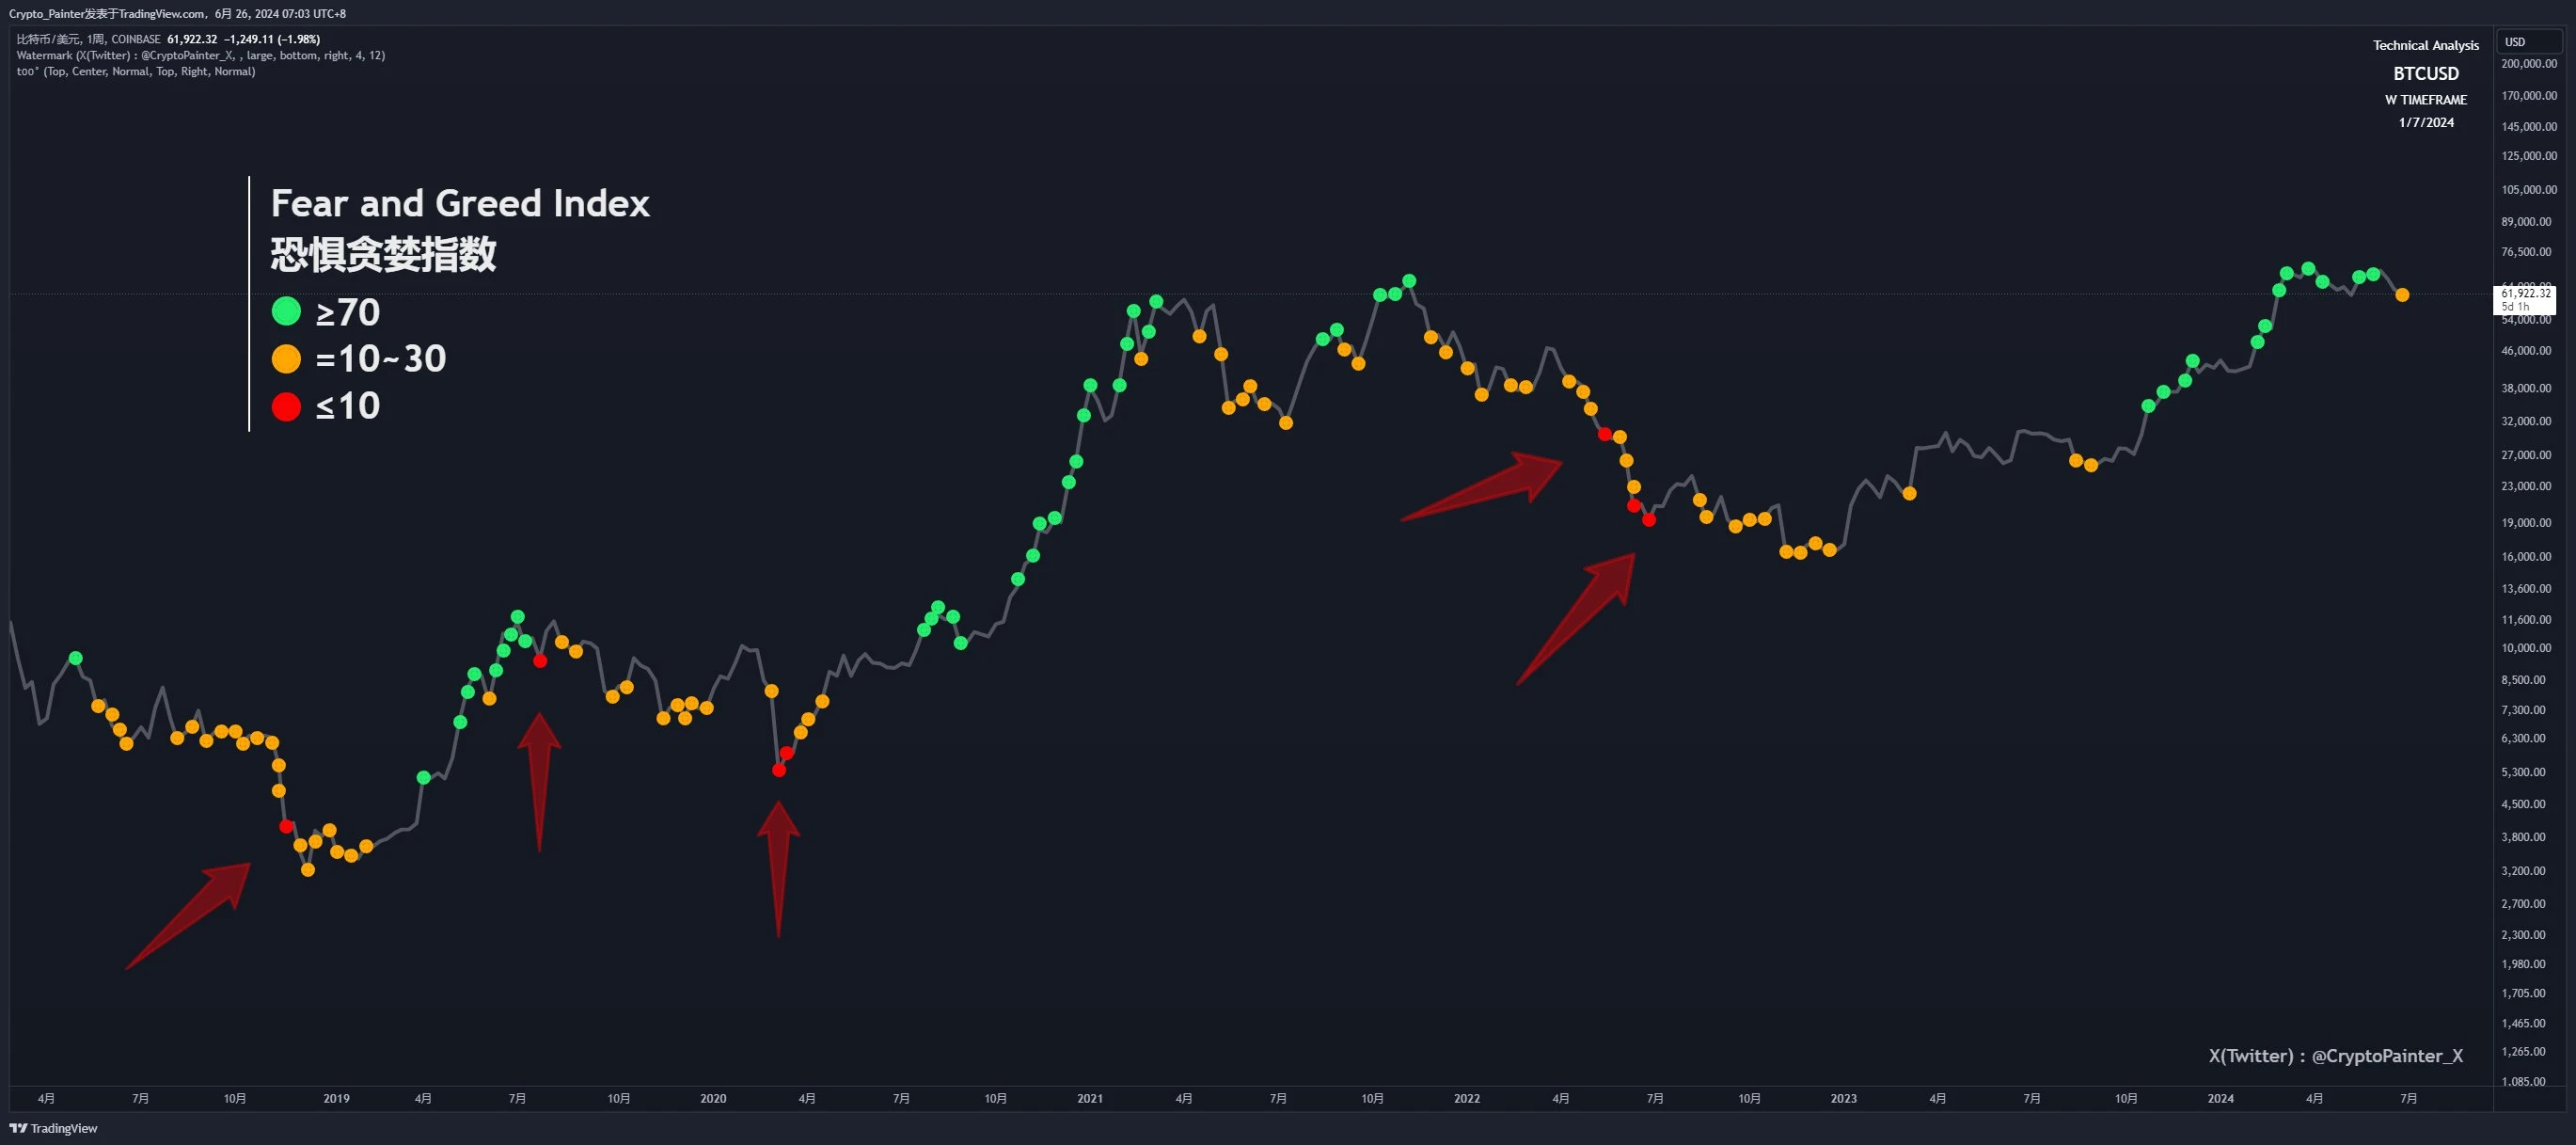
Since 2019, when market sentiment reaches extreme fear for the first time in a bull market, it often represents the end of the bull market, and a bear market will follow for a period of time. When the bear market lasts for a period of time, when extreme fear market sentiment appears for the second or third time, BTC is often very close to the bottom!
That is to say, when the BTC price shows extreme fear in the market sentiment for the first time at a high level, the next opportunity is to escape the top. If the price does not fall below the original fluctuation range, you can wait for a small rebound before shipping.
When the market sentiment of extreme fear appears for the second or third time in a bear market, remember the closing price of the most fearful day. Below this price, it is a good opportunity to gradually build a position or accumulate funds. Of course, the black swan of March 12 is an exception, because it only gives 3 days to build a position.
Finally, the above conclusions are summarized into a chart:
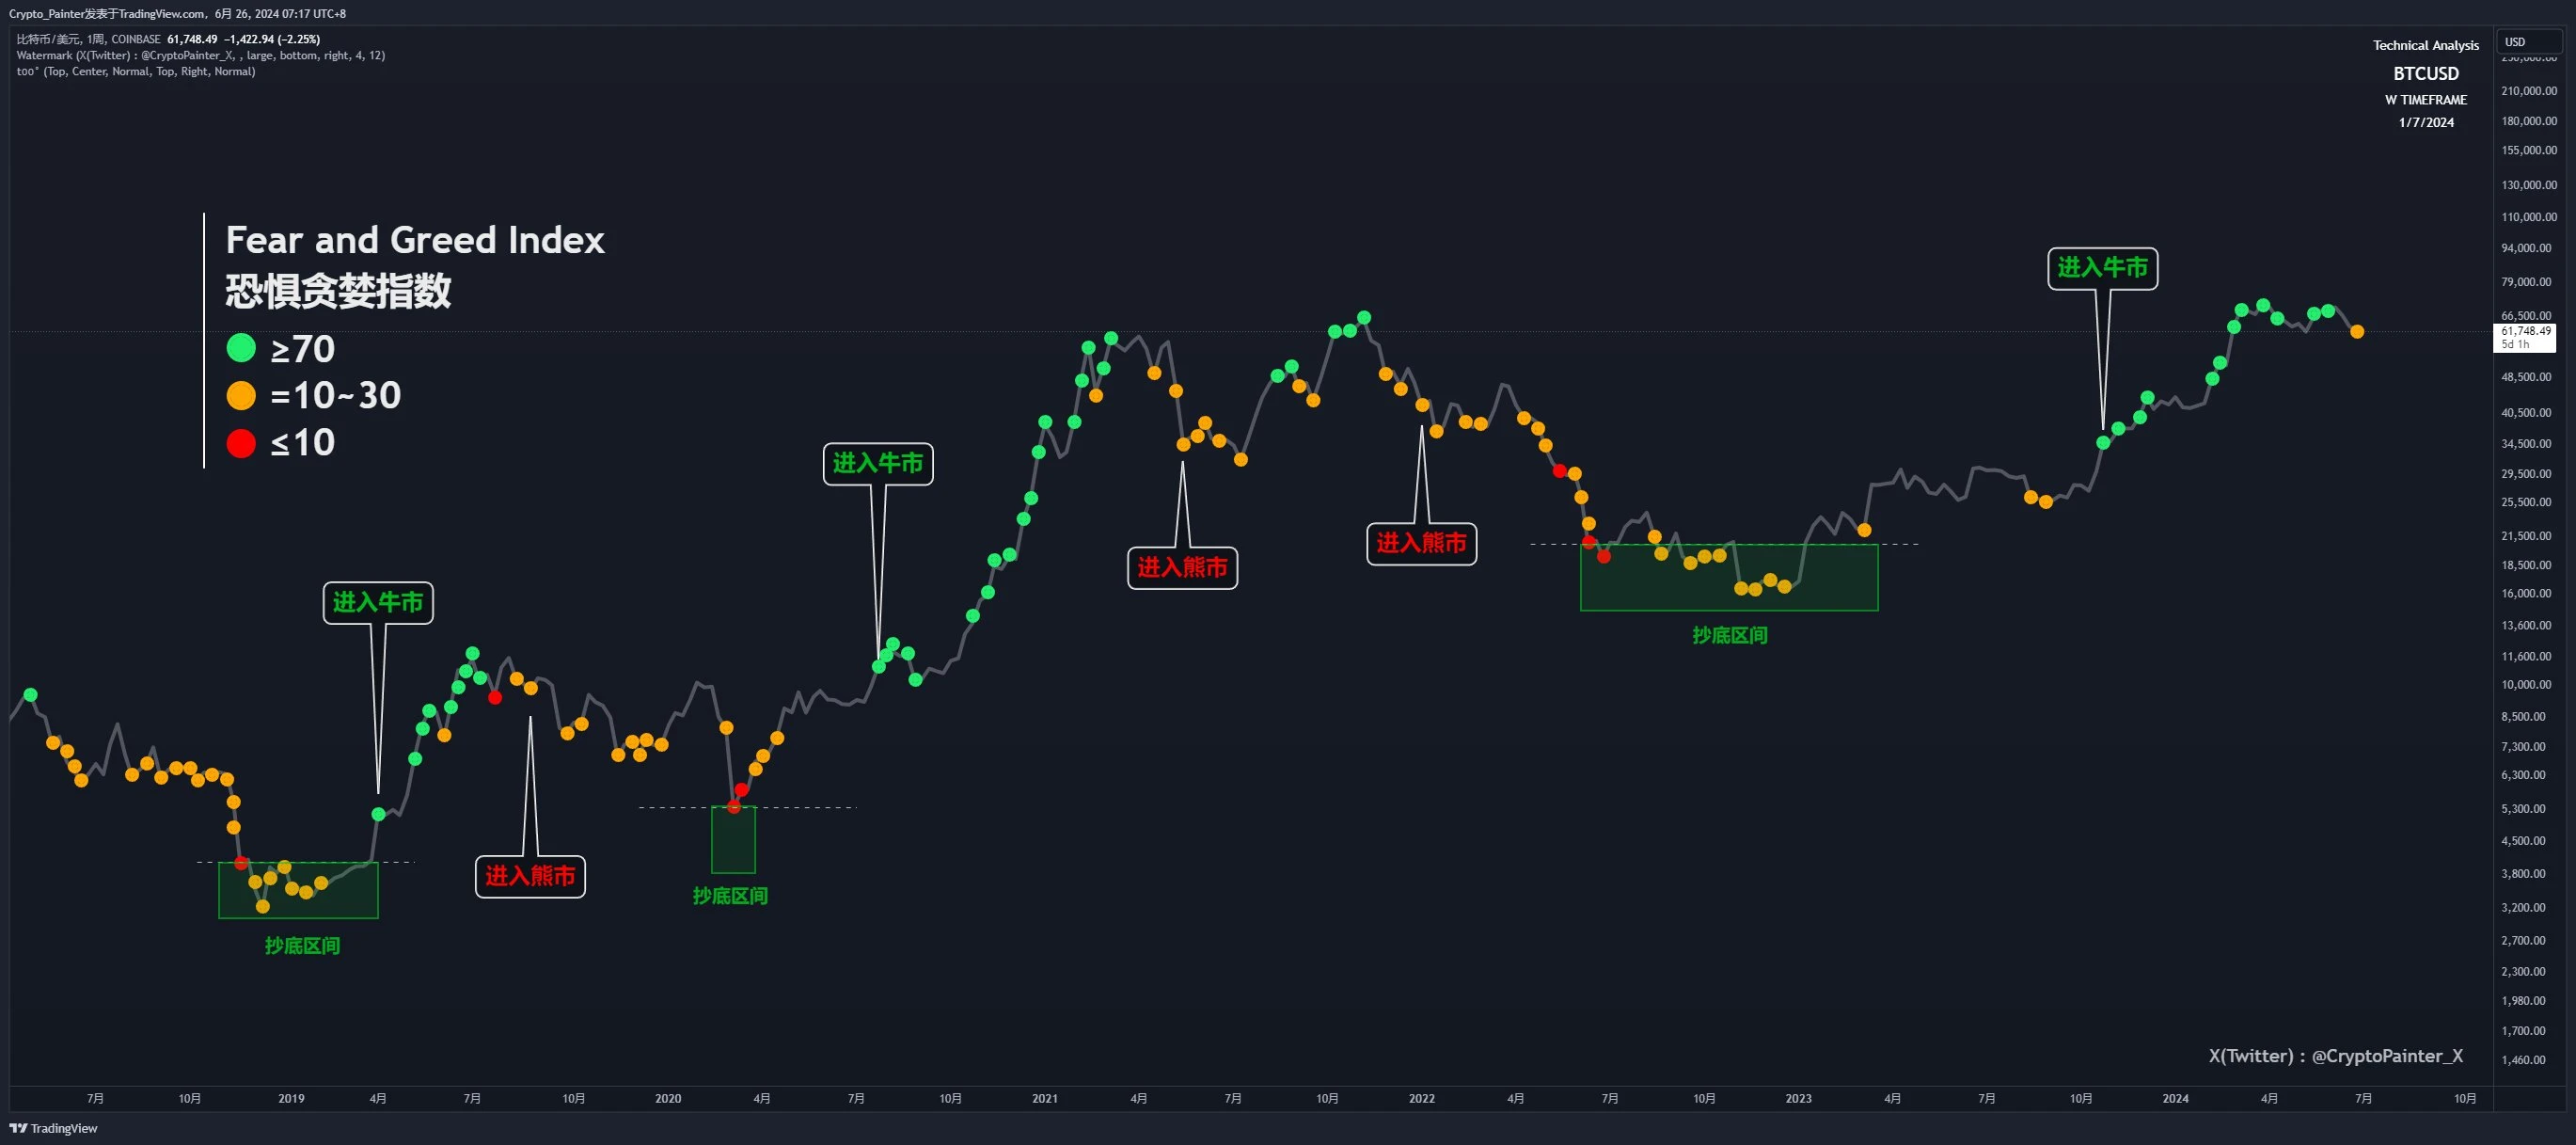
It can be seen that although this sentiment analysis method cannot perfectly escape the top, it can almost accurately copy the bottom of the range;
At the same time, the first green greed mark that appears at the end of a bear market often represents the beginning of a new bull market!
Therefore, we should have a diversified attitude towards this fear and greed index. It is not necessarily the bottom when the market is panicking, and it is not necessarily the top when the market is greedy.
When prices are low, the force that drives prices up must come from the greed of traders who want to buy at low prices, and when prices are high, the force that drives prices down often comes from the fear of traders who want to cash out at high prices;
Through this level of emotional analysis combined with our own technical analysis and trading system, we can theoretically achieve absolutely no mistakes in trading over the long term.
To be honest, in my opinion, the two emotions of fear and greed correspond to the inherent supply and demand of the market. As the price of BTC is increasingly affected by macro factors and traditional institutional funds, this emotional fluctuation will inevitably become less extreme.
Therefore, what we need to face may no longer be the external collective emotional state, but our own internal psychological state.
That all, thanks for reading!
This article is sourced from the internet: A detailed explanation of the Fear and Greed Index: What guiding role does market sentiment play?
Related: Privasea and Zama reach cooperation to jointly explore AI, data security, and ML fields
Recently, the Privasea ecosystem has continued to make substantial ecological progress. After obtaining a new round of strategic private equity financing, it has reached a strategic partnership with Zama, and the two parties will be bound together for a long time. This not only shows Zamas recognition of Privaseas technical solutions, long-term development prospects and narrative direction, but also marks an important progress in the application of privacy protection in the field of machine learning. Zama is a technology company dedicated to promoting the application of fully homomorphic encryption (FHE) in the fields of blockchain and artificial intelligence. In the past four years, it has continuously transformed FHE from abstract mathematical theory into practical code, greatly improving developers ability to apply FHE technology. Recently, Zama successfully raised $73 million in…