تقرير بحثي حول معنويات سوق العملات المشفرة (2024.06.14-2024.06.21): تم بيع صناديق الاستثمار المتداولة في البيتكوين بشكل مستمر في الماضي
Bitcoin ETFs have been sold off continuously over the past 5 days
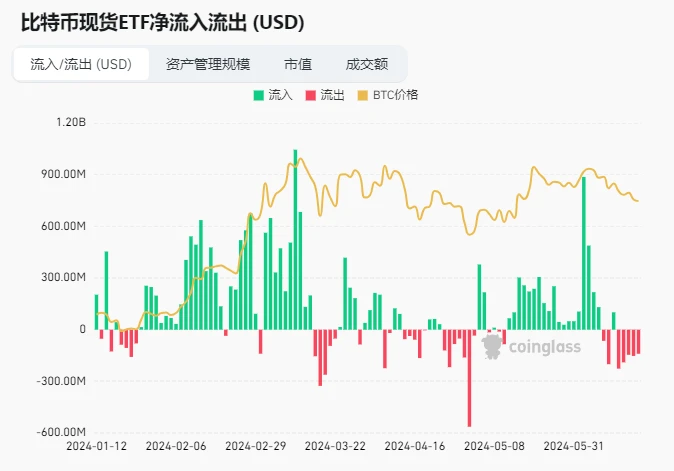
مصدر البيانات: https://www.coinglass.com/en/bitcoin-etf
The latest data shows that the US spot Bitcoin ETF set off a selling storm on June 17! A total of 3,169 Bitcoins were sold, worth more than $200 million!
Among them, the well-known institution Fidelity reduced its holdings of 1,224 bitcoins, worth up to $80.34 million, and currently still holds a large amount of bitcoins. Another giant, Grayscale, also reduced its holdings of 936 bitcoins, worth more than $61.4 million. The reduction of holdings by these two giants has undoubtedly brought a lot of shock to the market.
This selling storm has created more uncertainty about the future trend of the Bitcoin market, and more risk management is needed.
There are about 38 days until the next Federal Reserve interest rate meeting (2024.08.01)
https://hk.investing.com/economic-calendar/interest-rate-decision-168
التحليل الفني لبيئة السوق والمشاعر

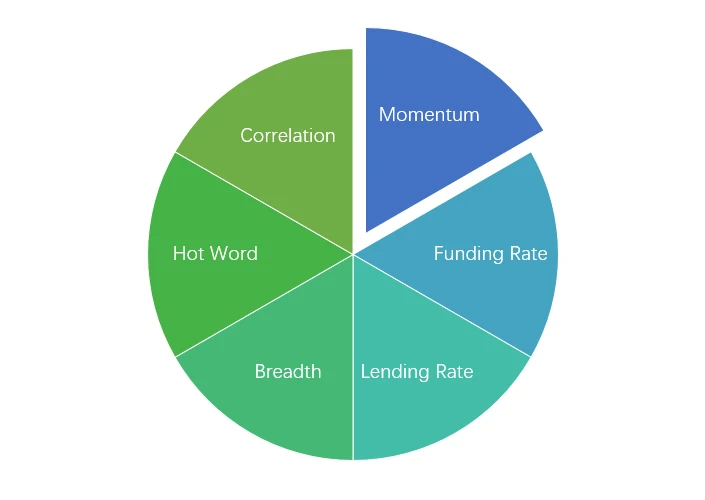
مكونات تحليل المشاعر

المؤشرات الفنية
اتجاه السعر
Over the past week, BTC prices fell -2.85% and ETH prices rose 1.26%.

الصورة أعلاه هي الرسم البياني لسعر BTC في الأسبوع الماضي.
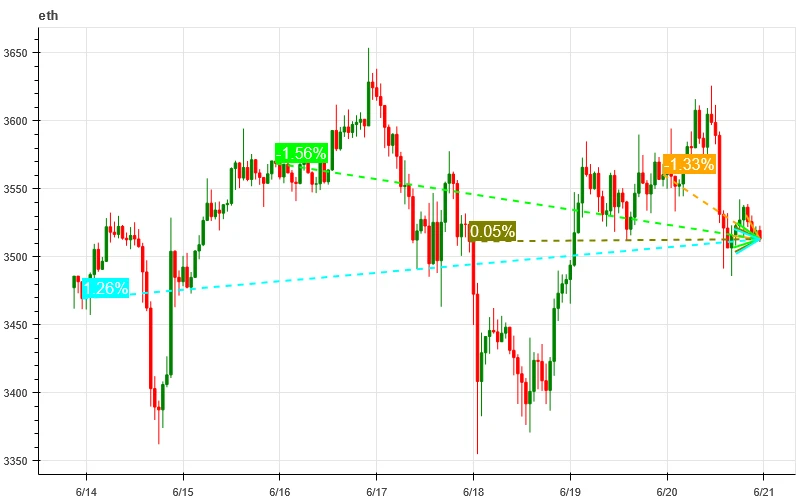
الصورة أعلاه هي الرسم البياني لسعر ETH في الأسبوع الماضي.

ويبين الجدول معدل تغير الأسعار خلال الأسبوع الماضي.
مخطط توزيع حجم السعر (الدعم والمقاومة)
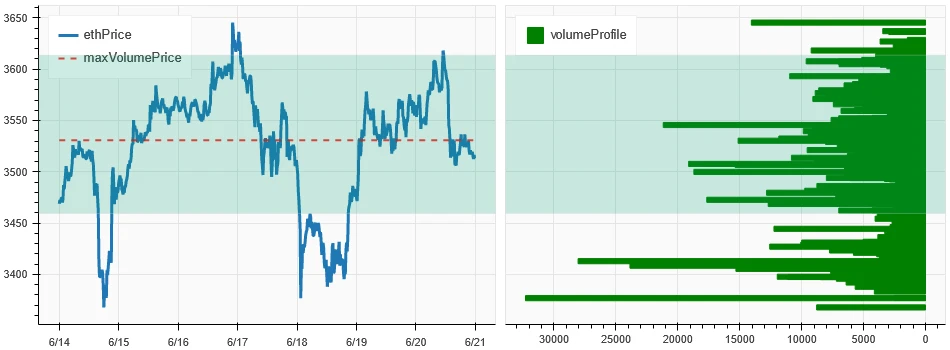
In the past week, BTC and ETH have fluctuated widely in the area of intensive trading.
توضح الصورة أعلاه توزيع مناطق التداول الكثيفة لـ BTC في الأسبوع الماضي.

توضح الصورة أعلاه توزيع مناطق التداول الكثيفة لـ ETH في الأسبوع الماضي.

يوضح الجدول نطاق التداول الأسبوعي المكثف لـ BTC و ETH في الأسبوع الماضي.
الحجم والفائدة المفتوحة
BTC and ETH saw the largest volume this past week, with the decline on June 18; open interest for BTC fell while ETH rose slightly.
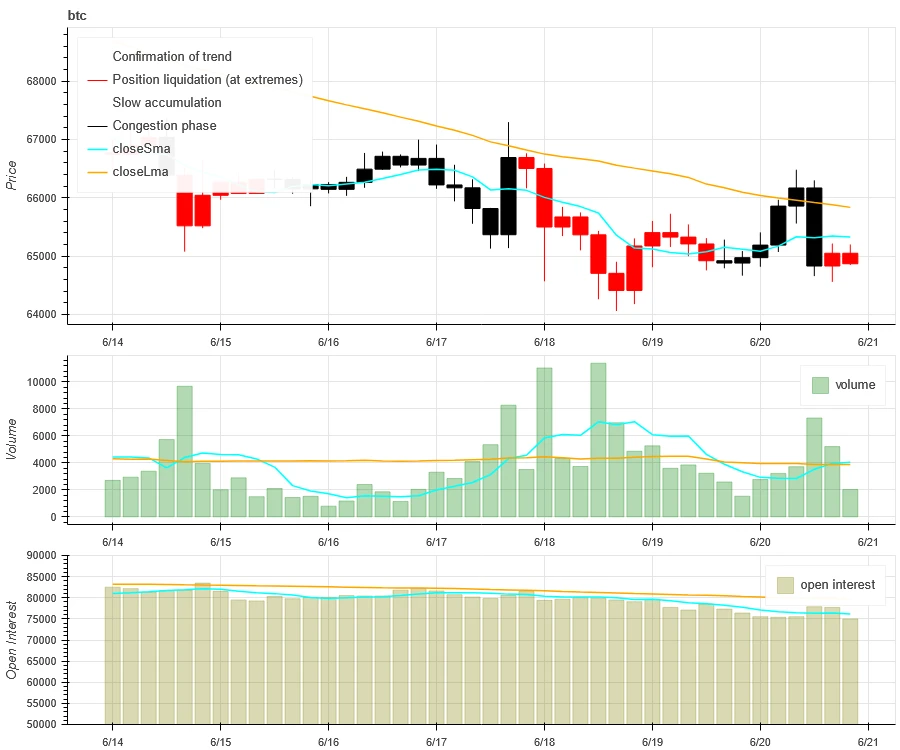
يظهر الجزء العلوي من الصورة أعلاه اتجاه سعر BTC، ويظهر الوسط حجم التداول، ويظهر الجزء السفلي الفائدة المفتوحة، والأزرق الفاتح هو متوسط يوم واحد، والبرتقالي هو متوسط 7 أيام. يمثل لون خط K الحالة الحالية، والأخضر يعني أن ارتفاع السعر مدعوم من حجم التداول، والأحمر يعني إغلاق المراكز، والأصفر يعني تراكم المراكز ببطء، والأسود يعني حالة الازدحام.

يُظهر الجزء العلوي من الصورة أعلاه اتجاه سعر ETH، والوسط هو حجم التداول، والأسفل هو الفائدة المفتوحة، والأزرق الفاتح هو متوسط يوم واحد، والبرتقالي هو متوسط 7 أيام. يمثل لون الخط K الحالة الحالية، والأخضر يعني أن ارتفاع الأسعار مدعوم بحجم التداول، والأحمر يعني إغلاق المراكز، والأصفر يتراكم المراكز ببطء، والأسود مزدحم.
التقلبات التاريخية مقابل التقلبات الضمنية
In the past week, the historical volatility of BTC and ETH was the highest when it fell to 6.14; the implied volatility of BTC and ETH both increased compared to the beginning of the week.

الخط الأصفر هو التقلب التاريخي، والخط الأزرق هو التقلب الضمني، والنقطة الحمراء هي متوسطه على مدى 7 أيام.

الحدث مدفوعة
No data was released in the past week.
مؤشرات المشاعر
معنويات الزخم
خلال الأسبوع الماضي، كان الذهب هو الأقوى بين مؤشرات البيتكوين/الذهب/ناسداك/هانغ سنغ/SSE 300، في حين كان أداء البيتكوين هو الأسوأ.
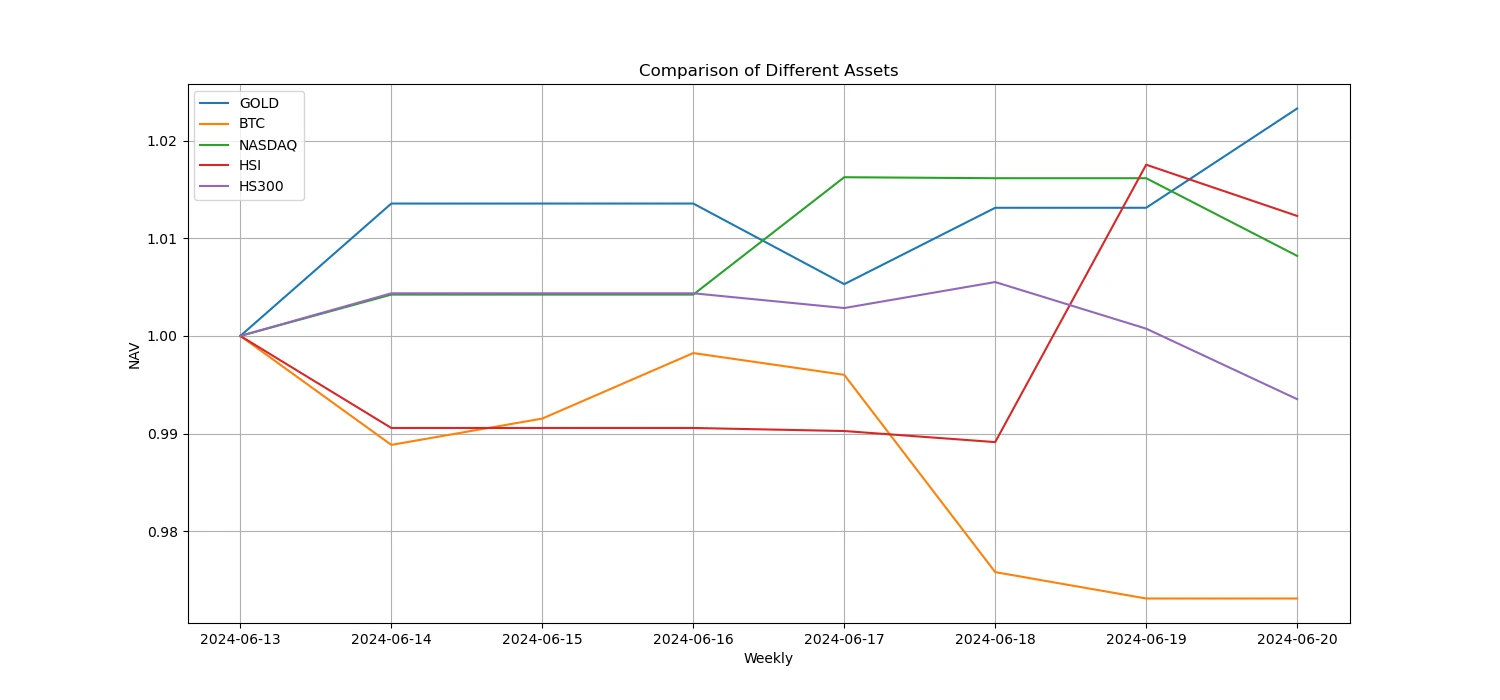
الصورة أعلاه توضح اتجاه الأصول المختلفة في الأسبوع الماضي.

معدل الإقراض _ معنويات الإقراض
The average annualized return on USD lending in the past week was 10.8%, and short-term interest rates rebounded to around 12.6%.
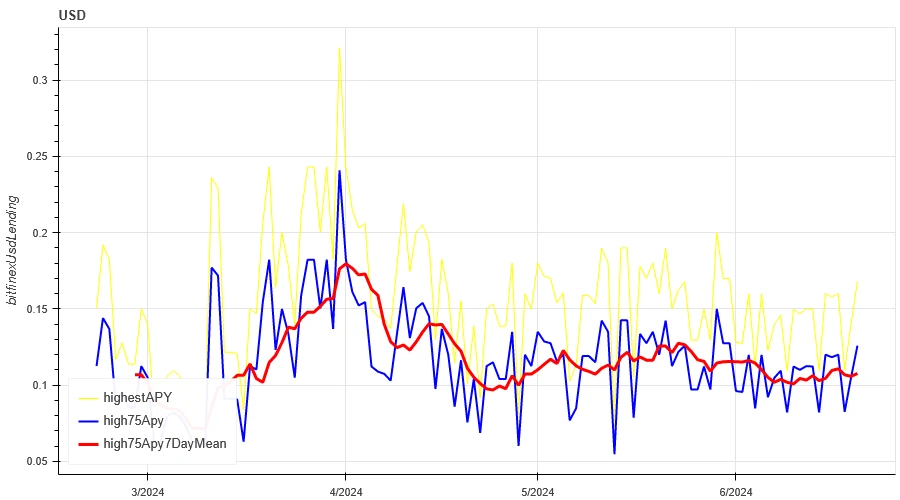
الخط الأصفر هو أعلى سعر لسعر الفائدة بالدولار الأمريكي، والخط الأزرق هو 75% من أعلى سعر، والخط الأحمر هو متوسط 7 أيام من 75% من أعلى سعر.

يوضح الجدول متوسط عوائد أسعار الفائدة بالدولار الأمريكي لأيام الاحتفاظ المختلفة في الماضي
معدل التمويل_معنويات الرافعة المالية للعقد
The average annualized return on BTC fees in the past week was 9.6%, and contract leverage sentiment returned to a low level.

الخط الأزرق هو معدل تمويل BTC على Binance، والخط الأحمر هو متوسطه على مدار 7 أيام

يوضح الجدول متوسط عائد رسوم BTC لأيام الاحتفاظ المختلفة في الماضي.
ارتباط السوق_الإجماع الشعور
The correlation among the 129 coins selected in the past week remained at around 0.88, and the consistency between different varieties was at a high level.

In the above picture, the blue line is the price of Bitcoin, and the green line is [1000 floki, 1000 lunc, 1000 pepe, 1000 shib, 100 0x ec, 1inch, aave, ada, agix, algo, ankr, ant, ape, apt, arb, ar, astr, atom, audio, avax, axs, bal, band, bat, bch, bigtime, blur, bnb, btc, celo, cfx, chz, ckb, comp, crv, cvx, cyber, dash, doge, dot, dydx, egld, enj, ens, eos,etc, eth, fet, fil, flow, ftm, fxs, gala, gmt, gmx, grt, hbar, hot, icp, icx, imx, inj, iost, iotx, jasmy, kava, klay, ksm, ldo, link, loom, lpt, lqty, lrc, ltc, luna 2, magic, mana, matic, meme, mina, mkr, near, neo, ocean, one, ont, op, pendle, qnt, qtum, rndr, rose, rune, rvn, sand, sei, sfp, skl, snx, sol, ssv, stg, storj, stx, sui, sushi, sxp, theta, tia, trx, t, uma, uni, vet, waves, wld, woo, xem, xlm, xmr, xrp, xtz, yfi, zec, zen, zil, zrx] overall correlation
اتساع السوق_المعنويات العامة
Among the 129 coins selected in the past week, 4% of them were priced above the 30-day moving average, 8.6% of them were above the 30-day moving average relative to BTC, 2.4% of them were more than 20% away from the lowest price in the past 30 days, and 4.7% of them were less than 10% away from the highest price in the past 30 days. The market breadth indicator in the past week showed that the overall market was in a continuous decline for most coins.

الصورة أعلاه تظهر [bnb، btc، sol، eth، 1000 floki، 1000 lunc، 1000 pepe، 1000 sats، 1000 shib، 100 0x ec، 1inch، aave، ada، agix، ai، algo، alt، ankr، ape، apt، arb، ar، astr، atom، avax، axs، bal، band، bat، bch، bigtime، blur، cake، celo، cfx، chz، ckb، comp، crv، cvx، cyber، dash، doge، dot، dydx، egld، enj، ens، eos، إلخ، fet، fil، flow، ftm، fxs، gala، gmt، gmx، grt، hbar، hot، icp، icx، idu، imx، inj، iost، iotx، jasmy، jto، jup، kava، klay، ksm، ldo، link، loom، lpt، lqty، lrc، ltc، luna 2، magic، mana، manta، قناع، matic، meme، mina، mkr، near، neo، nfp، Ocean، one، ont، op، ordi، pendle، pyth، qnt، qtum rndr، روبن، روز، رون، rvn، ساند، sei، sfp، skl، snx، ssv، stg، storj، stx، sui، sushi، sxp، theta، tia، trx، t، uma، uni، vet، Waves، wif، wld، woo، xai، xem، xlm، xmr، xrp، xtz، yfi، zec، zen، zil، zrx] نسبة 30 يومًا لكل مؤشر عرض

لخص
Over the past week, the prices of Bitcoin (BTC) and Ethereum (ETH) experienced wide range declines, reaching the peak of volatility on June 18. At the same time, the trading volume of these two cryptocurrencies also reached the highest level during the decline on June 18. Bitcoins open interest volume has declined, while Ethereums open interest volume has increased slightly. In addition, both implied volatilities have increased slightly. In addition, Bitcoins funding rate has fallen to a low level, which may reflect the decline in leverage sentiment of market participants towards Bitcoin. In addition, the market breadth indicator shows that most currencies continue to fall, which indicates that the entire market has generally shown a weak trend over the past week.
تويتر: @ https://x.com/CTA_ChannelCmt
موقع إلكتروني: قناة سمت.كوم
This article is sourced from the internet: Crypto Market Sentiment Research Report (2024.06.14-2024.06.21): Bitcoin ETFs have been continuously sold off in the past 5 days
أصلي | أوديلي بلانيت ديلي المؤلف | Azuma في الساعة 20:00 بتوقيت بكين يوم 30 أبريل، سيفتح Kamino، بروتوكول التمويل اللامركزي الرائد في نظام Solana البيئي، رسميًا تطبيقات الرمز المميز لرمز الحوكمة KMNO. في السابق، في 5 أبريل، أضافت كامينو صفحة إنشاء الرمز المميز إلى موقعها الرسمي على الإنترنت. يمكن للمستخدمين مسبقًا الاستعلام عن مشاركات الإسقاط الجوي لرموز KMNO المحددة من خلال هذه الصفحة. تعني المطالبة المفتوحة الليلة أن المستخدمين سيكونون قادرين على المطالبة بأسهم KMNO القائمة من خلال هذه الواجهة وتداولها في DEX أو بعض CEX التي تدعم KMNO. انهيار نموذج أعمال كامينو نموذج أعمال كامينو ليس معقدًا، ومنتجه الأساسي هو بروتوكول الإقراض الذي يعرفه الجميع. وفقًا لبيانات DeFi Llama، يعد Kamino حاليًا بروتوكول DeFi الثالث وبروتوكول الإقراض الأول…


