10x Research: متى سيصل سعر البيتكوين إلى أعلى مستوى له؟ انظر إلى هذا المؤشر الرئيسي
المصدر الأصلي: 10x بحث
تم تجميعها بواسطة: Odaily Planet Daily Wenser

Editors note: After the breakthrough of Ethereum spot ETF, the market has entered the bull market sentiment cycle again. While the amount of funds for Bitcoin spot ETF continues to grow, when Bitcoin price can break through the previous high in March has become the focus of many people again. Odaily Planet Daily will summarize and compile the key indicators of Bitcoin price breaking through the new high shared by 10x Research in this article for readers reference. (Note: This article is only a sharing of 10x Researchs views and does not constitute investment advice.)
Key indicators for Bitcoin price growth
For most people, the rise and fall of Bitcoin prices seem to be random fluctuations and unpredictable, but we want to point out the key drivers of Bitcoin prices. If we have a correct understanding of these factors, we can relatively accurately judge the turning points and subsequent trends of Bitcoin prices. It is no coincidence that Bitcoin prices were slightly weak in January this year, soared all the way into March, but entered a consolidation state in the past two months.
Bitcoin critical turning point has arrived
Two weeks ago, Bitcoin entered a critical turning point.
Retail trading volume (measured in South Korea) has been weak , which suggests that retail investors do not understand what is happening in the broader Bitcoin market and are likely getting caught up in FOMO (fear of missing out). We are confident that Bitcoin will soon reach new all-time highs, and this report and more information to come will help us convince readers that this is indeed the case.
Year-to-date, about $54.6 billion has flowed into the cryptocurrency market, including $25.6 billion in stablecoins, $15.5 billion in leveraged perpetual futures, and $13.5 billion in Bitcoin spot ETFs. Although this analysis does not cover several smaller data points, it has already sorted out the sources of most of the funds.
Below, we will show you when these flows stop, when they resume, and whether they will continue. This information will be crucial in determining the direction of Bitcoins price (up or down).
Bitcoin and various capital flows (stable coins, ETFs, futures leverage)
Since the Bitcoin halving on April 20, the inflow of stablecoins has slowed down significantly. After the halving, USDT issuer Tether completed its own inflow of $2.7 billion, while USDC issuer Circle completed an outflow of $500 million. For comparison, from the beginning of the year to now, Tether has accumulated $20.1 billion in inflows.
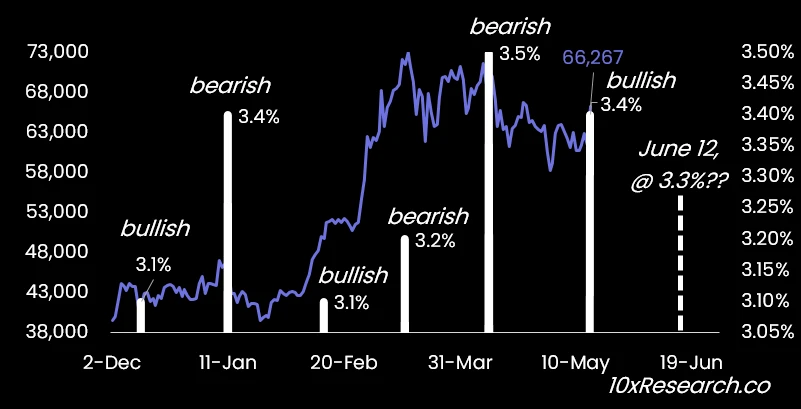
When the Bitcoin spot ETF began trading on January 11, we saw $611 million in net ETF inflows, with a staggering $4.6 billion in first-day Bitcoin spot ETF volume. Despite billions of dollars in stablecoin issuers preparing for this, January buying volume was disappointing.
Part of the disappointment came from the massive outflows from Grayscale GBTC ETF, but the main reason was the unexpected rise in inflation on January 11, with the CPI index hitting 3.4%, higher than the expected 3.2% and higher than the 3.1% recorded last month.
When the CPI index was released on February 13th at 3.1%, lower than the expected 3.4%, indicating a slowdown in inflation, the inflow of funds into the Bitcoin spot ETF gradually resumed. ETF inflows turned from negative to positive at the end of January, but did not begin to accelerate slightly until the release of the CPI data on February 13th. However, when inflation rose again to 3.2% on March 12th, the inflow of funds into the Bitcoin ETF stopped immediately because the market ruled out the expectation of 2-3 rate cuts.
Bitcoin price trends and market sentiment in the past six months
In other words, (sort of) Bitcoin changes direction depending on whether CPI is higher than the previous month (bearish for a high CPI, bullish for a low CPI).
The result was a gradual decline in the price of Bitcoin from around $73,000 to around $60,000, before the decline was finally slowed by dovish Fed Chairman Powell鈥檚 remarks on March 20, who assured the market that the Fed expected to cut interest rates three times in 2024.
A similar situation occurred on April 10 when CPI exceeded expectations of 3.4% to 3.5%, with Bitcoin falling again to $60,000 and dropping to around $56,500 on April 30 amid weak Hong Kong ETF flows.
Repeating the same old trick, at the FOMC meeting on May 1, Federal Reserve Chairman Powell took action again to stop the downward trend of Bitcoin.
On May 15, the CPI report came in at 3.4% as expected (down from 3.5% last month), but in line with expectations. More importantly, Bitcoin spot ETF inflows resumed. Traders who understand how Bitcoin reacts to CPI should have the confidence to trade in the opposite direction of last month鈥檚 CPI reading.
From March 12, when the CPI rose to 3.2%, to May 15 (a total of about 46 days), when the CPI data was consistent with the market forecast of 3.4%, the amount of funds purchased by Bitcoin spot ETFs was only US$1 billion; and since May 15, we have seen inflows of about US$1.5 billion for 7 consecutive days.
With the next release of CPI data scheduled for June 12, we expect Bitcoin spot ETF inflows to remain strong over the next two weeks, which should help Bitcoin reach new all-time highs.
When the market expected another disappointing increase in inflation on May 15, our model predicted a small drop in the price of Bitcoin. When we model inflation for the next two months, we may see inflation hovering around current levels and a downward trend soon. If inflation indexes to 3.3% or lower, the price of Bitcoin should set new all-time highs.
This will continue to provide some motivation for Bitcoin spot ETF investors to allocate Bitcoin and support Bitcoin prices.
Our model predicts that inflation will gradually become less of a problem. It will not only become a moderately strong contributor, but it will likely become a strong contributor as we head into the end of the summer, as the model predicts that inflation will gradually decline.
This article is sourced from the internet: 10x Research: When will Bitcoin break a new high? Look at this key indicator
GameCene, a Web3 game publishing platform, has announced the successful completion of its seed funding round, raising $1.4 million. This funding will fuel GameCene’s growth, accelerate the development of its platform, expand its diverse game library, and further streamline the management and monetization of user assets. GameCene: A Catalyst for the Web3 Gaming Revolution GameCene’s mission is to bridge the gap between Web2 developers and players, enabling them to seamlessly transition into the world of Web3 gaming. The platform offers a novel gaming ecosystem for players, providing unique entertainment experiences and empowering the effective monetization of in-game assets through Web3 technology. Omni-chain Game SDK: Empowering Game Developers GameCene’s Omni-chain Game SDK empowers millions of developers to effortlessly build and distribute blockchain games. The SDK provides a comprehensive suite of tools…