BNB Coin’s price is close to breaking and making records following a struggle to find the right moment.
After failing multiple breaches, BNB is ready to break out if the investors can help.
BNB Investors Exhibit Bullishness
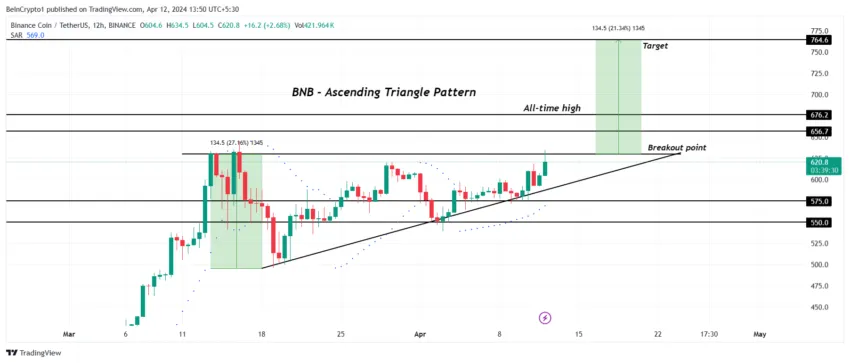
BNB Coin’s price is trading at $621 within an ascending triangle pattern, and to break out of it, the Binance native token will have to find support first. Fortunately for the cryptocurrency, investors are seemingly in a mood to accumulate.
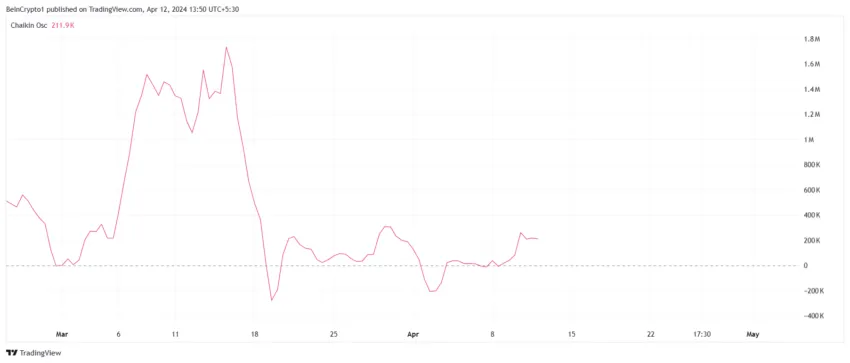
This is verified by the uptick in the Chaikin Oscillator, which indicates whether the asset in focus is observing buying or selling pressure. A rise above zero suggests that buying pressure is increasing, which is also the case with BNB.

Considering this as a hint of potential accumulation, the asset does seem to be in a good state to draw further investment.
Read More: BNB: A Comprehensive Guide to What It Is and How It Works
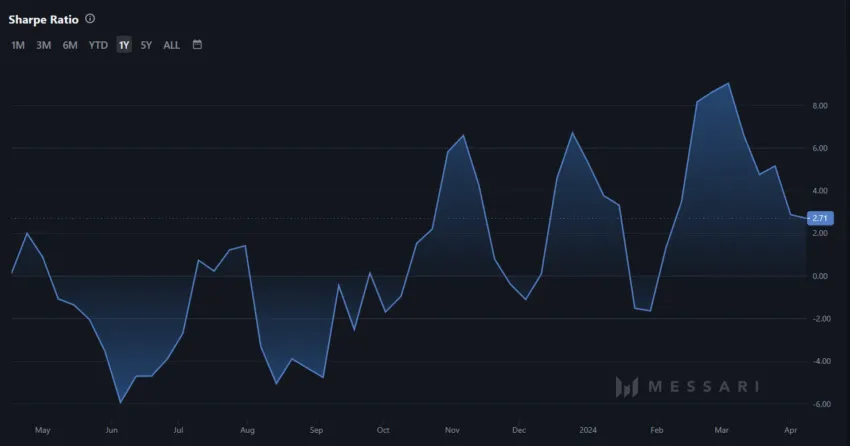
Furthermore, BNB Coin is seemingly a good option to invest in, given its Sharpe Ratio is at 2.71 at the moment. The Sharpe ratio measures the risk-adjusted return of an investment by comparing its return to its volatility. A higher value indicates better risk-adjusted performance.

Thus, BNB will likely post good risk-adjusted returns, which will attract new investors to the asset and, in return, boost BNB Coin’s price.
BNB Price Predicition: Awaiting a Breakout
BNB Coin’s price action is currently constricted within an ascending triangle pattern. A horizontal resistance line and a rising trendline characterize this bullish continuation pattern. It indicates increasing buying pressure and potential for an upward breakout.
Based on the pattern, the target for the Binance native token following a breakout is $764, marking a 21% rally. However, the more realistic outlook is that owing to the aforementioned cues, BNB Coin’s price will certainly cross the present all-time high of $676 to mark new highs.

Read More: How To Buy BNB and Everything You Need To Know
However, if the BNB Coin’s price fails, the breach of $656 falls through the lower trend line of the pattern, and it could drop to $575. Losing this level would invalidate the bullish outlook, followed by a decline to $550.


