Shiba Inu’s price shows signs of a massive rally but is awaiting a bullish trigger, which might come sooner than expected.
Consequently, the meme coin could note new highs, provided it manages to breach through some crucial resistances.
Shiba Inu to Jump on the Charts
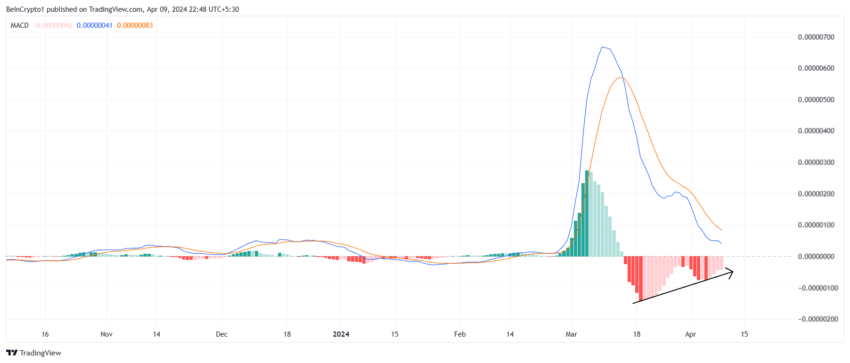
Shiba Inu’s price is currently trading within a symmetrical triangle pattern aided by increasingly bullish market cues. The first of these is the Moving Average Convergence Divergence (MACD). This trend-following momentum indicator is used to identify potential buying and selling opportunities.
At the moment, this indicator is exhibiting receding bearishness. The double bottom formed by its bars on the histogram indicates increasing bullishness in the market. This would be confirmed once a bullish crossover occurs.

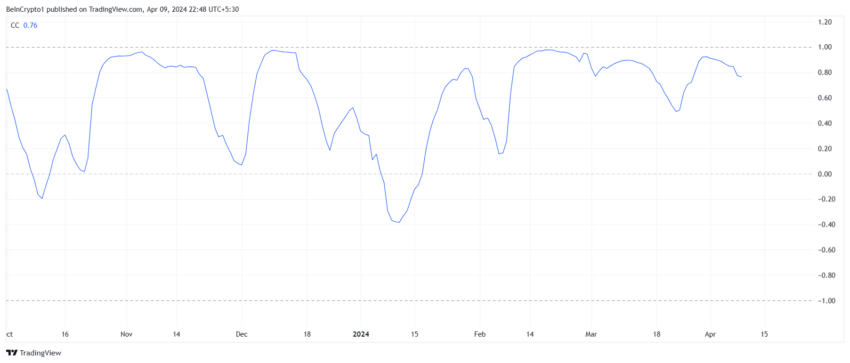
Secondly, the meme coin is attempting to chart its own path, escaping the influence of the biggest cryptocurrency in the world, Bitcoin. The correlation SHIB shares with BTC, despite being positive, is declining at the moment.
This shows that the dog-inspired token could be deviating from the bearish cues set by Bitcoin. Such a development would help the cryptocurrency to rise.
Read More: 6 Best Platforms To Buy Shiba Inu (SHIB) in 2024

SHIB Price Prediction: Ready to Rally
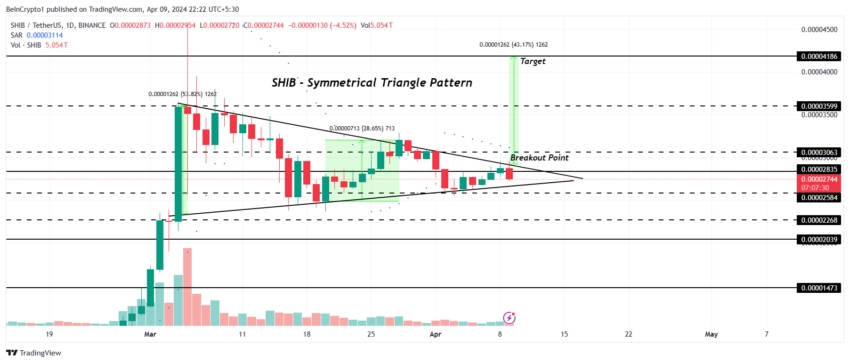
Shiba Inu’s price is in a symmetrical triangle pattern at the time of writing, changing hands at $0.00002744. A symmetrical triangle pattern is formed by converging trendlines, indicating a period of consolidation. It usually hints at an upward or downward breakout, signaling a potential continuation of the previous trend.
SHIB is close to breaking out, and based on the targets set by the pattern, the meme coin could chart a 43% rise. This would send Shiba Inu’s price to $0.00004816.
Read More: How To Buy Shiba Inu (SHIB) and Everything You Need To Know

However, if the altcoin fails to breach a flip, the resistances marked at $0.00003063 and $0.00003500 could fall back. Falling through the lower trend line of the pattern would cause an invalidation of the bullish thesis, pushing SHIB to $0.00002400.


