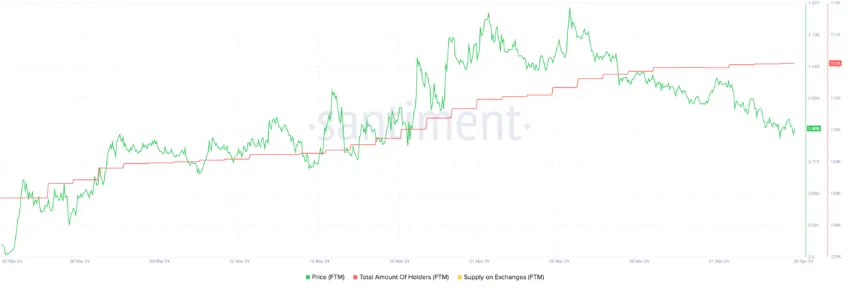
The Fantom (FTM) price has experienced a notable correction of 32.79% since March 25 amidst signs of decreasing investor interest and potential selling pressures. This downturn is highlighted by the stagnation in the number of FTM holders since last week, pointing towards a cooling-off period.
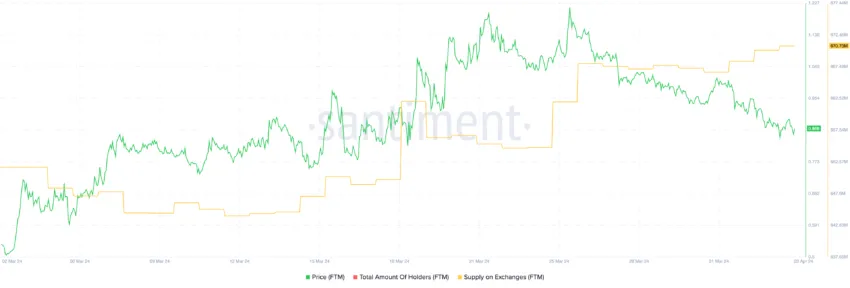
Additionally, the consistent growth in Fantom’s supply on exchanges since March 25 suggests that selling pressures could intensify, with the possibility of further price corrections in the near term.
FTM Holders Holders in Disbelief
Between March 17 and March 28, Fantom witnessed a remarkable increase in holders. It grew from 109,930 to 111,280, averaging 122 new holders daily, alongside a significant price surge from $0.78 to $1.03.
This period even saw a peak price of $1.25 on March 25, indicating strong market enthusiasm. However, this momentum took a downturn post-March 28, reaching an average of just 30 new holders per day. That represents a drastic fall from its previous growth rate, leading to a sharp correction price correction from $1.03 to $0.84.

This stark reduction in the rate of new holders is a bearish sign for FTM’s price. It reflects a waning investor interest and a possible shift in market sentiment from bullish to cautious or bearish.
Read More: 9 Best Fantom (FTM) Wallets in 2024
Moreover, the FTM supply on exchanges has risen from 654.83 million to 670.73 million. It is worth noting that an increasing supply on exchanges usually signals a price drop. It suggests that more holders are looking to sell, which can push the price down due to higher selling pressure.

The influx of FTM to exchanges, especially in such a significant amount, suggests that investors might be losing confidence in the token’s short-term price trajectory, opting to liquidate their holdings instead of holding onto them for potential future gains.
Fantom Price Prediction: Lower Lows
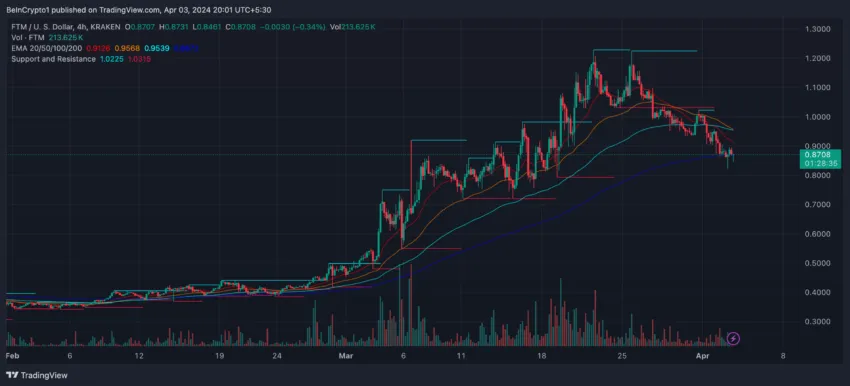
The Exponential Moving Averages (EMA) on Fantom’s 4-hour chart have formed a “death cross.” This is a technical chart pattern indicating the potential for a significant sell-off. It occurs when a short-term EMA crosses below a long-term EMA.
If the downtrend persists, FTM’s price could approach the $0.71 support zone. A failure to hold this level could precipitate a further decline to $0.55, amounting to a potential 38% correction from its current price.
Read More: Top 5 Yield Farms On Fantom

Still, a positive development about the Fantom’s Sonic could help in the reversal of this trend. If that happens, a breakthrough above the $0.98 resistance could pave the way for FTM to retest the $1.22 zone, potentially signaling a bullish turnaround for the cryptocurrency.


