
Litecoin (LTC) price seemed to be doing well for itself having reclaimed the $100 level as a support.
But this silver to Bitcoin’s gold will likely make an about-turn, to fall back on the daily chart due to this reason.
Litecoin Price to Bow to the Bears
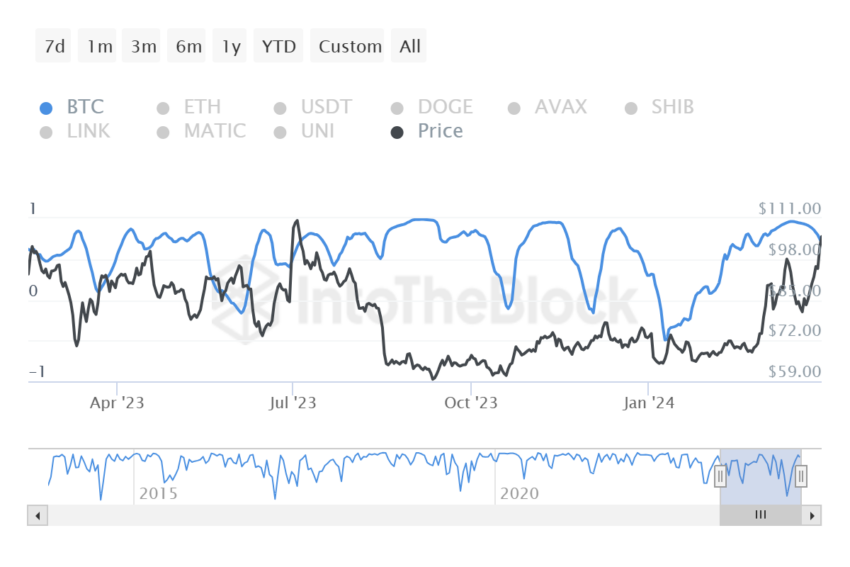
One of the biggest advantage driving Litecoin price upward was its strong correlation with Bitcoin. Since the world’s largest cryptocurrency remained either consolidated or noted gradual recovery eventually, BTC had a stable price action, which rubbed off on LTC, too.
However, LTC and BTC coordination at the time of writing is declining from 0.89 to 0.7. This is not the best news for LTC since, historically, correlation decline has resulted in the altcoin falling on the charts.
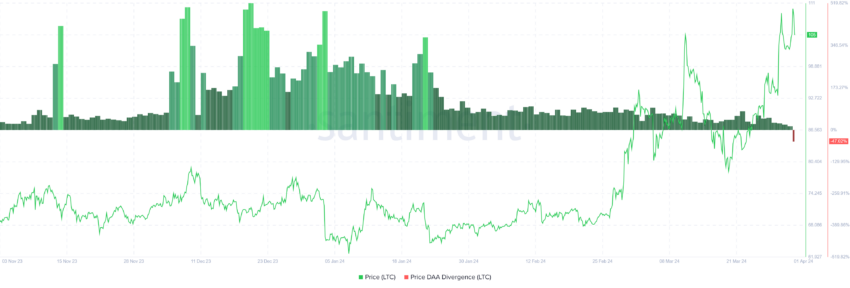
To add to this bearishness is the Price Daily Active Addresses (DAA) divergence metric, which hints at bearishness. Generally, when the price is low and investors’ participation is high, it is considered to be a buy signal.
Read More: 7 Best Litecoin (LTC) Wallets for 2024
However, the condition of metrics at the moment is such that the price is high, but the active addresses are low. This means that the indicator is flashing a sell signal, which is generally considered to trigger a major price correction.
Hence, the possibility of Litecoin’s price falling on the charts is pretty high, and even Bitcoin might not be able to save the altcoin.
LTC Price Prediction: Goodbye $100?
Litecoin price, owing to the broader bearish cues, failed to secure a rise today. During the intra-day trading hours, LTC shot up by close to 7.5% before losing it all to fall back to $105.
Price indicators, Average Directional Index (ADX), and Moving Average Convergence Divergence (MACD) indicators are both bearish. The latter, a trend-following momentum indicator used to identify bullish and bearish trends, is also losing the bullish momentum.
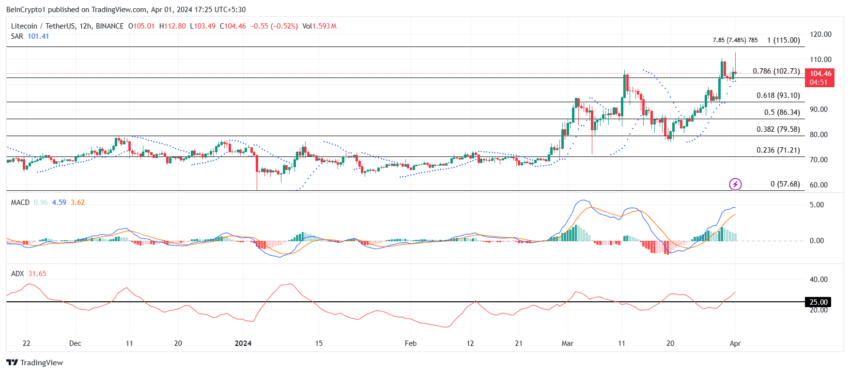
The ADX, on the other hand, has managed to breach the threshold of 25.0 but will not sustain it. This means that the active bullish trend will eventually vanish and turn into a bearish trend.
This would result in Litecoin price losing the $100 support and fall to $93.
Read More: How To Buy Litecoin (LTC) and Everything You Need To Know
However, if the $100 support is sustained, LTC will find some support to prevent a crash and likely bounce back. Breaching past $110 will invalidate the bearish thesis, sending Litecoin price to $115.


