
Cardano (ADA) price is adhering to the broader market cues which suggest that the altcoin is due for a decline.
However, looking at the investors’ behavior, there seems to be a demand for an increase in price.
Cardano Investors Continue to be Optimistic
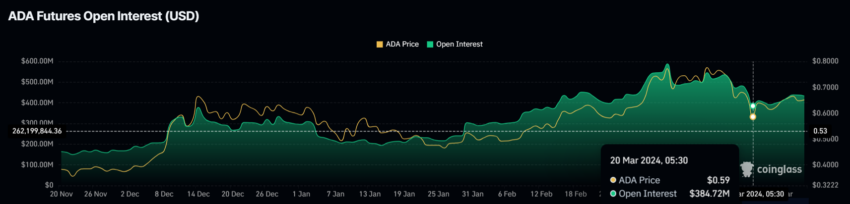
Cardano price action is barely impacting the investors as their optimism is dominating the broader market’s bearish cues. This is evident from the flow of money into the asset within the derivatives market.
Open interest refers to the total number of outstanding derivative contracts, such as futures or options, that have not been settled or closed by the end of a trading day. It reflects the total amount of money at stake in these contracts and represents the market’s interest in them.
Generally, high open interest (OI) suggests high market activity and liquidity, indicating strong trader interest and potential price volatility. Conversely, low open interest may indicate limited market activity and less interest from traders.
This OI has seen a 12.7% surge in the past week from $384 million to $433 million in the span of seven days. Investors are largely making bullish bets, which is also reflected in the positive funding rate.
 .75 Next?" />
Read More: Cardano (ADA) Price Prediction 2024/2025/2030
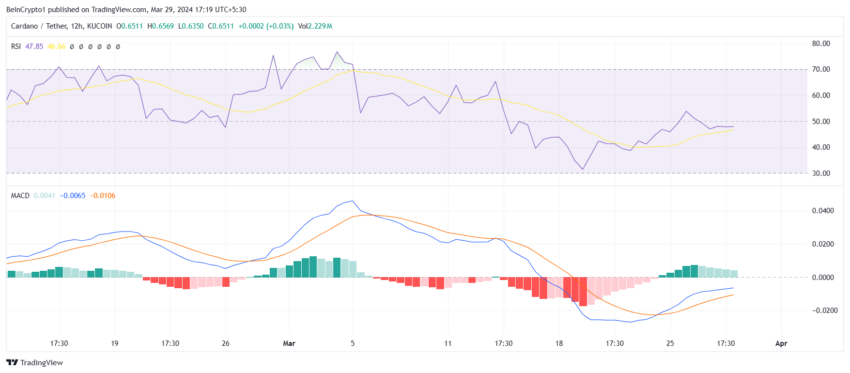
This bullishness could result in the price indicators observing bullish cues again. The Relative Strength Index (RSI) and Moving Average Convergence Divergence (MACD) are sending mixed signals at the moment.
RSI is at the cusp of a bullish breakout, which will be confirmed once it flips the neutral line marked at 50.0 into support. MACD, on the other hand, is sustaining its bullish crossover, but the same is losing momentum.
 .75 Next?" />
Should investor’s bullishness extend to the price indicators as well, Cardano price could bounce back.
ADA Price Prediction: What It Needs for a 14% Rally
Cardano’s price trading at $0.65 just slipped below the week-long uptrend line, which also resulted in the altcoin losing the support of the 50 and 100-day Exponential Moving Average (EMA). Thus, if the aforementioned factors contribute to a rise, ADA could reclaim these EMAs and continue the uptrend.
This would push the third-generation cryptocurrency above the resistance level marked at $0.68. Flipping this into support would enable ADA to cross above $0.70, whereas Cardano would be eligible to rally toward $0.74, marking a 14% rise.
 .75 Next?" />
Read More: How To Buy Cardano (ADA) and Everything You Need To Know
However, if the support of $0.63 is lost, Cardano’s price would be vulnerable to a decline to $0.60, losing which would send it to $0.59. This price level is in confluence with the 200-day EMA, and falling to it would invalidate the bullish thesis.


