Amidst the domination of altcoins such as Ethereum, Solana, Cardano, and many more, investors tend to miss out on some of the lesser-known cryptos.
Thus, BeInCrypto has analyzed such cryptocurrencies, which might not be at the top of the list but are still expected to run up in the coming weeks.
Aptos (APT) Is Set to Go Big
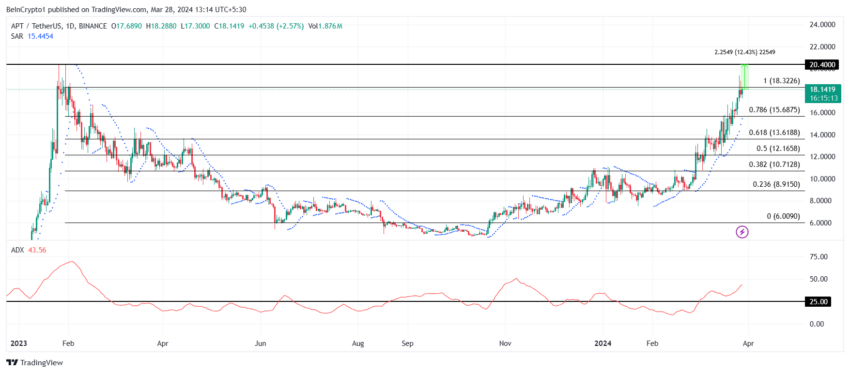
Aptos price has surprised the entire market with its recent rally, which brought it closer to breaching the previous all-time high (ATH) of $20.4. APT now stands less than 12.5% away from pushing through and charting new ATH.
The bullish trend is already gaining strength, as evidenced by the Average Directional Index (ADX). The indicator above the 25.0 threshold signals that the active trend is strengthening, which, in the case of APT, is an uptrend.

However, if Aptos price fails to cement $18.32 as a support floor, it could fall back down below $16, which would invalidate the bullish thesis.
Thus, it is important to keep a watch on the token.
Read More: Top New Crypto Listings To Watch In March 2024
Gala (GALA) Is Set for a 26% Increase
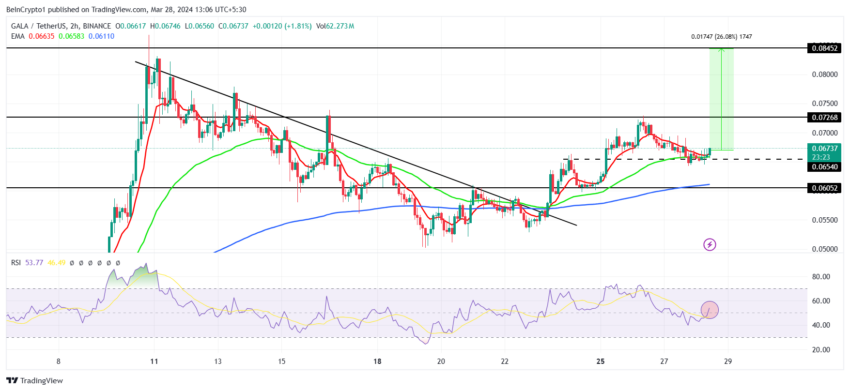
Gala price, after crossing the $0.080 mark earlier this month, began trending downwards, nearly losing the $0.050 support line. However, in the past few days, the cryptocurrency managed to breach the downtrend and rally further to test $0.065 as a support line.
The cryptocurrency now stands about 26% away from marking new year-to-date highs. Additionally, the Relative Strength Index (RSI) hints at certain bullishness. The indicator is a momentum oscillator indicating overbought and oversold conditions, which just crossed into the bullish zone.

This means GALA has a shot at continuing the rally, which would send it $0.084.
Nevertheless, if the altcoin loses the support at $0.065, the Gala price could trickle down to $0.060, which would invalidate the bullish outlook.
Read More: Top Crypto Exchanges in Australia in 2024
Kaspa (KAS) Is Set to Validate This Bullish Pattern
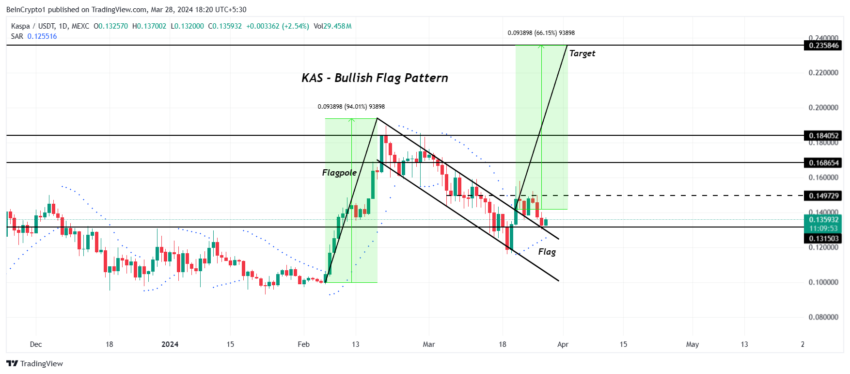
Kaspa price, which had a great run last month, was stuck in a descending channel for the past month. The altcoin broke out of it a week ago and is presently trading at $0.135, testing the support level of $0.131.
This price action resulted in the formation of a bullish flag pattern. This is a continuation pattern where the price temporarily consolidates in a narrow range after a sharp upward move. This signals a potential continuation of the previous uptrend.

Per this pattern, KAS is expected to chart a 66% growth, with the target price marked at $0.235. This makes Kaspa a coin to watch out for.
Read More: 7 Best Base Chain Meme Coins to Watch in 2024
However, if the support at $0.131 is lost, the bullish thesis could be invalidated, and KAS could fall below $0.120.


