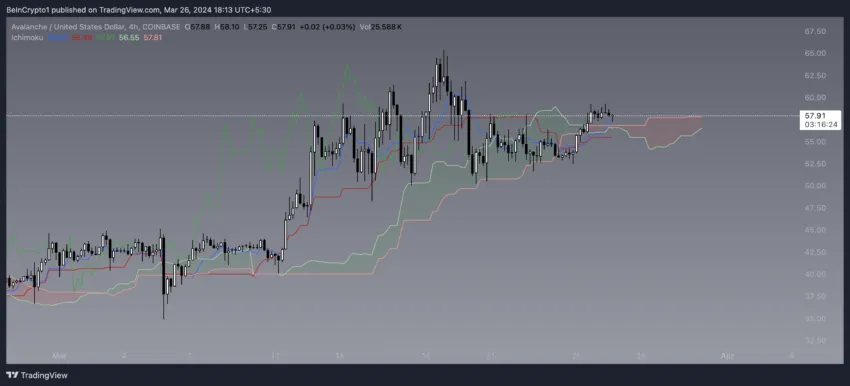
The AVAX price grew by 8.15% over the past week, buoyed by bullish trends signaled by the Ichimoku cloud lines, indicating a potential for further growth of Avalanche. Currently, three-quarters of AVAX investors find themselves in the green, a significant statistic often preceding pivotal asset value movements.
This upswing in market sentiment and technical indicators fuels speculation on whether such positive signs could push AVAX’s price toward the $70 mark. Investors and analysts alike are closely monitoring to see if this current wave of optimism signals a transformative phase for AVAX.
AVAX Currently Has 75% of Holders at Profit
An impressive three-quarters of AVAX holders, equating to some 5.72 million addresses, are now seeing profits following a recent uptick in the coin’s value – a noteworthy shift from the 50-60% profitability range that had been the norm over the preceding months.

The “Historical Break Even Price”, a vital metric revealing the average price at which all current holders would break even, shines a spotlight on the investment’s cumulative profitability. Notably, a previous climb to this 75% profitability threshold in 2021 preceded a sharp increase in AVAX’s price from $75 to $117 in just 20 days.
Currently, with 21.95% of holders still in the red and AVAX trading 59.74% below its peak, the likelihood increases that these investors might hold onto their assets in anticipation of further gains rather than sell, especially considering the coin’s distance from its historical high.
Read More: Avalanche (AVAX) Price Prediction 2024/2025/2030
Ichimoku Clouds Are Drawing a Potential Bullish Scenario
The Ichimoku analysis of AVAX reveals a moderately bullish sentiment due to the price positioning above the cloud, which tends to indicate an upward trend. The cloud appears to be changing color from red to green, suggesting a shift towards a bullish market as Span A rises over Span B.
The Conversion Line, which represents short-term price momentum, is above the Base Line, a medium-term momentum indicator, further confirming the bullish sentiment for AVAX. The Lagging Span, however, is within the price range from 26 periods ago, indicating a lack of strong momentum, as ideally, it should be above the price action for a strong bullish confirmation.

The Ichimoku Cloud is a technical analysis method that paints a dynamic picture of market trends and potential support or resistance areas on a chart. It combines five lines that show short to long-term price action and future projections, forming a ‘cloud’. A price above the cloud signals bullish conditions, while below indicates bearish trends.
The interplay of these lines also gives insights into market momentum and can signal potential reversals or continuations of trends. The price action remains above the Base Line, yet it closely follows the Conversion Line, which sometimes can act as a first level of support in an uptrend.
The absence of a bearish crossover, where the Conversion Line would drop below the Base Line, maintains the bullish outlook. As shown in the chart, the volume indicator is relatively low, which could question the strength of the current trend, and traders might look for an increase in volume to confirm further bullish advancement.
AVAX Price Prediction: Will It Reach a 2-Year High?
AVAX’s price hasn’t reached $70 since April 2022. That could happen soon if AVAX is able to break some resistances ahead.
The In/Out of the Money Around Price (IOMAP) chart for Avalanche (AVAX) displays a concentration of support at the $53 to $54.75 price range, where holders acquired the largest volume of AVAX tokens. This is reflected in the presence of substantial green bubbles, indicating these holders are ‘in the money’ and might act as a buffer against price declines.

The IOMAP chart is a visual tool that illustrates price levels where significant numbers of asset purchases have occurred, showing potential support and resistance zones based on the current price. It highlights where holders might be making a profit (‘in the money’), breaking even (‘at the money’), or experiencing a loss (‘out of the money’).
Green areas signal large clusters of profitable purchases, indicating potential support, while red areas denote unprofitable ones, suggesting resistance.
Read More: 11 Best Avalanche (AVAX) Wallets to Consider in 2024
On the flip side, resistance is building up in the $63.43 to $65.14 zone, as shown by the red bubbles, suggesting a sizable amount of AVAX tokens were purchased at these levels, placing those holders ‘out of the money.’
However, these resistances are not as strong as the close supports AVAX current has, which could indicate that if it can break the following resistances, if could easily continue the uptrend toward $70.


