The Shiba Inu price is presently on the verge of bringing significant profits to its investors. The target is not too far either, but the meme coin is losing the bullish momentum necessary to make this happen.
However, if things go sideways, the chances of Shiba Inu making it to the target and generating profits will be rather bleak.
Shiba Inu Price Dip Is Likely
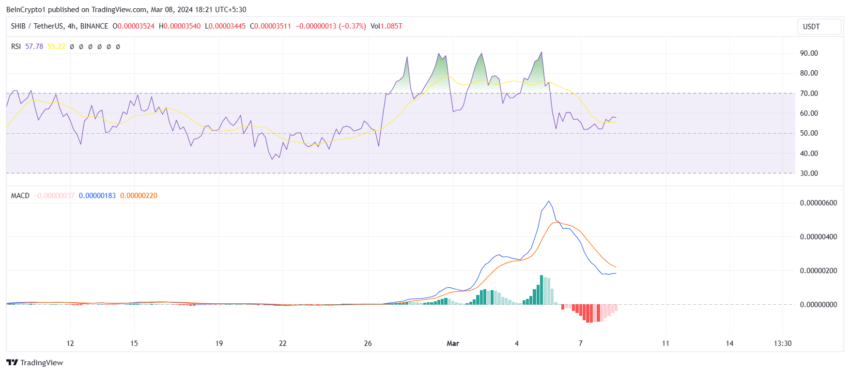
Shiba Inu price has managed to chart significant growth, but this increase has slowed down in the last three days. Since March 5, the Relative Strength Index (RSI) and the Moving Average Convergence Divergence (MACD) have been observing bearish development.

The Relative Strength Index (RSI) measures the magnitude of recent price changes to evaluate overbought or oversold conditions in a market. A high RSI indicates overbought conditions, potentially signaling a price correction, while a low RSI suggests oversold conditions, potentially indicating a buying opportunity.
The Moving Average Convergence Divergence (MACD) is a momentum indicator that shows the relationship between two moving averages of a security’s price. It consists of a MACD line and a signal line. Crossovers between these lines indicate changes in trend momentum, with bullish signals occurring when the MACD line crosses above the signal line and bearish signals when it crosses below.
The former is still sustaining above the neutral line, which is slightly optimistic, while the latter is already posting bearish red candles.
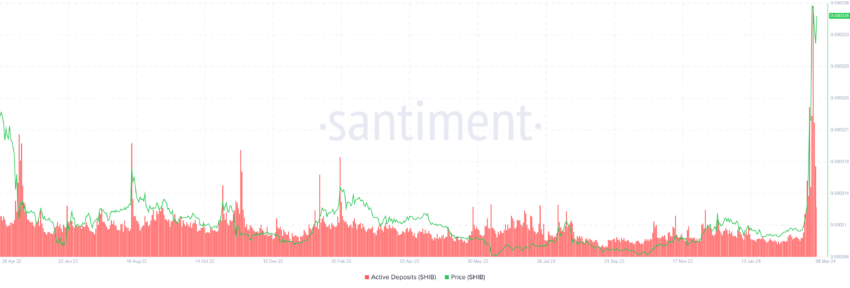
In addition, Shiba Inu investors are looking to lock in their profits by offloading their holdings. Profit booking is generally signaled by the movement of tokens into the exchange addresses, and the same can be noted in the spike noted in Active Deposits.

This spike hints at SHIB holders looking to book profits by depositing their supply onto the exchange wallets. Thus, if selling does take place, the outcome will be rather bearish for the Shiba Inu price, resulting in a decline.
SHIB Price Prediction: This Could Be Avoided Though
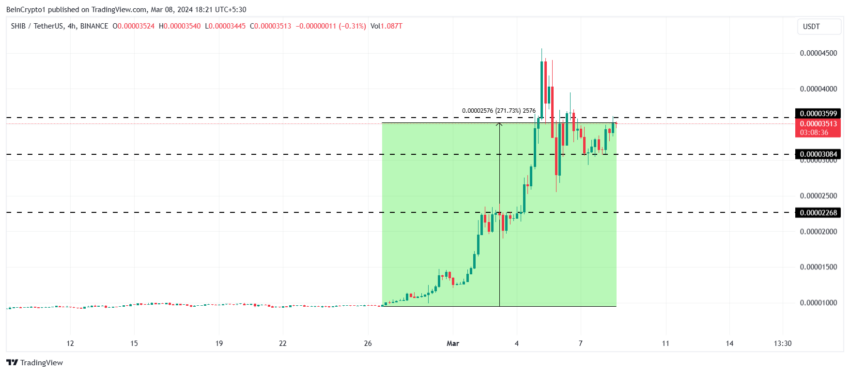
Shiba Inu price is presently trading at $0.00003513, charting a 271% growth in the last two weeks. If the above-mentioned conditions influence the price action, a drawdown to $0.00003084 is likely. However, the meme coin at the moment is close to breaching the $0.00003599 resistance level.

This barrier is significant because about 46.32 trillion SHIB tokens worth $1.6 billion were bought between $0.00002800 and $0.00003599. Once this level is flipped into support, the entire supply would become profitable.

This would potentially reignite the bullishness among investors, preventing them from booking profits “early.” Consequently, the SHIB price would also provide another opportunity to gain further. It could potentially even breach $0.00004000, invalidating the bearish thesis.


