
Polkadot’s (DOT) latest technical indicators signal potential stormy weather ahead. A bearish EMA crossover on the hourly charts suggests a loss of upward momentum for the DOT price, while the RSI trends indicate that the asset may be overbought.
These technical patterns suggest that Polkadot’s recent support level at $10 could soon face a stern test. Investors and traders should brace for choppy waters as bearish signals take the helm in the short to mid-term.
DOT Development Activity Drops
DOT development activity rose from 13.10 on February 13 to 17.85 on March 1, accumulating a 36.26% growth in roughly 2 weeks. However, after that huge improvement in development activity, it fell deeply from 17.14 to 15.29 between March 7 and March 8.
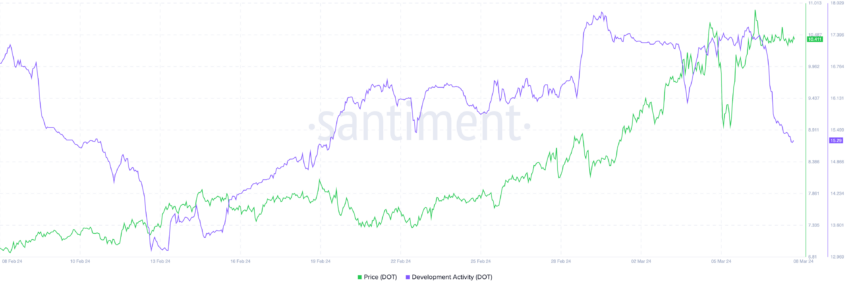
Historically, development activity growth rates and DOT prices seem to be correlated. However, this correlation has been weaker in the last few weeks, which means a possible detachment between these metrics. As we can see, despite the decrease in development activity, prices grew at the beginning of February 2024.
However, as these metrics are historically correlated, we could expect that it’s pretty possible that DOT price could be heavily affected by this recent strong decrease in development activity.
RSI Levels Are Concerning
DOT Relative Strength Index (RSI) levels recently crossed the 74.7 mark. An RSI reading at this level suggests that the asset is potentially overbought. This means that the asset’s price may be considered too high relative to its recent price history, and it could indicate a reversal or pullback in price might be forthcoming.
A correction did not immediately follow the last time the DOT RSI level crossed 74. In fact, after that, the price grew from $6.12 to $9.07. However, after that peak, it decreased to $6.71 in 7 days, a 26% correction.
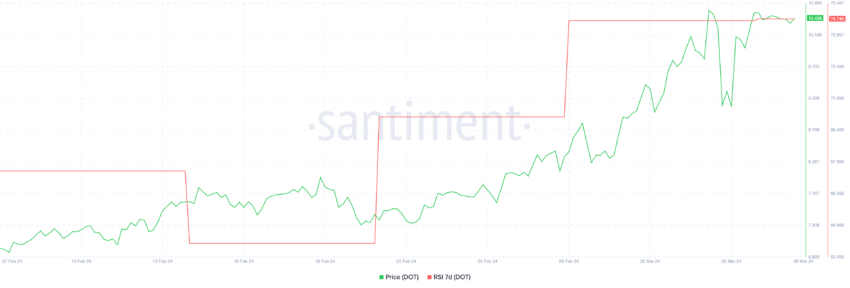
The RSI is calculated based on average price gains and losses over a specified period. It uses price changes from one period to the next to determine if the momentum is up or down. Typically, an RSI above 70 is considered overbought, while an RSI below 30 is considered oversold.
Although an RSI above 70 doesn’t necessarily implicate an immediate correction, it’s important to keep an eye on it since it grew from 64 to 74 in 2 weeks.
DOT Price Prediction: Bearish Signals from EMA Crossover
One of the most telling indicators for future price movements is the Exponential Moving Average (EMA) crossover.
For DOT, the immediate support level lies around $10, a point that previously saw significant buying interest. This level could open the gates for further declines if it fails to hold. This could make DOT fall into $8.50 levels. Conversely, the recent high of $11.21 acts as a resistance level. A break above this could invalidate the bearish thesis and set the stage for a retest of higher prices.
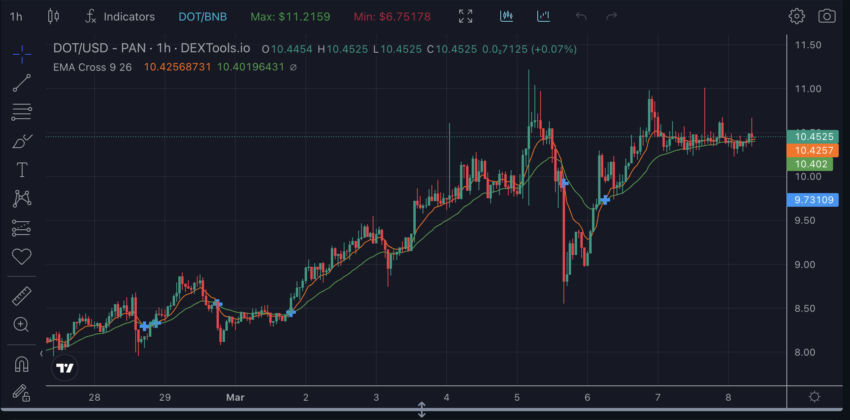
The Exponential Moving Average (EMA) is a specific variant of the moving average that prioritizes recent data points more heavily than older ones, thereby assigning greater importance and influence to the latest market activities. This calculation method ensures that the EMA responds more sensitively to recent price changes.
When the EMA that tracks short-term trends (for example, over a 9-day period) crosses beneath the EMA designed to reflect mid-term trends (such as a 26-day period), this event is typically seen as a bearish indicator.
In DOT’s case, the 9-hour EMA looks poised to cross below the 26-hour EMA, a classic red flag waving in the winds of change, signaling that the price might trend downward in the mid-term.


