Litecoin price is experiencing significant growth, yet on-chain data reveals that many metrics remain stable. Is this growth a result of the broader cryptocurrency bull market, or is it tied to LTC fundamentals?
The confluence of trading volumes, transaction activities, and active addresses paints an interesting picture. What does this confluence signal for Litecoin’s trajectory toward the elusive $100 threshold?
Litecoin Daily Trading Volume Jumps Over $1 Billion
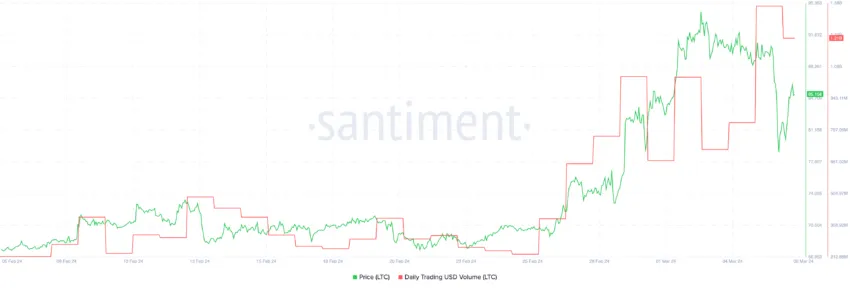
An abrupt increase in Litecoin’s daily trading volume, a pivotal metric for gauging investor interest and market liquidity, has caught the market’s attention. The volume has soared from $391 million on February 20 to $1.3B on March 5, a staggering 232.48% growth.

The last time the daily trading volume in USD for LTC exceeded $1 billion, the price fell by 40% the following month.
The volume surge suggests momentum is building in conjunction with the price itself, which has recently seen a rise to $94 and then a retraction to $85.16. The question is whether this uptick is a precursor to sustained growth or a transient spike before a correction.
But trading volume may not cover the whole picture. On-chain metrics can provide a more complete analysis.
The Number of Transactions Has Remained Stable in Recent Months
Litecoin’s 7-day average of transactions is a solid 225,700 per day. However, since a peak of 956,000 on January 22 and 353,240 on January 25, the number of transactions didn’t exceed 300,000 transactions per day.

LTC price grew from $68.30 on February 23 to $94 on March 2, a 38% growth in less than 10 days. However, the number of transactions became pretty stable during that same period, always around 230,000 daily transactions.
In June 2023, we had a similar picture when the Litecoin price skyrocketed by 41.56% in 2 weeks while the number of transactions remained stable. After that, the price declined by 41.82% in the following month.
New Addresses and Active Addresses Are Not Following the Price Trend
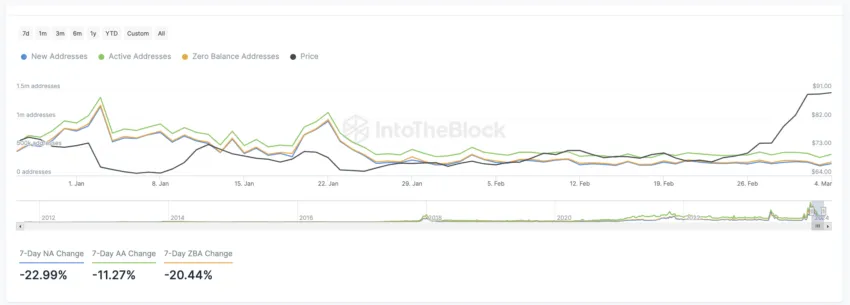
The last two surges in the number of Active and New Addresses interacting with Litecoin led to price declines on January 2 and January 22. After that, both address growth and price became pretty stable until February 23, when the price started to rise again.

However, during this current price increase, New Addresses are stable at around 200,000 per day, and Active Addresses are around 400,000.
Historically, the number of new and active addresses appears to have a solid correlation with the LTC price, and the recent price decoupling is a good indicator that this recent growth could be more related to the macro crypto movements rather than fundamentals.
Whales Accumulating Litecoin Are on the Rise
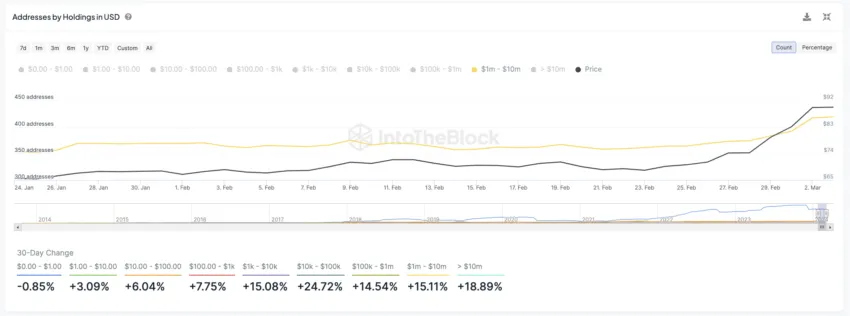
In the last 30 days, the count of addresses holding between $1M and $10M in LTC increased by 15%, and in the last week alone, this group expanded by 86%, rising from 364 to 419 addresses over the 30-day period.
Meanwhile, the larger whales, or addresses with over $10M in LTC, also increased in the past week. Their numbers grew 15% in just 7 days, from 94 to 107 addresses.

Although the number of transactions and addresses is stable, whales are accumulating more LTC, which indicates that these sophisticated investors are bullish on its potential, even after the recent price increase. However, it’s important to note that the growth observed in these wallets may also be a consequence of price increases, as the USD value of holdings in wallets that were not previously considered whales has benefited from the recent climb in price for LTC.
Litecoin Price Prediction: Is $100 Coming Next?
The price of LTC is still 79% below its all-time high, which could indicate high growth potential in the coming weeks. The number of whales accumulating LTC is also a bullish signal.
However, caution is necessary, as on-chain metrics like transactions and the number of addresses have remained stable over the last 10 days. This might mean that the recent growth of LTC could be linked to the overall crypto market’s growth rather than investors truly betting on Litecoin’s fundamentals, which could imply corrections ahead after the recent rally.


