The XRP price has increased during the past two weeks, closing above a long-term support level it had previously lost.
Will this lead to a more significant upward movement, or will XRP continue consolidating like it did in most of 2023? Let’s find out!
XRP Closes Above Long-Term Support
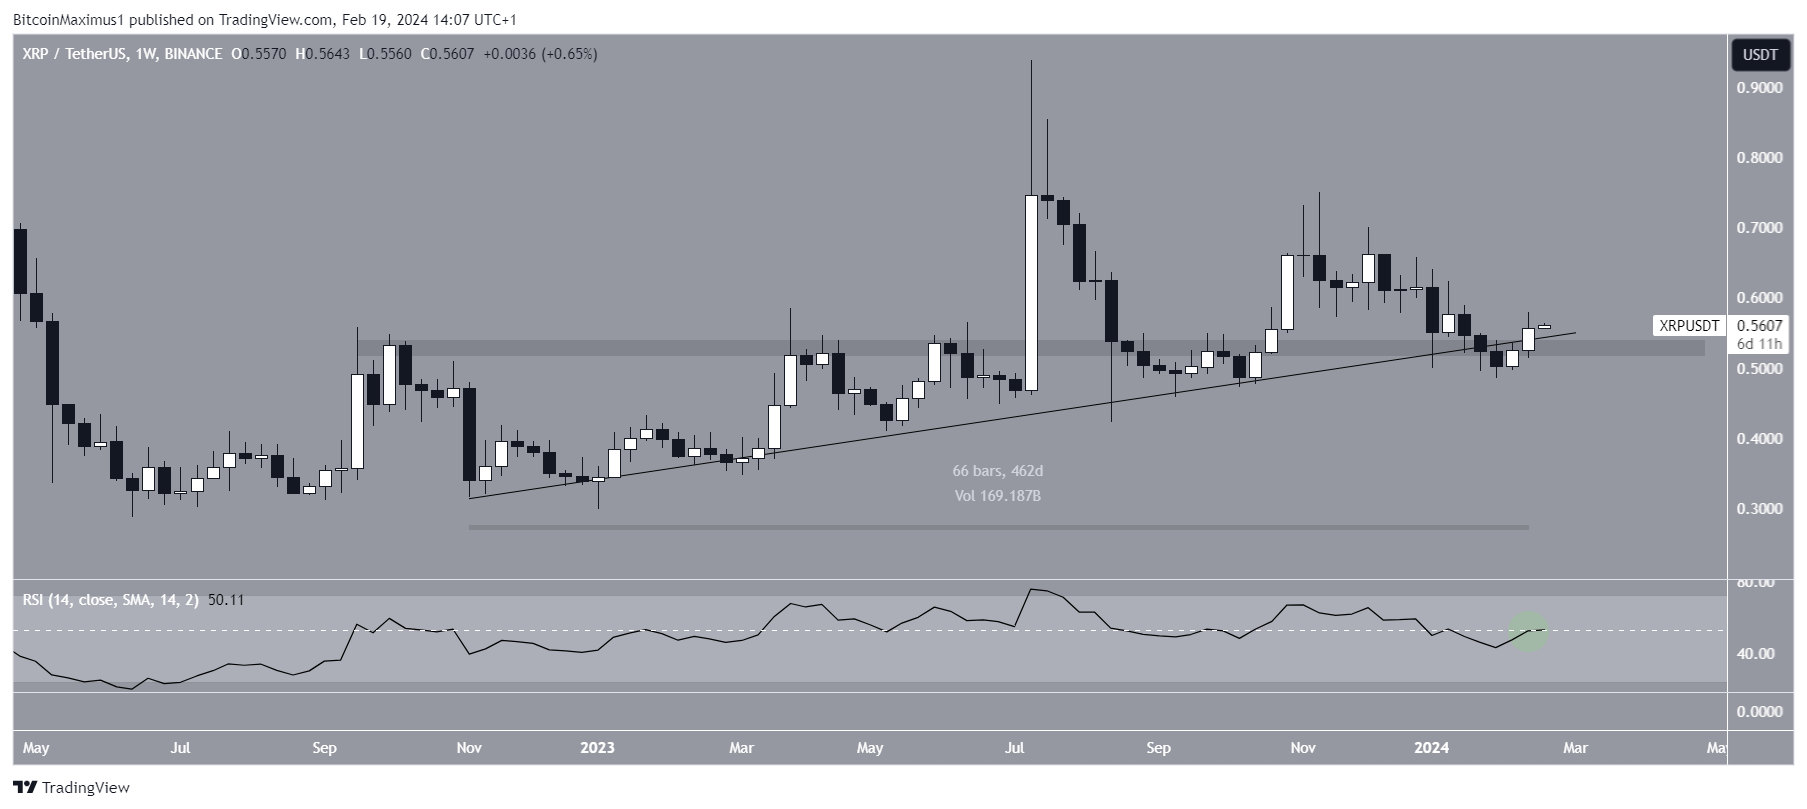
The weekly time frame technical analysis shows the XRP price has increased in the past two weeks, creating successive bullish weekly candlesticks.
Last week’s close was especially important since it was made above an ascending support trend line that has existed for 460 days. Before doing so, XRP broke down from the trend line and a horizontal support area. However, the ongoing increase reclaimed them both.

The weekly Relative Strength Index (RSI) is not yet bullish despite the upward movement. Traders utilize the RSI as a momentum indicator to assess whether a market is overbought or oversold and whether to accumulate or sell an asset.
If the RSI reading is above 50 and the trend is upward, bulls still have an advantage, but if the reading is below 50, the opposite is true. While the indicator is moving upward, it has yet to increase above 50 (green circle).
XRP Price Prediction: Breakout Incoming?
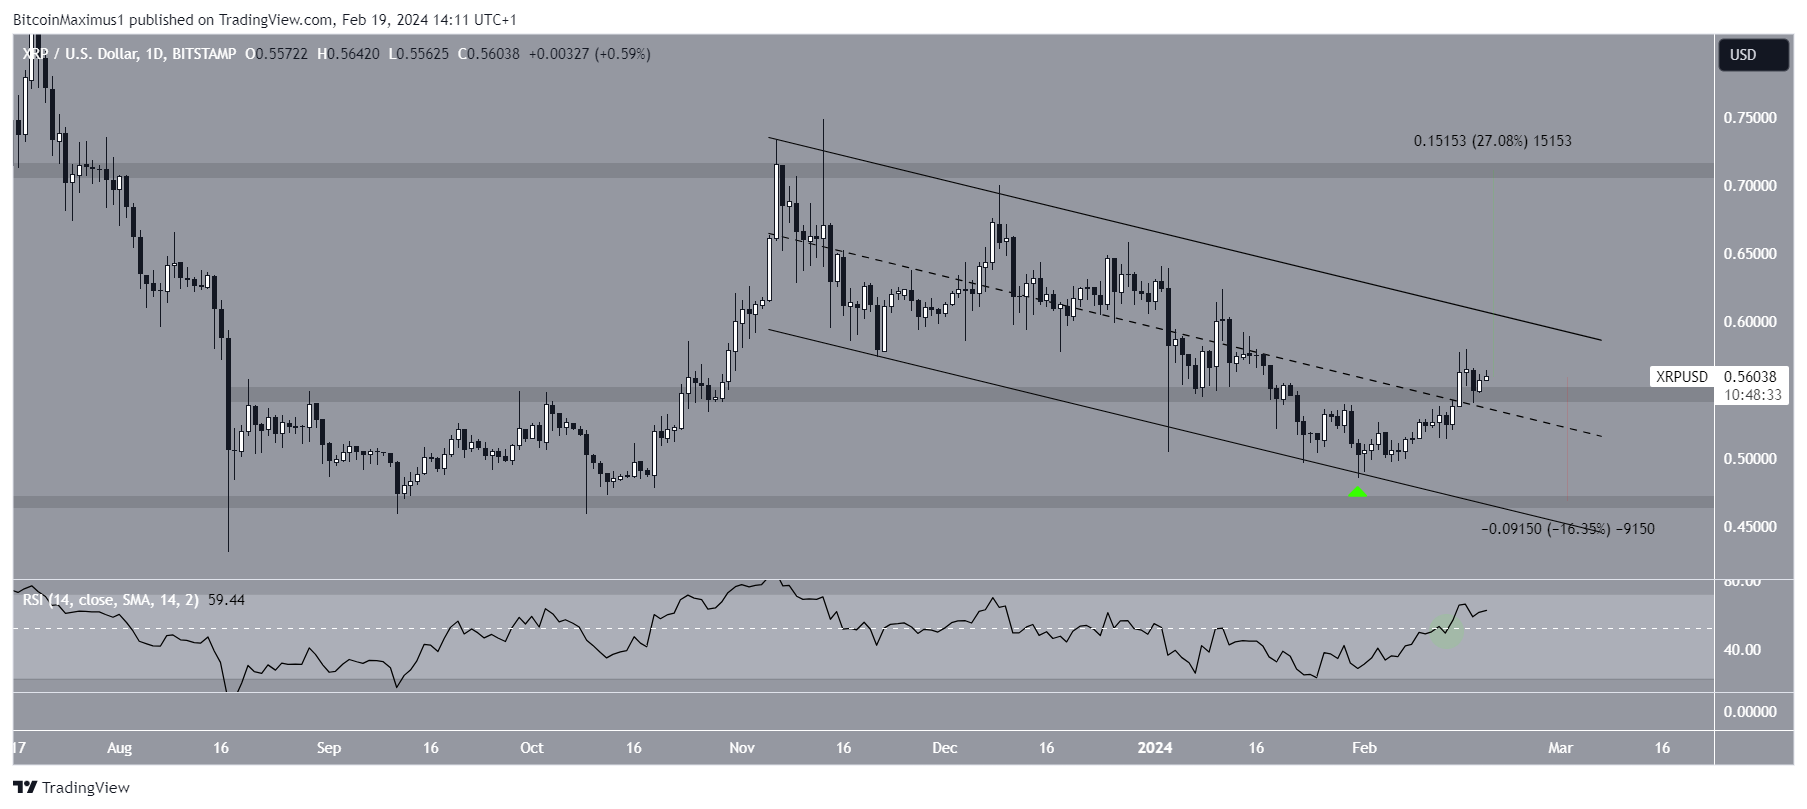
The daily time frame chart is bullish, suggesting a breakout will occur soon. This is because of the price action and RSI.
The price action shows that XRP has increased since bouncing at the support trend line of a descending parallel channel on January 31.
The upward movement took the price above the $0.55 horizontal area, which had acted as resistance. Then, the XRP price validated it as a support level.
During this movement, the daily RSI increased above 50 (green circle), legitimizing the price action. If XRP breaks out from the channel, it can increase by 27% and reach the next resistance at $0.70.

Despite the bullish XRP price prediction, closing below $0.55 can trigger a 16% downward movement to the closest support at $0.47.
For BeInCrypto‘s latest crypto market analysis, click here


