Bitcoin’s (BTC) price has been struggling since the approval of the spot Bitcoin exchange-traded fund (ETF). On January 23, it hit the $38,000 zone and swiftly bounced back. Has the price hit a local bottom at $38,000?
As of writing, Bitcoin is trading around the $42,000 zone after bouncing over 9% from last week’s lows.
3 Factors Suggest Bitcoin Local Bottom
On-chain analytical firm CrytoQuant shared its weekly report with BeInCrypto. It discusses various factors that point out that the price of Bitcoin has potentially bottomed out.
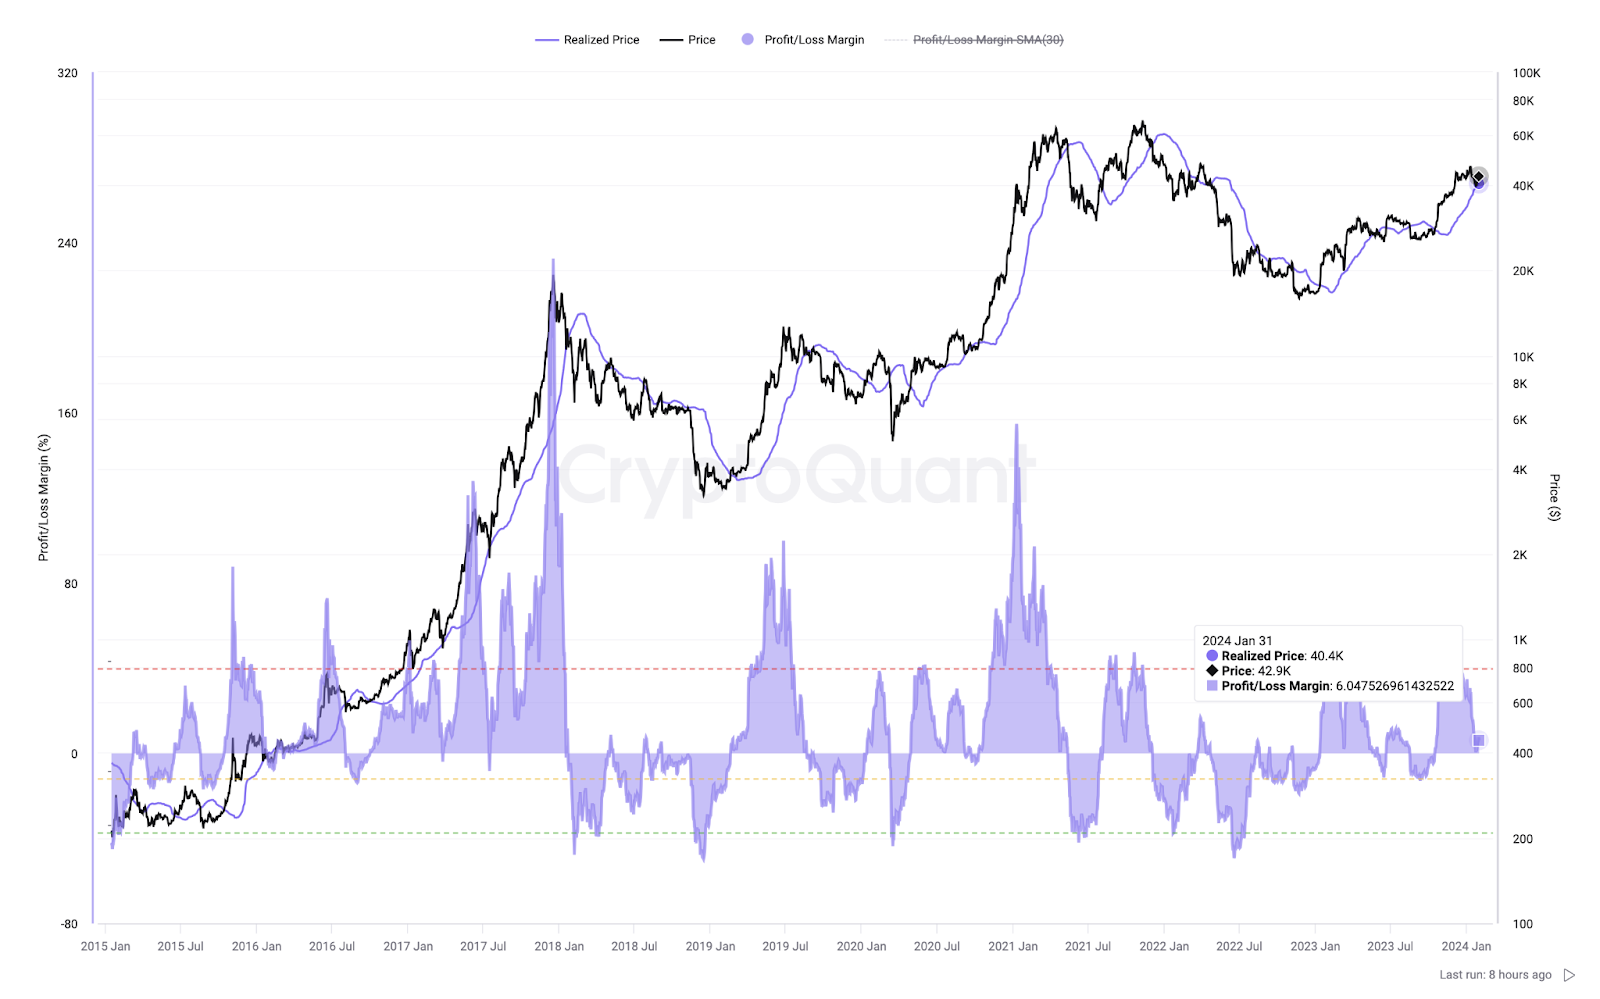
1. Bitcoin Tests Support of Short-Term Holder Realized Price Level
Last week, the price declined to the short-term holders’ realized price levels. The realized price represented by a blue line is the average cost at which the short-term holders purchased their Bitcoins.
“During bear markets, the realized price acts as a celling, and as a floor in the bull markets,” CryptoQuant explained.
As of January 31, the realized price stands around $40,400, which means that this level could be a decent short-term support for the Bitcoin price. However, previously, CryptoQuant explained that price typically bottoms when short-term holders’ unrealized loss margin is around 10%.
Read more: Bitcoin Price Prediction 2024/2025/2030

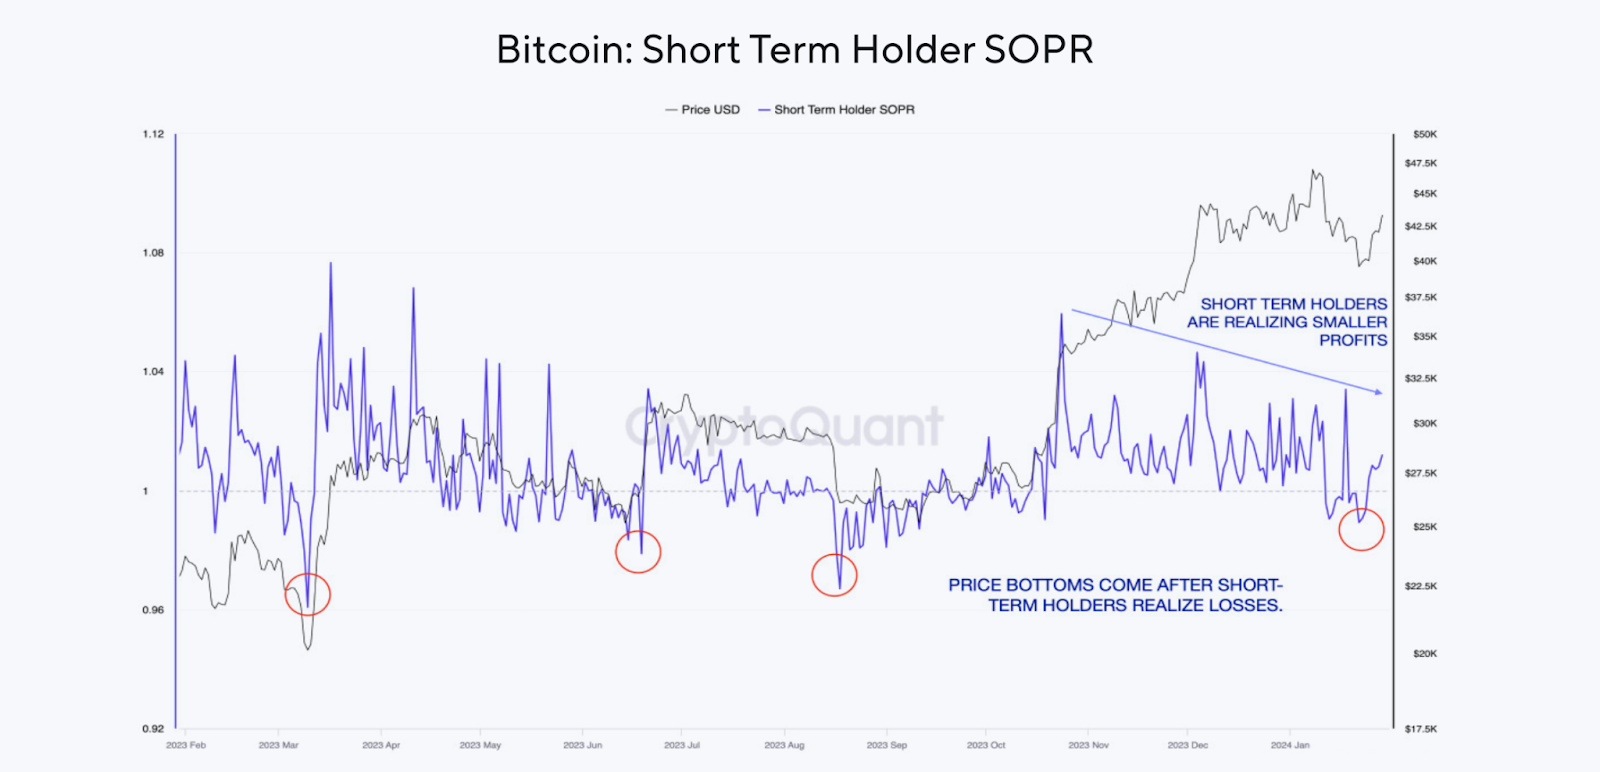
2. Short-Term Holders Sold at a Loss
The screenshot below shows the Bitcoin Short-Term Holder Spent Output Profit Ratio (SOPR), indicating whether short-term holders spend their coins at profit or loss. When Bitcoin briefly touched $38,000 last week, many short-term holders sold their assets at a loss.
The SOPR ratio dipped to 0.98 last week, indicating that wallets holding Bitcoin for less than 155 days sold their coins roughly at a 2% loss.
“Price bottoms are typically formed after short-term holders sell at a loss,” CryptoQuant wrote.

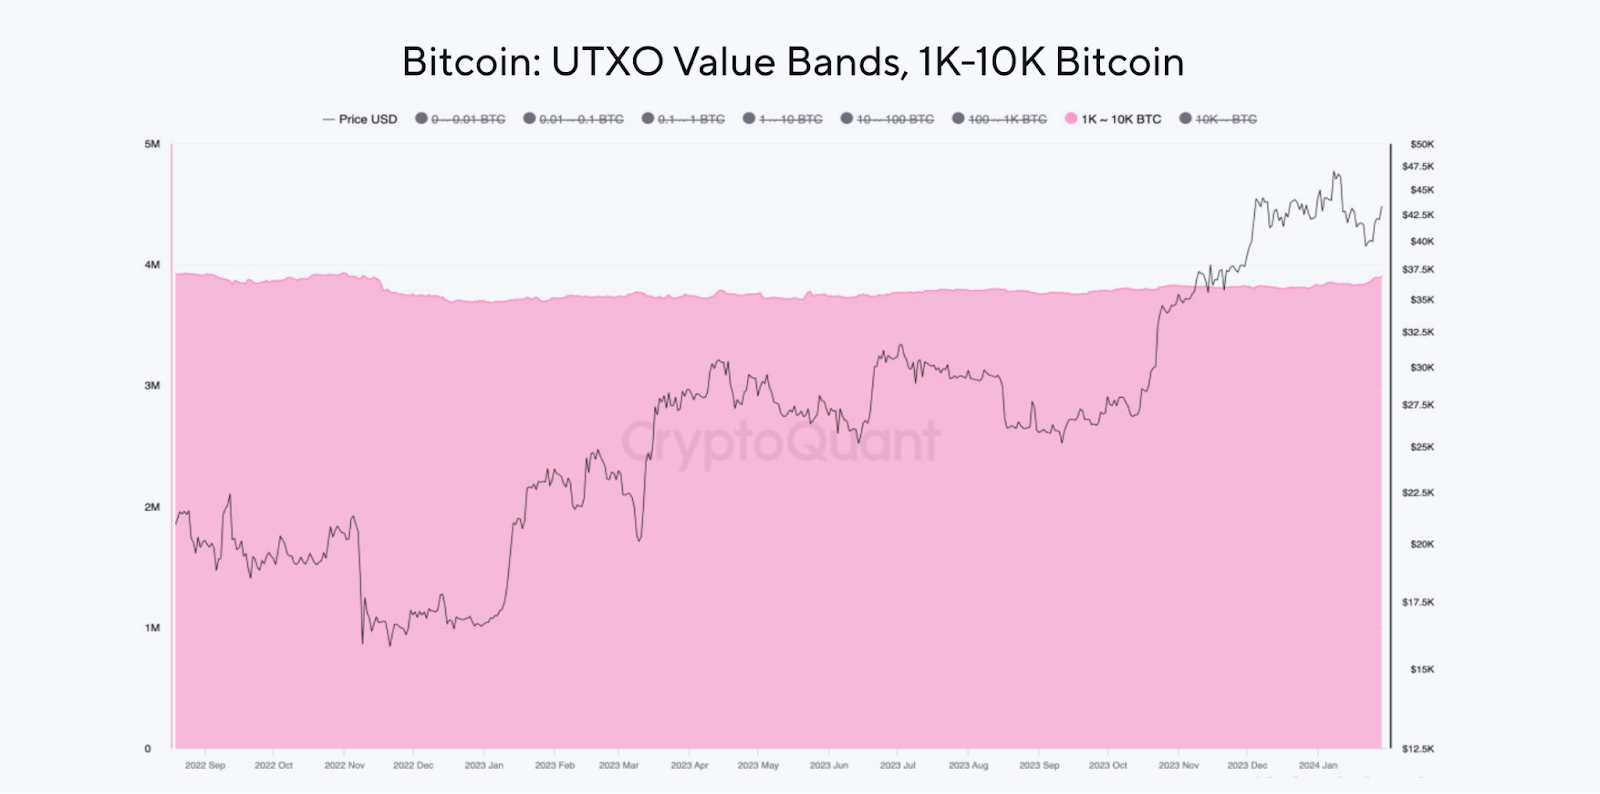
3. Bitcoin Whales Continue Accumulation
The Bitcoin holdings of whales have been rising to the levels last seen in December 2022. The screenshot below shows the holdings of wallets that own 1,000 to 10,000 BTC.
Read more: Who Owns the Most Bitcoin in 2024?

Moreover, the BTC holding of various ETFs has been constantly increasing. At the same time, the selling pressure from Grayscale Bitcoin ETF (GBTC) has been cooling down.
These factors suggest increased demand and declining supply, which can positively impact the Bitcoin price.


