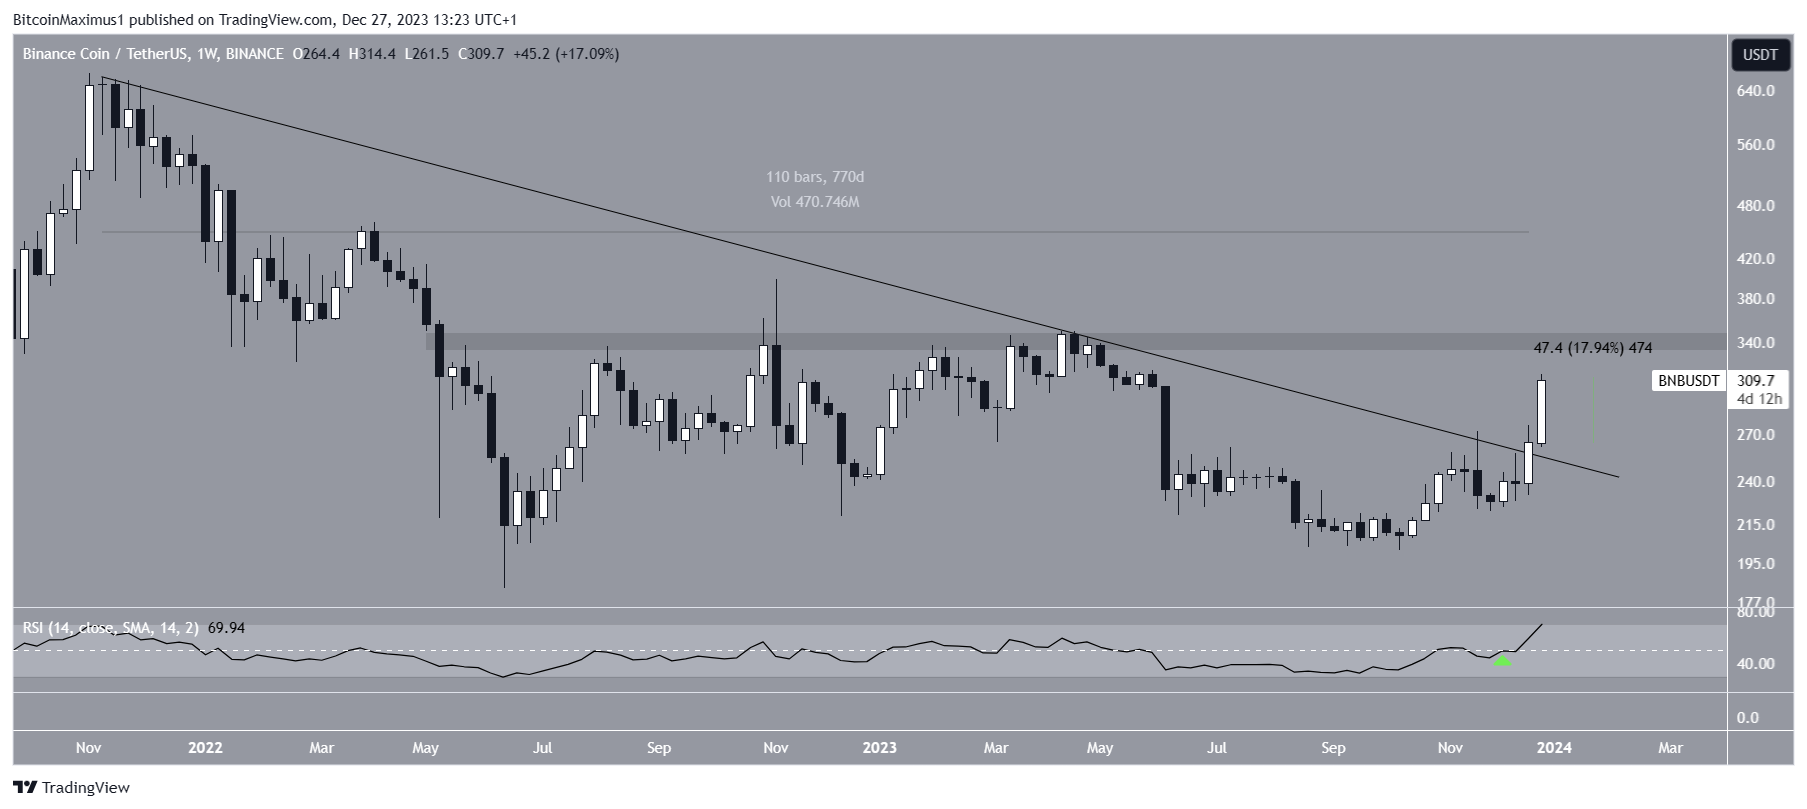
The BNB price has increased by nearly 20% this week, approaching its yearly high. This is the largest weekly increase since 2021.
The upward movement took the price above $300 for the first time since May. Will BNB reach a new yearly high above $350 this week?
BNB Breaks Out from Long-Term Resistance
The BNB price has fallen under a long-term descending resistance trend line since its all-time high in November 2021. The decrease led to a low of $184 in June 2022. Afterward, the price increased but made an unsuccessful breakout attempt (red icon) in April 2023 (red icon).
After creating a higher low in October, the BNB price broke out from the trend line last week and has increased significantly this one, even though it has not reached a new yearly high yet. At the time of the breakout, the trend line had been in place for 770 days.
Cryptocurrency trader CryptoFaibik believes this breakout begins a new long-term upward trend.

The RSI is a momentum indicator traders use to evaluate whether a market is overbought or oversold and whether to accumulate or sell an asset.
Readings above 50 and an upward trend suggest that bulls still have an advantage, while readings below 50 indicate the opposite. The weekly RSI is increasing and is above 50 (green icon), both signs of a bullish trend.
BNB Price Prediction: Is $400 on The Cards?
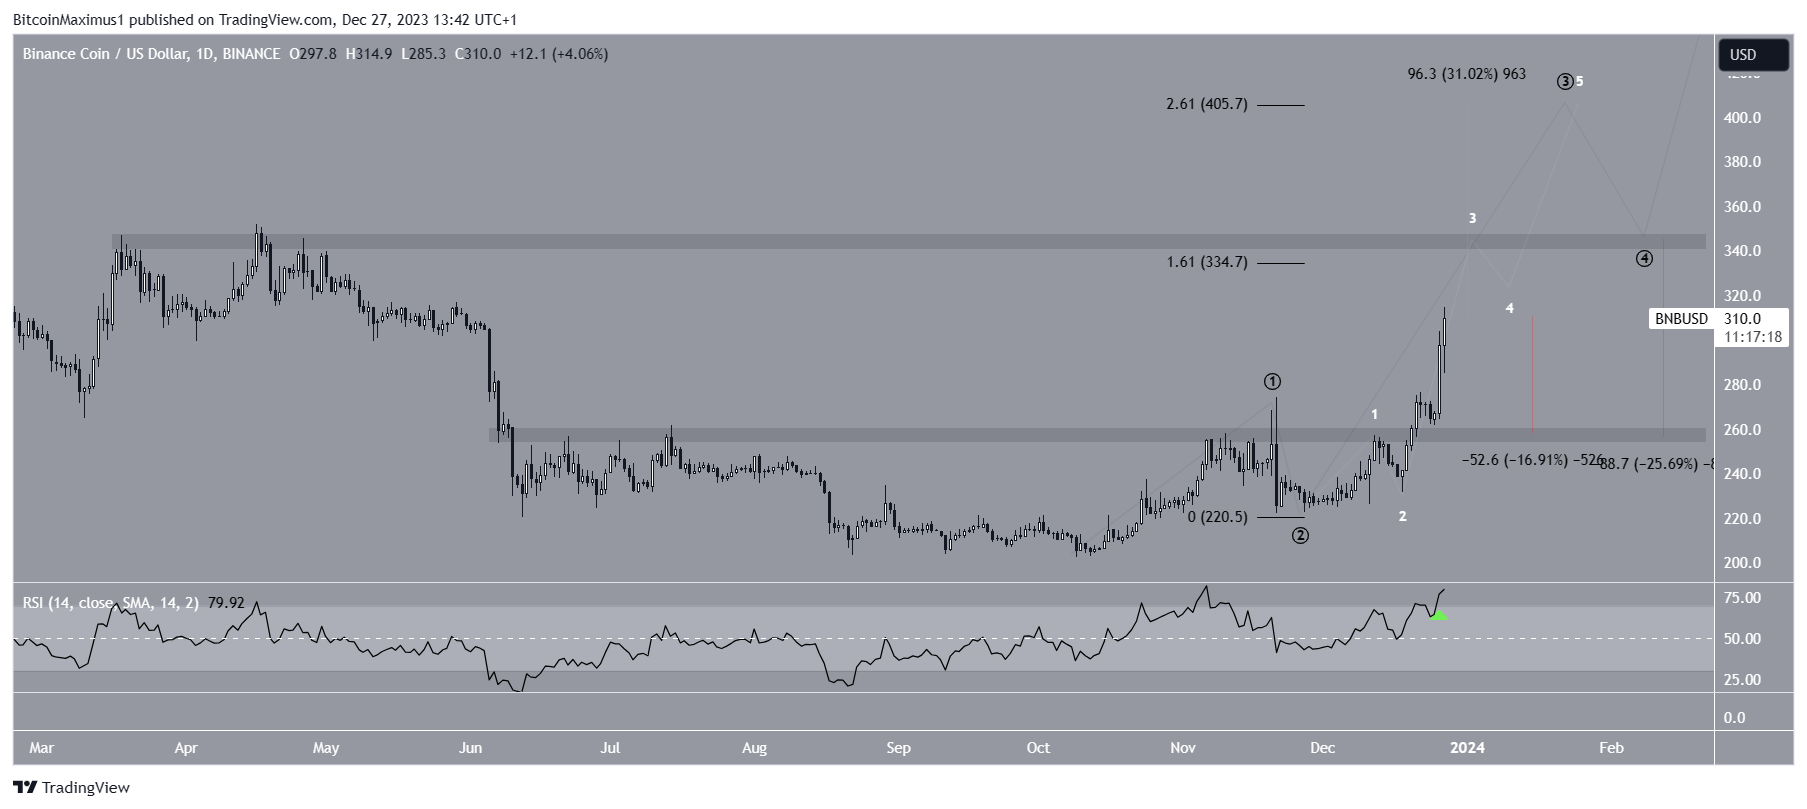
The technical analysis of the daily time frame supports the continuing increase. This is because of the wave count, price action, and RSI readings.
Technical analysts utilize the Elliott Wave theory to ascertain the trend’s direction by studying recurring long-term price patterns and investor psychology.
The most likely wave count suggests that the BNB price is in wave three of a five-wave upward movement (black). The sub-wave count is given in white, showing an extended wave three.
The daily RSI is above 50 and increasing, and it recently moved above 70 (green icon), a sign of strengthening momentum.
Additionally, the price action shows a movement above an important horizontal area.
If the BNB price continues increasing and breaks out above $345, it can increase by 30% to the next resistance at $405, which would be a new yearly high. This would give wave three 2.61 times the length of wave one.

Despite this bullish BNB price prediction, failure to break out above $345 will put the bullish count at risk and can lead to a return to the $260 support area. This would be a 17% drop from the current price and a 25% drop from the $344 area.
For BeInCrypto’s latest crypto market analysis, click here.
youtube.com/watch?v=Q_CUjMjtvnI


