
Cardano (ADA) is currently experiencing a corrective phase. ADA is currently struggling to surpass the 0.382 Fibonacci (Fib) resistance level and is facing a bearish rejection.
The future trajectory of ADA’s price, whether it will continue to fall or rebound soon, depends on several key factors. These include market sentiment, cryptocurrency market trends, and developments within the Cardano ecosystem. Investors are closely monitoring these factors for indications of ADA’s potential direction.
Cardano Price Surges 184% Since October: A Remarkable Rise
Since October, ADA has seen a significant rise of over 184%. However, it currently appears to be undergoing a corrective phase.
This corrective movement is highlighted by Cardano’s difficulty in breaking through the resistance at the 0.382 Fibonacci (Fib) level. This is around $0.612. Despite this, the monthly chart shows bullish signs: the Moving Average Convergence Divergence (MACD) histogram consistently ticks upwards, and the MACD lines have crossed bullishly.
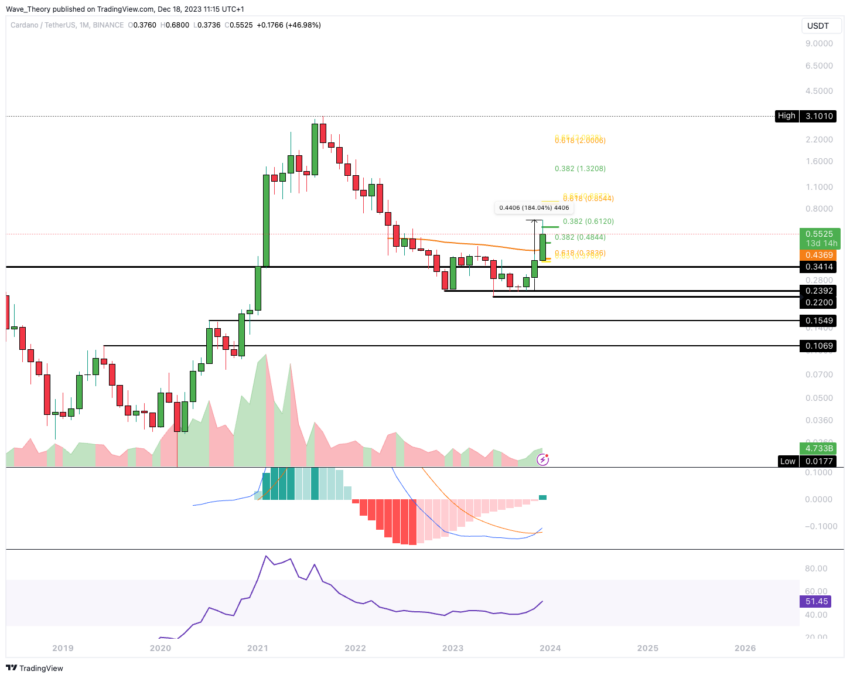
Simultaneously, the Relative Strength Index (RSI) remains neutral, not providing clear indications of either bullish or bearish momentum. Combining a bullish MACD and a neutral RSI suggests a complex market scenario where short-term corrections are juxtaposed with underlying bullish signals.
Cardano Enters Correction Phase Since Last Week
Last week, ADA faced a bearish rejection at the 0.382 Fibonacci (Fib) resistance level, around $0.612. This could lead to a correction, with ADA’s price potentially dropping to the 0.382 Fib support level at around $0.5.
The Moving Average Convergence Divergence (MACD) histogram in the weekly chart has begun trending downward. However, the MACD lines are still in a bullish crossover.
Meanwhile, the Relative Strength Index (RSI) indicates an overbought condition. While the Exponential Moving Averages (EMAs) exhibit a death cross, suggesting that the medium-term trend is bearish.
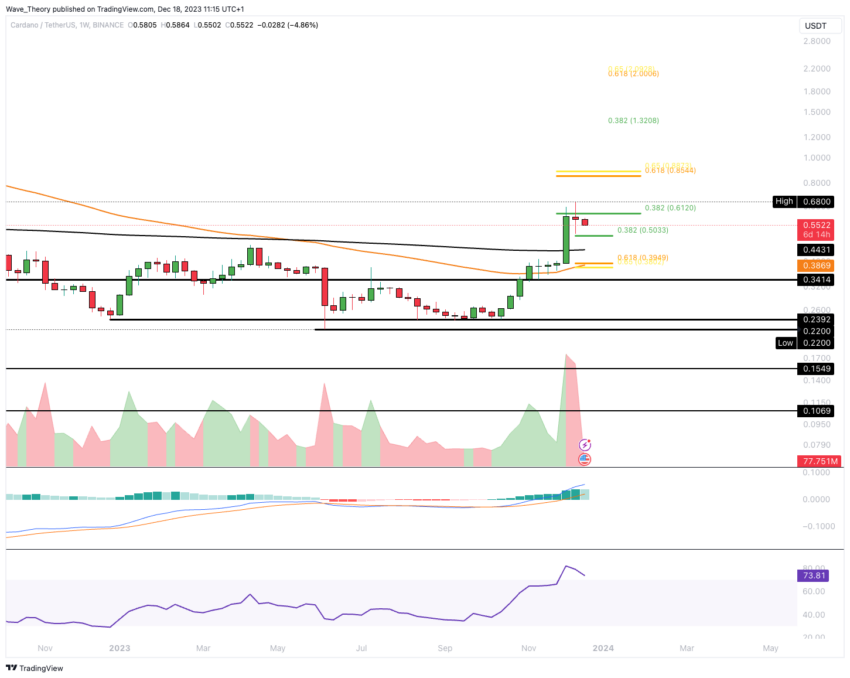
Should the $0.5 support level fail to hold, the next significant Fib support level is at the Golden Ratio, around $0.39. At this level, the 50-week EMA may provide additional support. This scenario outlines a potential path for ADA’s price movement in the near term, considering the current technical indicators.
What’s the Next Low for Cardano’s Price?
If ADA undergoes a correction to the 0.382 Fibonacci (Fib) support level at around $0.5, it would represent a potential downside of approximately 10%. Alternatively, a correction to the golden ratio support at around $0.39 would imply a more significant downside potential of over 31%.
On the technical front, the Moving Average Convergence Divergence (MACD) lines are nearing a bearish crossover. Also, the MACD histogram has been trending downwards in a bearish manner for several days.
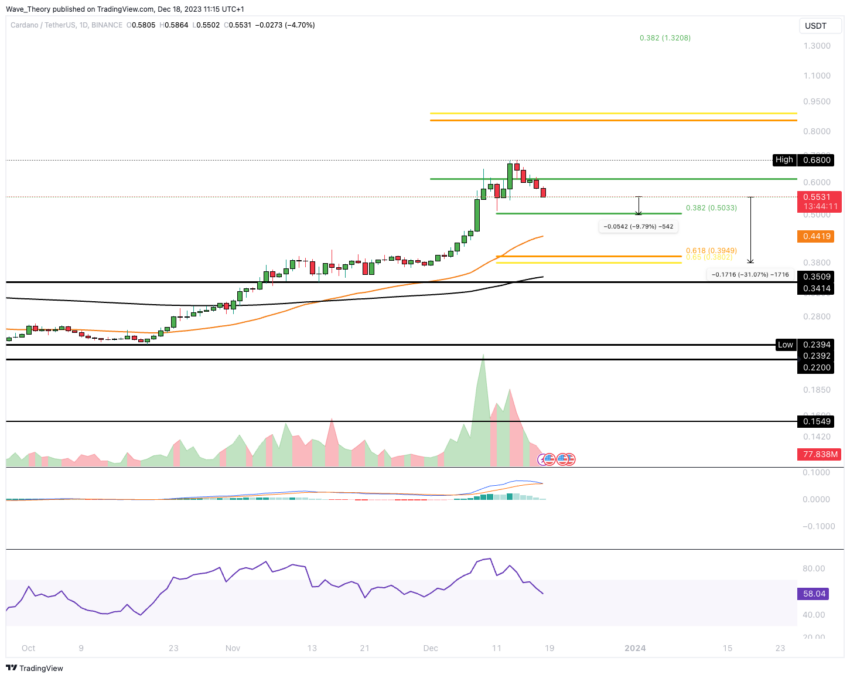
In contrast to this, the Relative Strength Index (RSI) is currently neutral, offering no definitive bullish or bearish indications. Meanwhile, the Exponential Moving Averages (EMAs) still display a golden crossover. This suggests that, in the short to medium term, the trend has not yet shifted to a bearish stance.
These mixed signals from the MACD, RSI, and EMAs indicate a complex market scenario for Cardano, balancing potential bearish corrections with an underlying bullish trend.
4H Chart Analysis Suggests Continued Downward Trend
In the 4-hour (4H) chart for ADA, a bearish divergence was observed in the Relative Strength Index (RSI). This then preceded the start of a downward price movement. Additionally, the Moving Average Convergence Divergence (MACD) lines are in a bearish crossover. Meanwhile, the MACD histogram is trending downwards, indicating bearish momentum.
Currently, the RSI is approaching oversold territory, suggesting that the downward movement may be nearing a point where a reversal could occur. Given these conditions, there is a possibility that Cardano could find support and potentially rebound at the 0.382 Fibonacci (Fib) support level, which is around $0.5, in the short term.
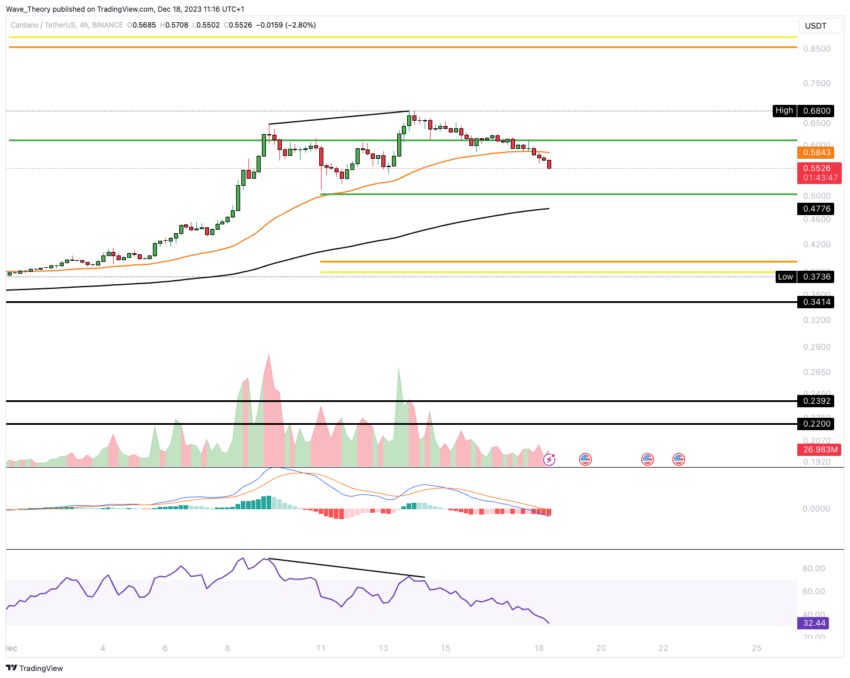
This scenario depends on whether the oversold conditions in the RSI lead to increased buying pressure, enabling ADA to stabilize and recover from its recent downward trend.
Cardano Faces Bearish Rejection at 0.382 Fib Resistance vs BTC
Last week, in its trading against Bitcoin (BTC), ADA faced a bearish rejection at the 0.382 Fibonacci (Fib) level, approximately at 0.000015 BTC. Following this rejection, Cardano is now encountering significant support at the 0.382 Fib level, coinciding with the 50-week Exponential Moving Average (EMA), around 0.0000127 BTC.
If this support level fails to hold, the next notable Fib support for ADA is anticipated to be around 0.000011 BTC. Despite the recent bearish rejection, the Moving Average Convergence Divergence (MACD) histogram in the weekly chart shows an upward trend, and the MACD lines are in a bullish crossover.
Meanwhile, the Relative Strength Index (RSI) is positioned in a neutral zone, indicating a balance in market forces without strong bullish or bearish momentum.
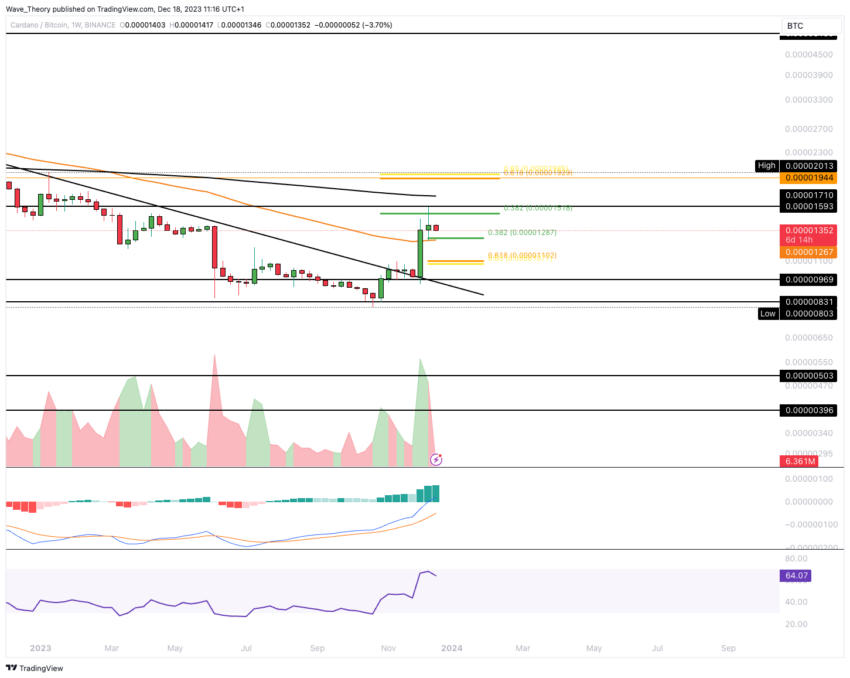
This combination of technical indicators – a bearish rejection at a key Fib level, significant support at the 50-week EMA, a bullish MACD, and a neutral RSI – suggests a complex and dynamic market scenario for Cardano in its BTC pairing.