The current positioning of Cardano (ADA) in the market suggests it is at a pivotal juncture. Having concluded its corrective phase and now facing a crucial trend line resistance. The central question is whether ADA is on the verge of a bullish breakout.
Cardano previously attempted to surpass this trend line resistance last month but was unsuccessful. It’s important to monitor its current market behavior to determine if it can achieve a bullish breakout this time.
The ability of ADA to break through this resistance level would signal a significant shift in its market trajectory and potentially indicate a new bullish trend.
Cardano Confronts Critical Trend Line Resistance
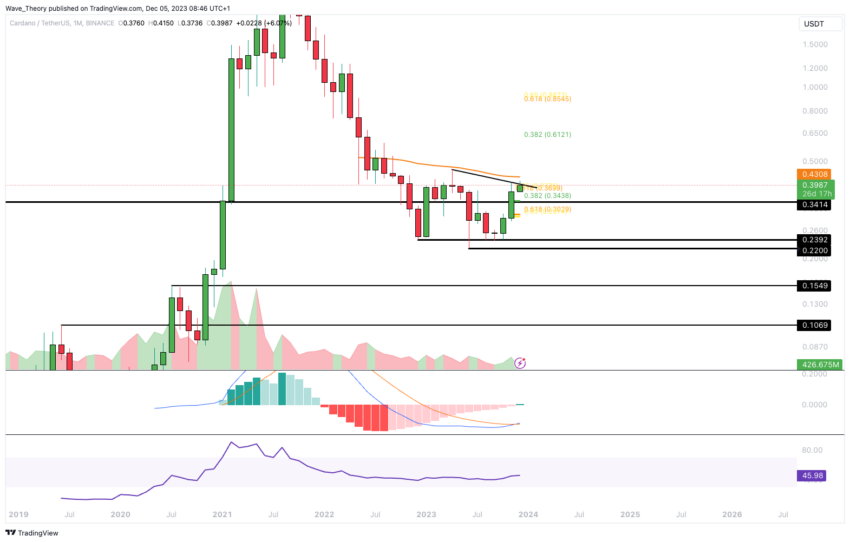
The current trend in Cardano’s price suggests a continuation of its upward trajectory this month. Presently, Cardano is encountering resistance at a significant trend line, which previously led to a bearish rejection last month. This trend line is formed by connecting the peak at the end of 2022 with the monthly high of November this year.
Adding to this resistance, just above the current level at around $0.43, there lies another substantial barrier. At the 50-month Exponential Moving Average (EMA). Overcoming this resistance zone, particularly between the $0.4 and $0.43 levels, could open the path for Cardano. It aims for the .382 Fibonacci resistance level, approximately at $0.61
Cardano must breach the golden ratio resistance level for a complete bullish trend reversal, around $0.86. The Moving Average Convergence Divergence (MACD) histogram, showing a bullish trend for several months, further supports this outlook, as the MACD lines have now also crossed in a bullish direction.

However, the Relative Strength Index (RSI) on the monthly chart remains neutral, providing neither strong bullish nor bearish indications. This neutrality in the RSI could imply a period of consolidation or indecision in the market before any significant upward or downward movement.
Therefore, while there are bullish signs, the overall market sentiment and technical indicators suggest a cautious approach as Cardano approaches these critical resistance levels.
Cardano Price Quickly Halts Correction: A Swift Recovery
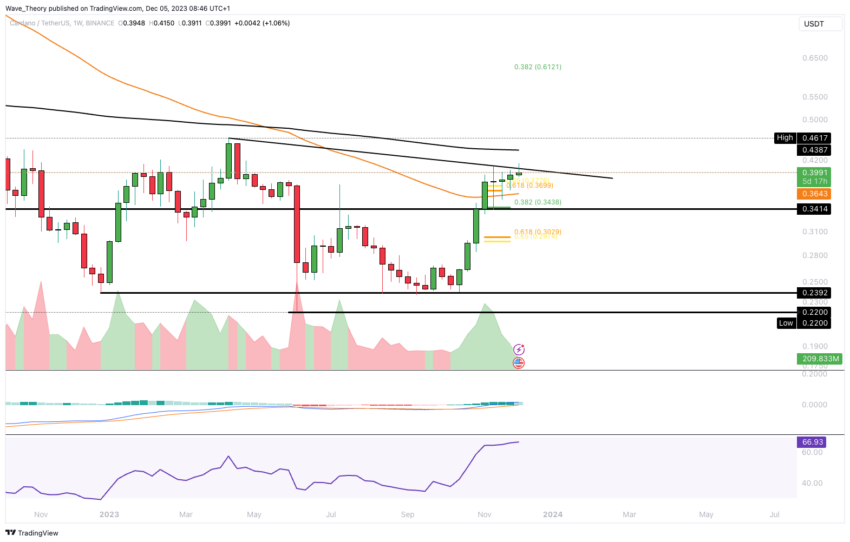
Following a bearish rejection at the trendline resistance three weeks ago, the price of Cardano initially underwent a correction, descending to the 0.382 Fibonacci (Fib) support level, approximately at $0.344.
Subsequently, Cardano rallied from this point and successfully breached the golden ratio resistance around $0.37, concluding its corrective phase.
Despite this recent upward movement, the Moving Average Convergence Divergence (MACD) histogram shows a bearish decline this week. This shift comes after several weeks of bullish progression. However, the MACD lines remain in a bullish crossover, which could indicate potential positive momentum.
Meanwhile, the Relative Strength Index (RSI) is positioned in a neutral zone, suggesting a lack of strong bullish or bearish momentum at this stage.
On the weekly chart, the Exponential Moving Averages (EMAs) exhibit a ‘death cross.’ This pattern occurs when a short-term EMA crosses below a long-term EMA. This is often interpreted as a bearish signal in the medium term. Therefore, the presence of a death cross suggests that despite recent positive movements, the overall medium-term trend for Cardano might still lean towards bearish.

These mixed indicators — the recent price rebound, the bullish MACD lines, the neutral RSI, and the bearish death cross in the EMAs — paint a complex picture of Cardano’s market behavior. This indicates a period of uncertainty and potential volatility.
Therefore, Investors and traders might approach the market cautiously, closely monitoring these technical signals for clearer trends in the medium term.
Cardano’s Daily Chart: Golden Crossover Meets Bearish RSI Divergence
Indicators present mixed signals in Cardano’s daily chart. The EMAs show a bullish golden crossover, suggesting a positive short to medium-term trend. However, this is contrasted by the bearishly crossed MACD lines.

The MACD histogram indicates bullish momentum, but the RSI shows a bearish divergence. These conflicting indicators suggest the potential for a corrective move to the 0.382 Fibonacci support level at around $0.344.
Cardano’s 4H Chart Shows Trend of Higher Highs and Lows
In the 4-hour chart, ADA is exhibiting a clear upward trend. However, there are some bearish indicators present as well. The Moving Average Convergence Divergence (MACD) histogram is trending downwards, a bearish signal.
Additionally, the MACD lines show signs of potentially crossing in a bearish manner. This could indicate a shift in momentum.
On the other hand, the Relative Strength Index (RSI) is positioned in a neutral zone, not providing clear indications of either bullish or bearish momentum at this time.

This neutral stance of the RSI amidst the upward trend and bearish MACD signals creates a mixed outlook. This suggests a potential for volatility or a shift in the current trend.
Cardano May Correct to 0.0000091 BTC, Golden Ratio Support vs Bitcoin
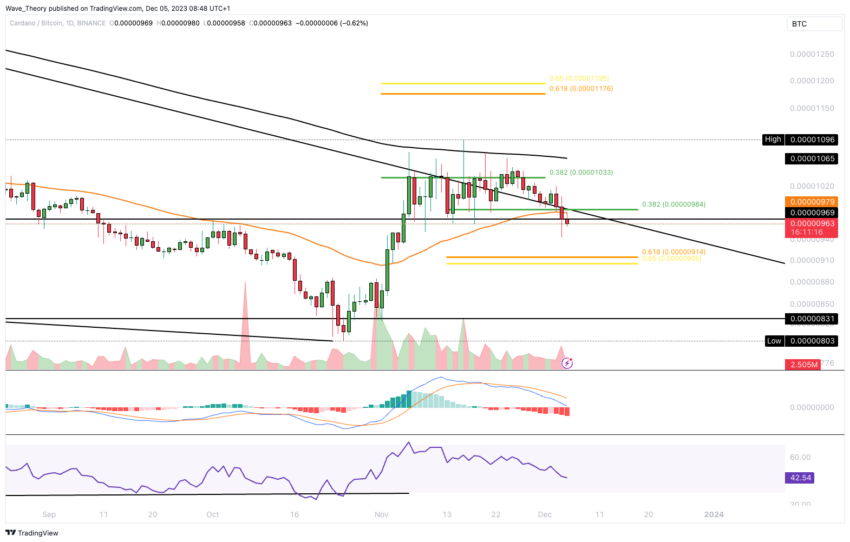
In its trading against Bitcoin (BTC), Cardano has not secured a close above the 0.382 Fibonacci (Fib) resistance level. This is located at approximately 0.00001034 BTC. Furthermore, Cardano has recently broken through the 0.382 Fib support level at around 0.00000984 BTC in a bearish manner.
This bearish break indicates that Cardano might now be poised for a correction toward the golden ratio support, which is situated at around 0.0000091 BTC. This potential correction is further substantiated by the current state of the Moving Average Convergence Divergence (MACD) indicators.
The MACD histogram has been ticking lower in a bearish trend for three consecutive days, and the MACD lines are crossed in a bearish configuration.

These technical indicators – the breach of the Fib support level and the bearish MACD signals – collectively suggest a likelihood of a continued downward movement for Cardano against Bitcoin in the short term.
Investors and traders in ADA/BTC should closely monitor these developments for indications of a trend reversal or continuation of the bearish momentum.


