Key indicators (January 6, 4pm -> January 13, 4pm Hong Kong time)
-
BTC/USD fell 5.8% (99.3k USD -> 93.5k USD), ETH/USD fell 12% (3.65k USD -> 3.215k USD)
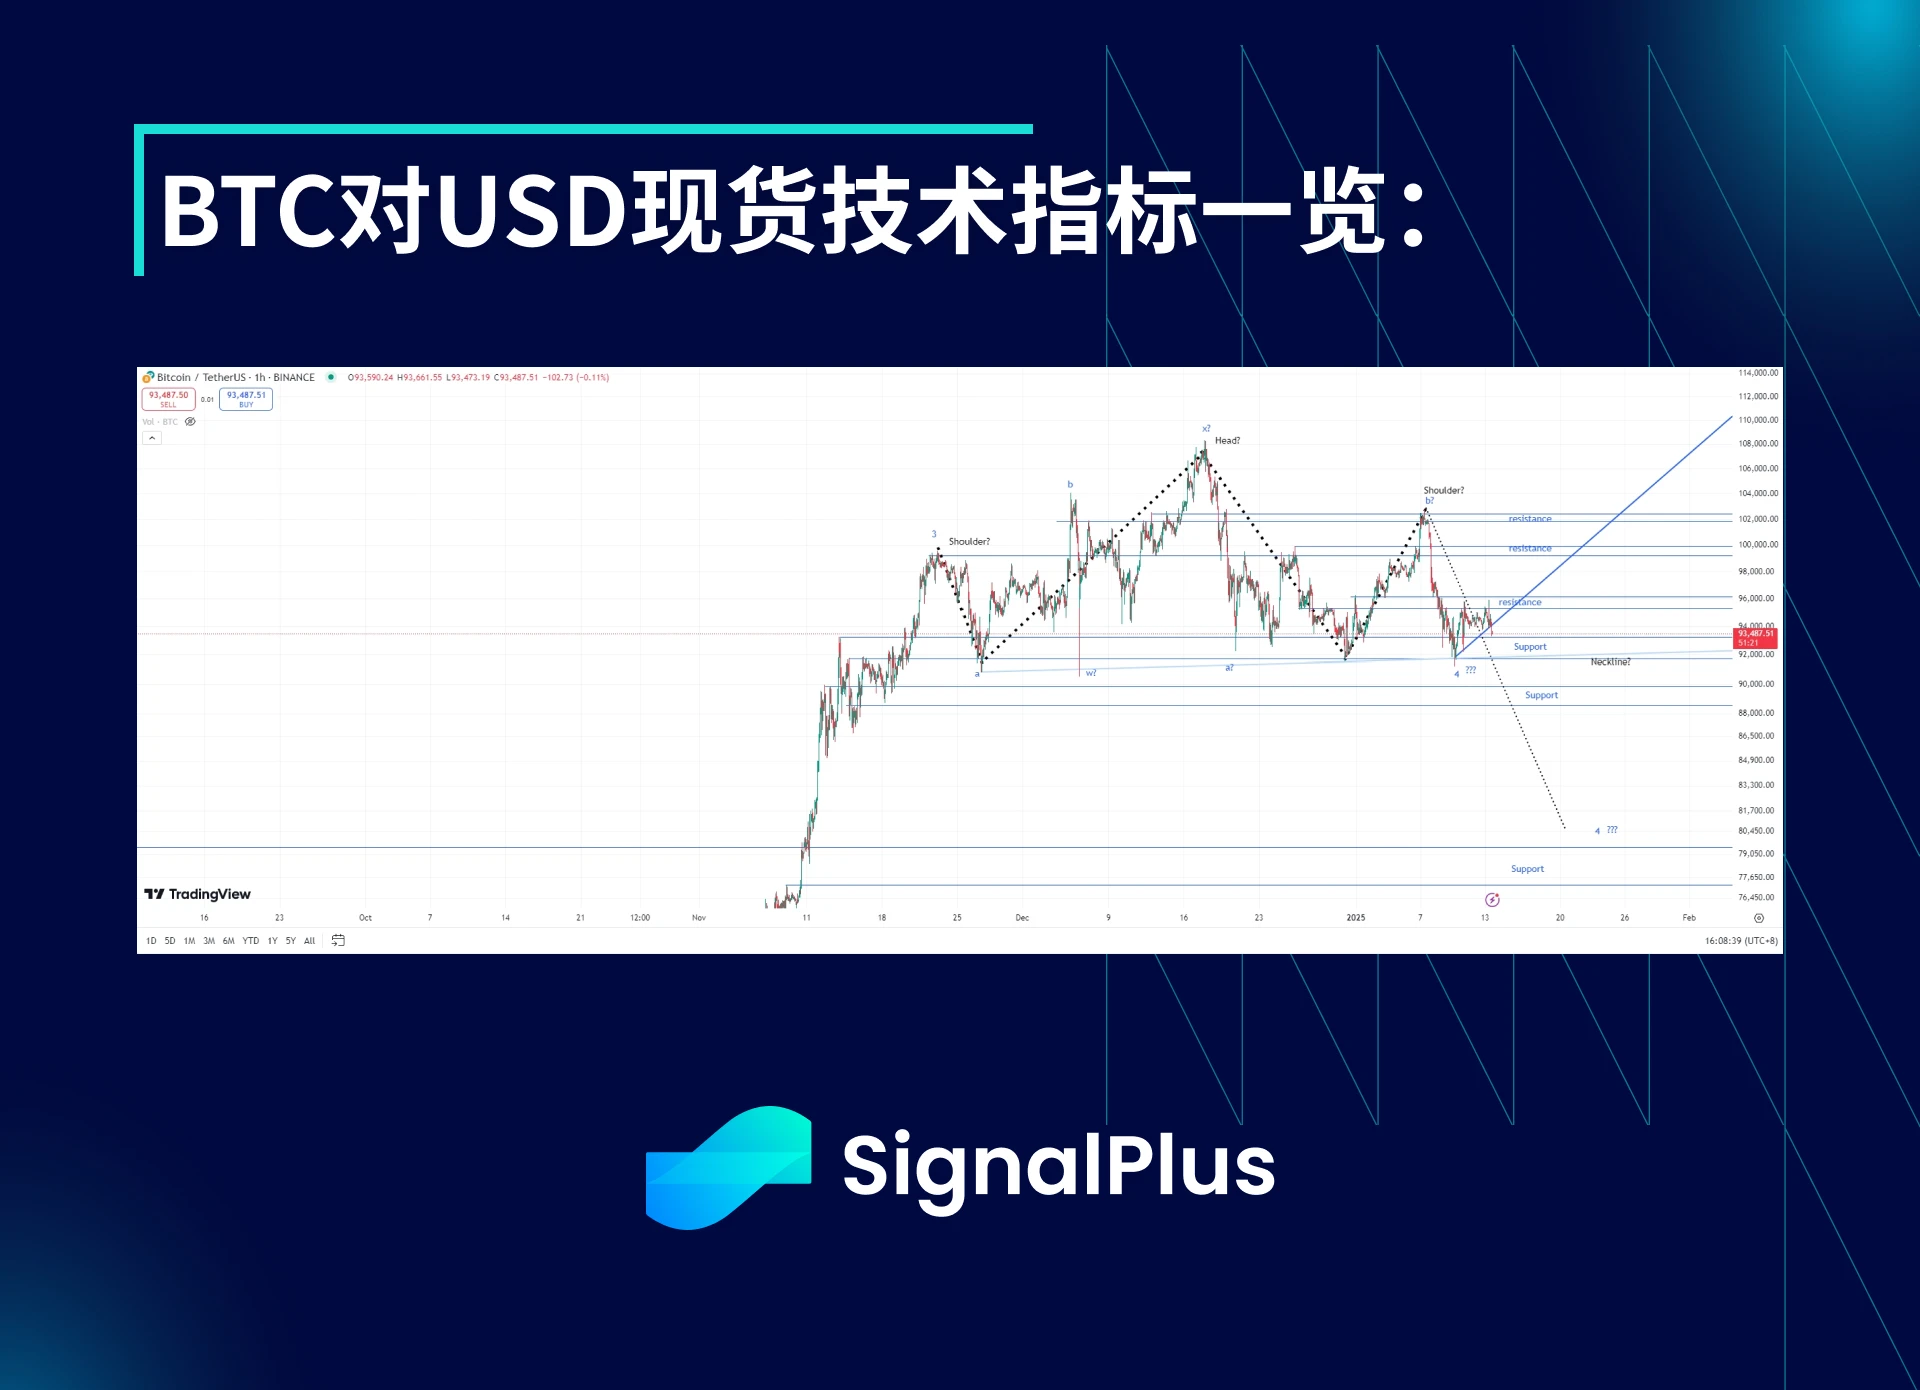
BTC to USD spot technical indicators at a glance:
-
Last week, the price of the coin retreated as expected after a period of growth. However, this decline had sufficient momentum and exceeded our initial expectation of 94-96k USD, even down to the 91k USD level. In general, apart from a few occasional tentative breakthroughs, the price of the coin was basically able to hold the 92k level and form a new support level. The price of the coin then rebounded back to the 92-98k range. As the market began to test the highs at the beginning of the new year, we saw the price of the coin form a head and shoulders pattern. This further illustrates the potential vulnerability of the price of the coin after breaking the support level, and it may fall all the way to 88k USD.
-
As mentioned before, the price has multiple support levels below the current point, so we think any current downside trend will be more of a slow decline or a bumpy decline, rather than a gap. But if the price is below $88,000, we expect a substantial price correction before the next upswing. Although the latter is not our base case. At present, we believe that the next big market will be mainly up rather than down, but we will re-evaluate the price trend in the next few days – we expect the current trend to have good upward momentum overall, but it is obviously not the case in recent trading days.
Market Theme:
-
Strong US data this week rattled the US bond market, shattering the illusion that the Feds hawkish stance in December was overblown, and increasing the risk that there will be fewer than two rate cuts this year (the market is currently pricing in one full rate cut). As the US labor market remains in dire straits, while average hourly wages and prices continue to put upward pressure on inflation. The SP 500 hesitated in the face of high interest rates (the US 30-year Treasury bond briefly hit 5%), resulting in a 2% drop at the close on Friday.
-
The picture for global stock markets was not rosy either. The CSI 300 fell 5% in its first full week of trading, while economic pressures in the UK continued to grow amid growing doubts about the government (as revealed by Elon Musk), while weak data exacerbated weakness in UK bonds and stocks.
-
Crypto markets showed high beta to headwind macro risks this week, retreating from a boom start that briefly rose to $102k. But overall, downside is cushioned by high US interest rates and a stock market correction, and cryptocurrencies are not expected to see a clear bear market in the medium term.
Implied Volatility
-
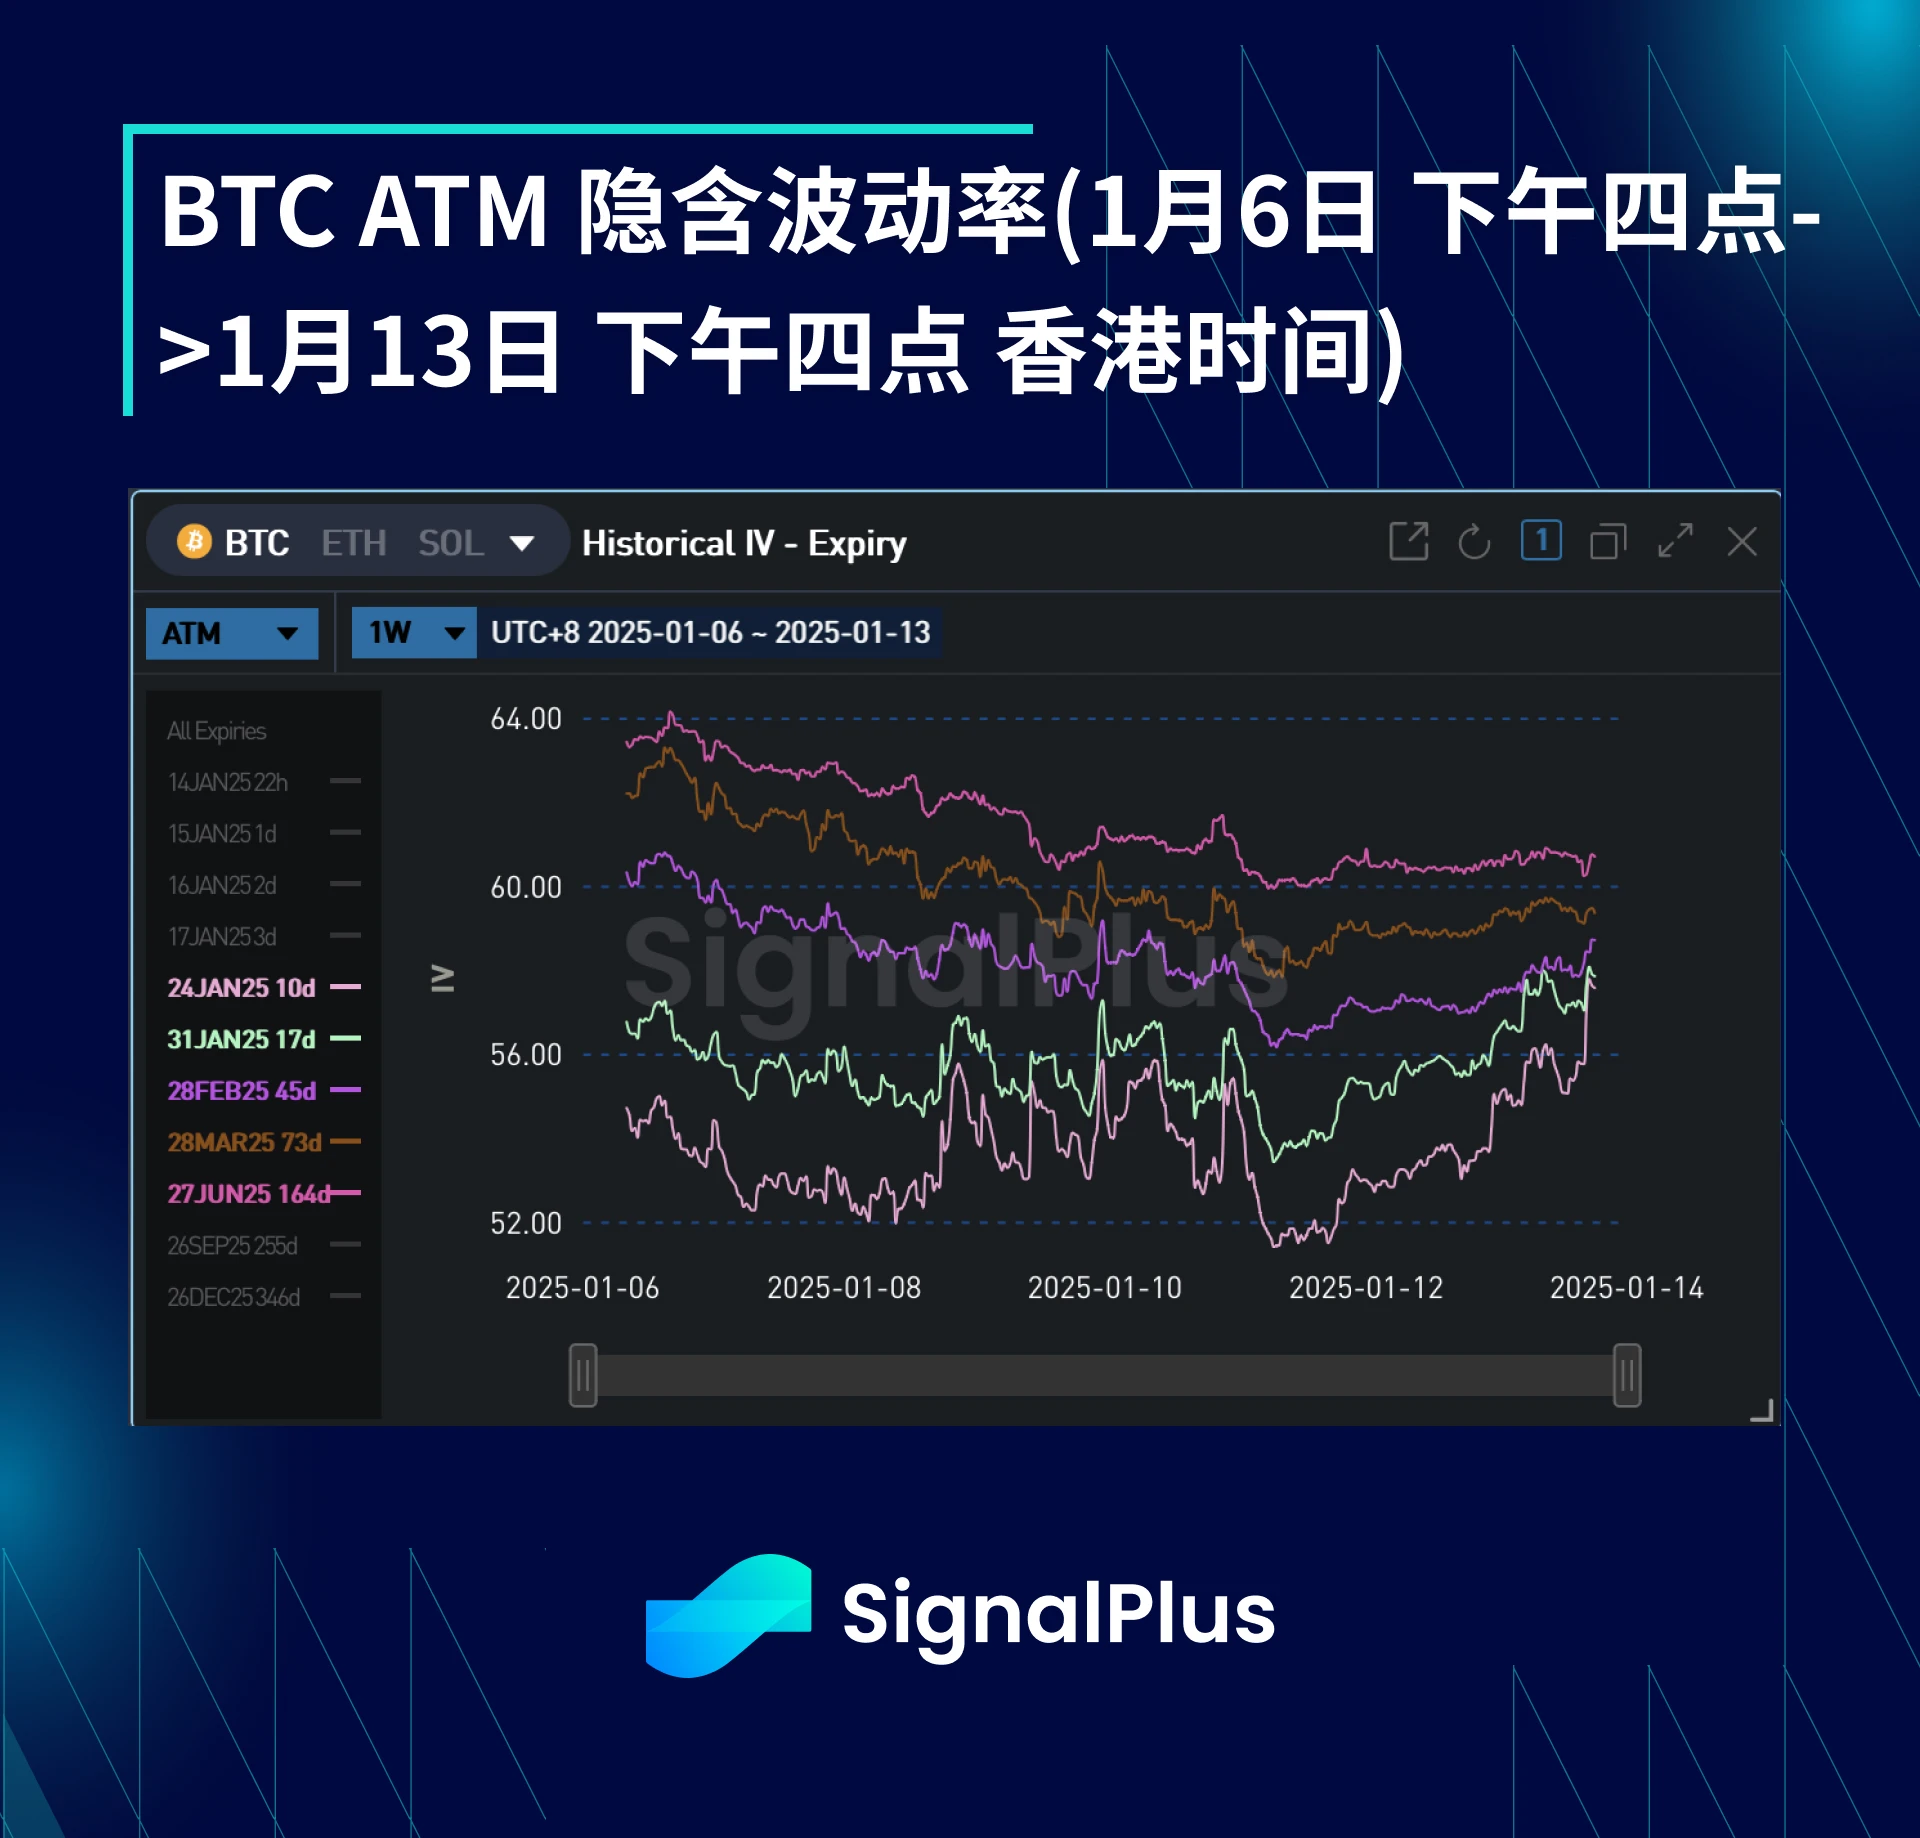
The continued local volatility in the price of the currency did cause the realized volatility to rise last week. Even taking into account the degree of volatility, the realized volatility is only in the early 50s, which is still lower than the average implied volatility last week. However, overall, as the price of the currency continues to find a clear direction, the implied volatility for expirations within 1 month is well supported at the current level.
-
At the far end of the term structure, we see that the extremely high implied volatility at the beginning of the year has been suppressed by the large flows in December, as expected. The lack of directional trend has also led to a reduction in the structural demand for volatility or directional trades, and also weakened the support for options expiring in February to June.
BTC Skewness/Kurtosis
-
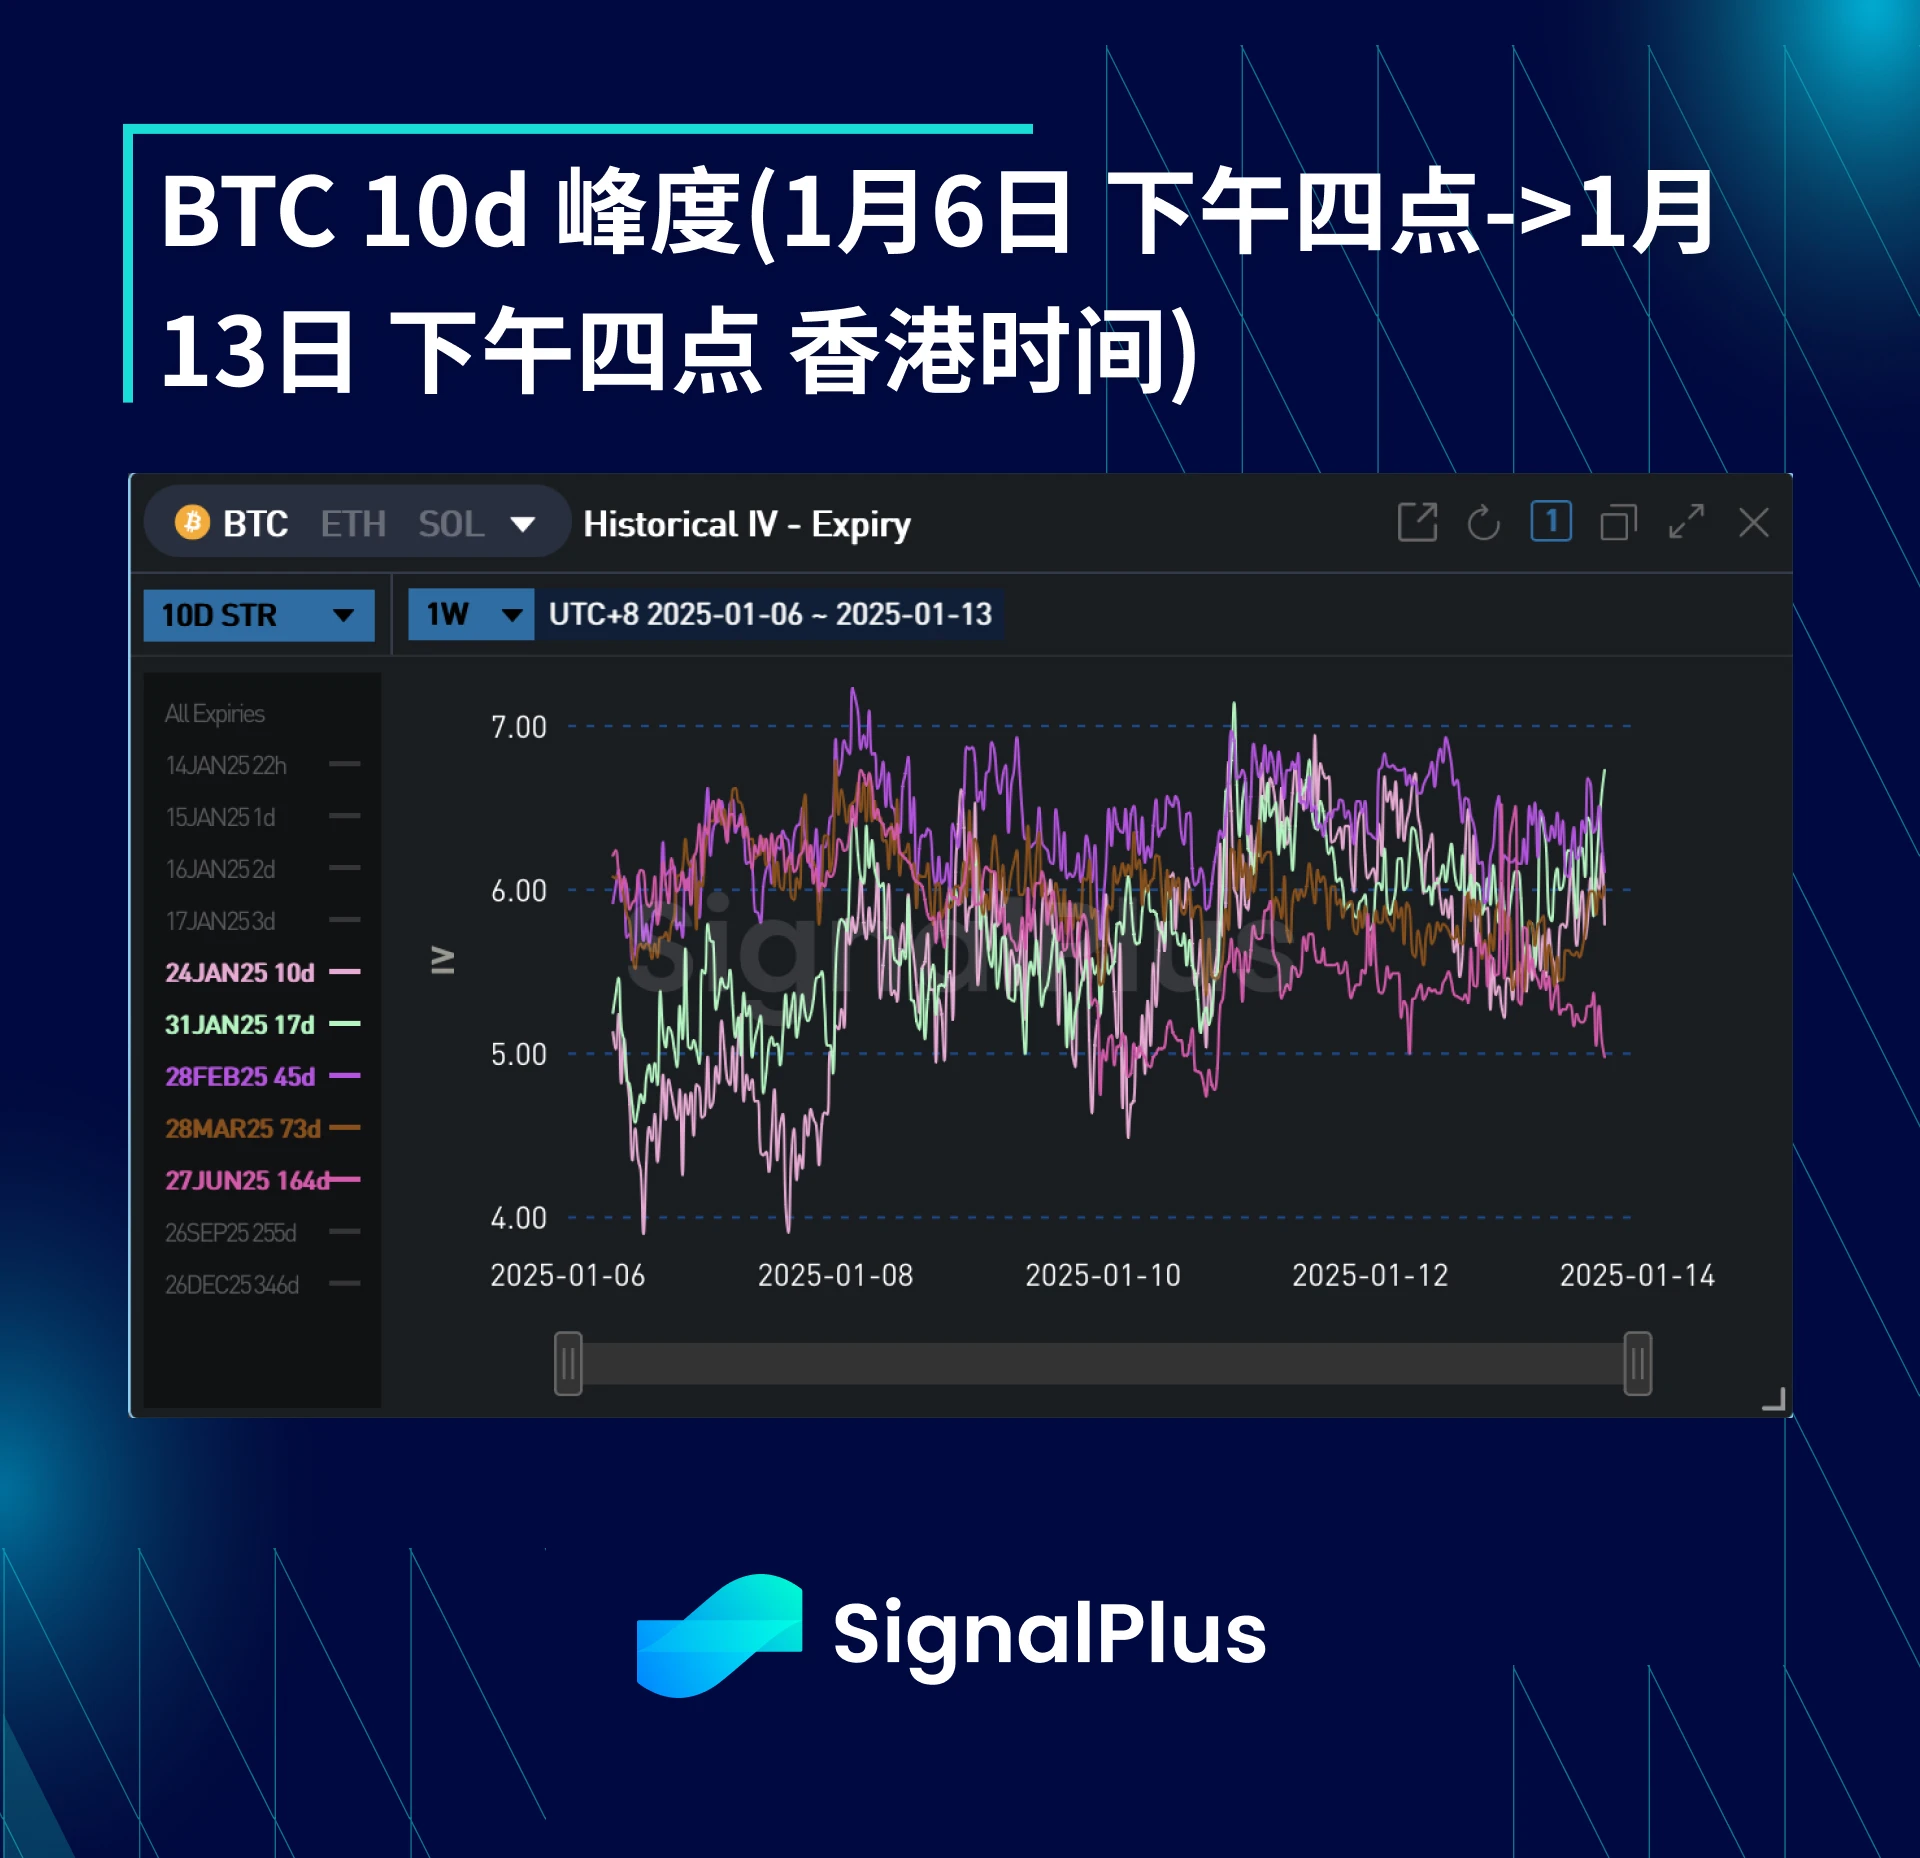
Skewness continued to decline this week as liquidity returned across the board and realized volatility rose as the price of the currency fell. In particular, all expiration dates in January favored the trading of put options. However, the price of forward skewness still supports the upside, as the market still seeks structural bullishness after Trumps inauguration once the impact of macro risks and position adjustments in January weakens.
-
Kurtosis is a bit mixed this week. With demand for the flanks outside $92-97k driving the rise of the near-term curve, demand for flank Vega positions in the far-end market has weakened (in fact, directional trading is mainly completed through call option spreads in the upside direction, which creates selling pressure on the markets momentum).
Good luck trading everyone this week!
You can use the SignalPlus trading vane function at t.signalplus.com to get more real-time crypto information. If you want to receive our updates immediately, please follow our Twitter account @SignalPlusCN, or join our WeChat group (add assistant WeChat: SignalPlus 123), Telegram group and Discord community to communicate and interact with more friends.
SignalPlus Official Website: https://www.signalplus.com
This article is sourced from the internet: BTC Volatility Weekly Review (January 6-January 13)
In the past week, BTC began to accelerate its rise, breaking through ATHs of $9,3000 and $94,000. Although the current BTC price has fallen slightly, it is still fluctuating around $93,400, and the highest increase of BTC in 24 hours is over 4.5% (the above data comes from Binance spot, November 20, 17:00). Currently, BTC has become the only investment category in the Trump economy that has not yet given back its gains. Due to extreme long positions and market concerns about continued rising yields, US stocks have given back some of their recent gains. Although geopolitics has heated up recently, under the leadership of Nvidias upcoming earnings report and technology stocks, US stocks closed again on November 19 with relatively flat data, with the Nasdaq and SP 500 rising…


