Understanding the market like a puzzle: Uncovering the inner logic of liquidity, spreads and market ups and downs
Original author: TradeStream | Improve Your Trading
Original translation: TechFlow
Trading: If we choose to act where most people are willing to trade based on common sense… then that probably means we don’t have more valuable information than anyone else.
Market Behavior Metaphor 1: Jigsaw Puzzle
I like to describe market behavior as a puzzle. You can imagine that the market as a whole is like a person trying to complete a puzzle, and volume is the pieces of the puzzle. The market will try to put all the pieces together. By analyzing the distribution of volume, we can more clearly see where the pieces are missing. When the market finds that some areas have more fragments (that is, where the volume and time are accumulated), it will try to distribute these fragments to those areas with less fragments (that is, where the volume and time are less).
How the market chooses direction
Sometimes the market is missing pieces on both sides, so how do we tell which side it will fill first?
This reminds me of a theory about human behavior in the book Atomic Habits. In this case, we need to focus on two key points:
Attractiveness: People generally want to see rewards for their actions, and so do markets, as they reflect human behavior. As we discussed earlier, we tend to avoid overly crowded trading scenarios, and the more attractive strategies are often those that trade against the majority of out-of-position players, especially when we have clear structural rationale.
Reduce resistance: According to the Law of Least Effort, the more energy something requires, the less likely it is to happen. If the resistance is too great, it will become more difficult for us to achieve our goals.
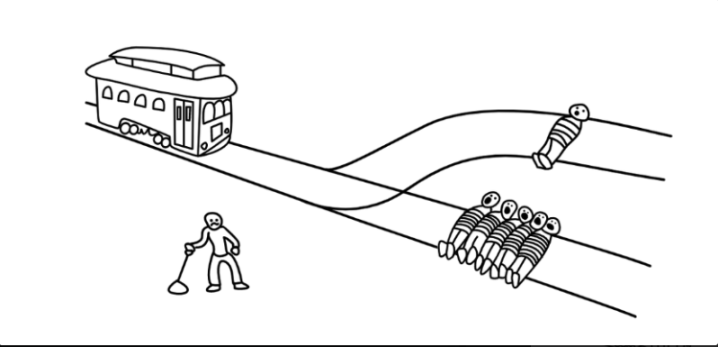
The second metaphor of market behavior: the trolley problem
Imagine the market is a train, and this train is as eager to hunt as a killer. When we take action in the fair value zone, both sides of the market are crowded with participants, so it is difficult to predict which side it will choose to hunt more people. However, once the market chooses one side, the other side becomes the only choice, so our decision will become simpler.
What is liquidity?
Liquidity refers to whether there are enough counterparties in the market to trade. When we trade, we either consume liquidity or provide liquidity. If the price is stable in a certain area (i.e., the balance area) or cannot fluctuate smoothly, it is because the buyer has failed to consume enough liquidity; on the contrary, if the price can fluctuate smoothly, it means that the buyer has successfully consumed enough liquidity.
Limit and Market Orders
Limit orders are about adding liquidity, while market orders are tools to complete trades and consume this liquidity. Passive liquidity (limit orders) is usually more influential because limit orders often determine market structure, while aggressive market orders are absorbed at key points.
Why are limit orders more impactful? Because when you execute a market order, you need to cross the bid-ask spread, which means you are in a state of unrealized loss immediately after placing the order.
What is the spread?
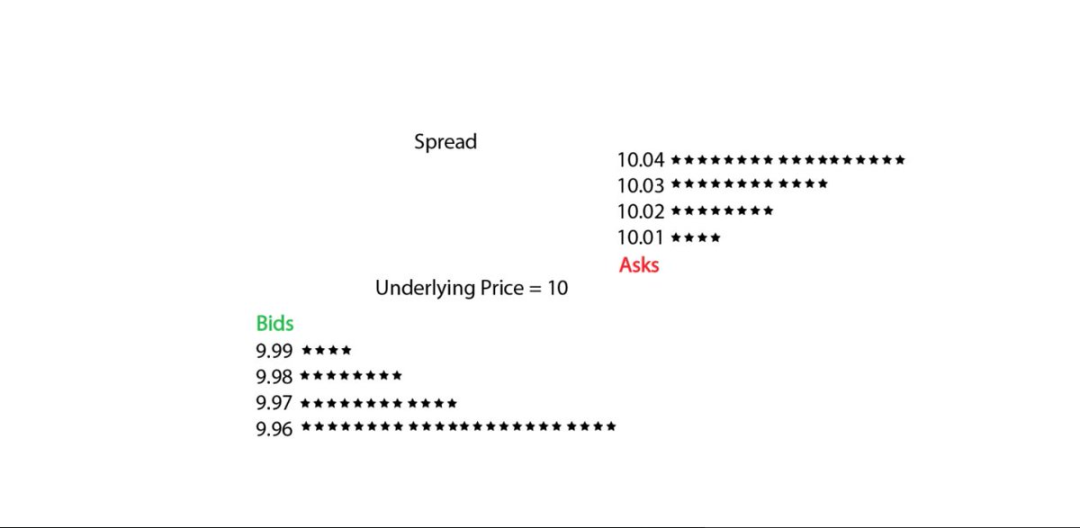
The spread is the difference between the bid price (advertised price quote) and the ask price (advertised price bid) for an asset. Market makers provide liquidity through the spread, meaning that the price for buying an asset immediately is usually slightly above the market price, while the price for selling it immediately is slightly below the market price.
Suppose an asset is currently priced at 10.00, and the asterisks represent each contract. If we want to buy it immediately, there is no quote at 10.00 in the market, because if there was, the market maker would not be able to make a profit. Therefore, they will set the advertised liquidity slightly higher, such as placing four contracts at 10.01, to capture this tiny difference.
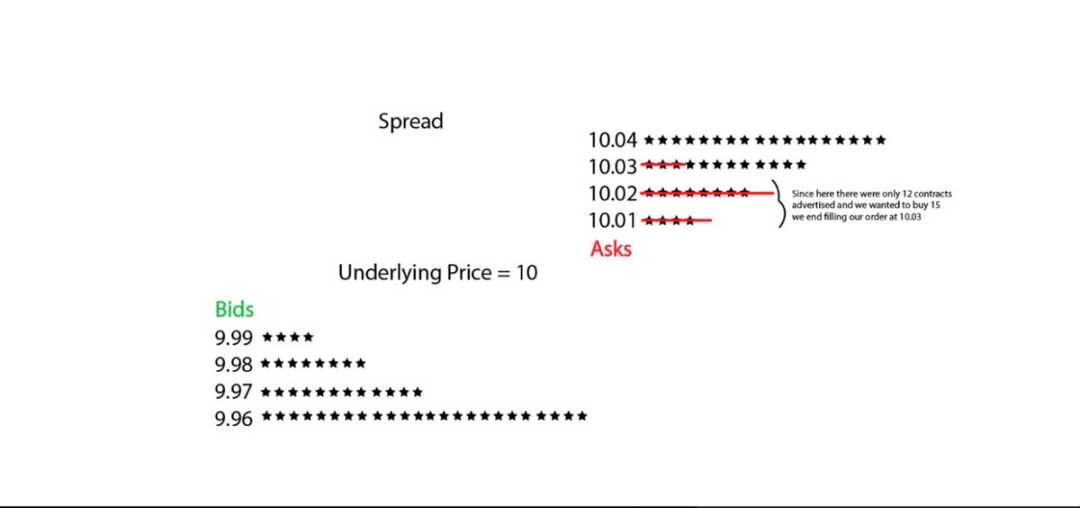
If we decide to buy three contracts, we will be traded at 10.01. But what if we want to buy more, say 15? We will need to straddle the spread until we find enough orders to complete the trade. Therefore, the price will eventually be pushed to 10.03, because only at this price level will there be enough contracts to meet our needs.
Through this example, we can understand why limit orders are usually more influential. Small traders have a negligible impact on the price because they will not experience significant slippage. But if someone wants to buy 500 contracts and there is not enough liquidity nearby, he will have to cross a huge spread, causing significant price fluctuations.
If traders choose to place orders in areas with sufficient liquidity, they can avoid significant slippage. So, where is liquidity usually concentrated? The answer is above the swing high and below the swing low. This is because most traders based on technical analysis will show similar behavior when setting stops, and these positions tend to be concentrated areas of stop losses, and prices are also prone to reversal at these positions.
So, their stop loss is your entry point? Exactly.
Summarize
-
Impatient buyers or sellers drive up prices through market orders (active side), consuming liquidity.
-
More patient buyers or sellers prevent price movements through limit orders (passive side).
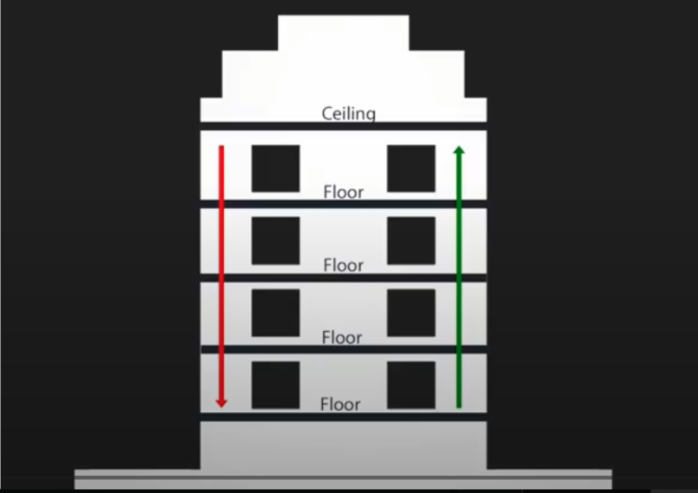
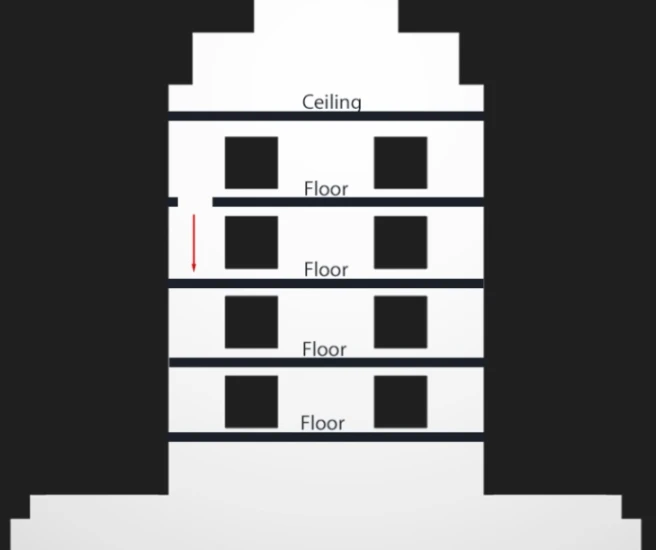
We can use a metaphor to describe this: the market order is like a hammer, and the limit order is the floor or ceiling of a building. To break through the floor or ceiling, the hammer needs to be strong enough to break it.
What happens when a floor is broken? The price moves quickly to the next floor.
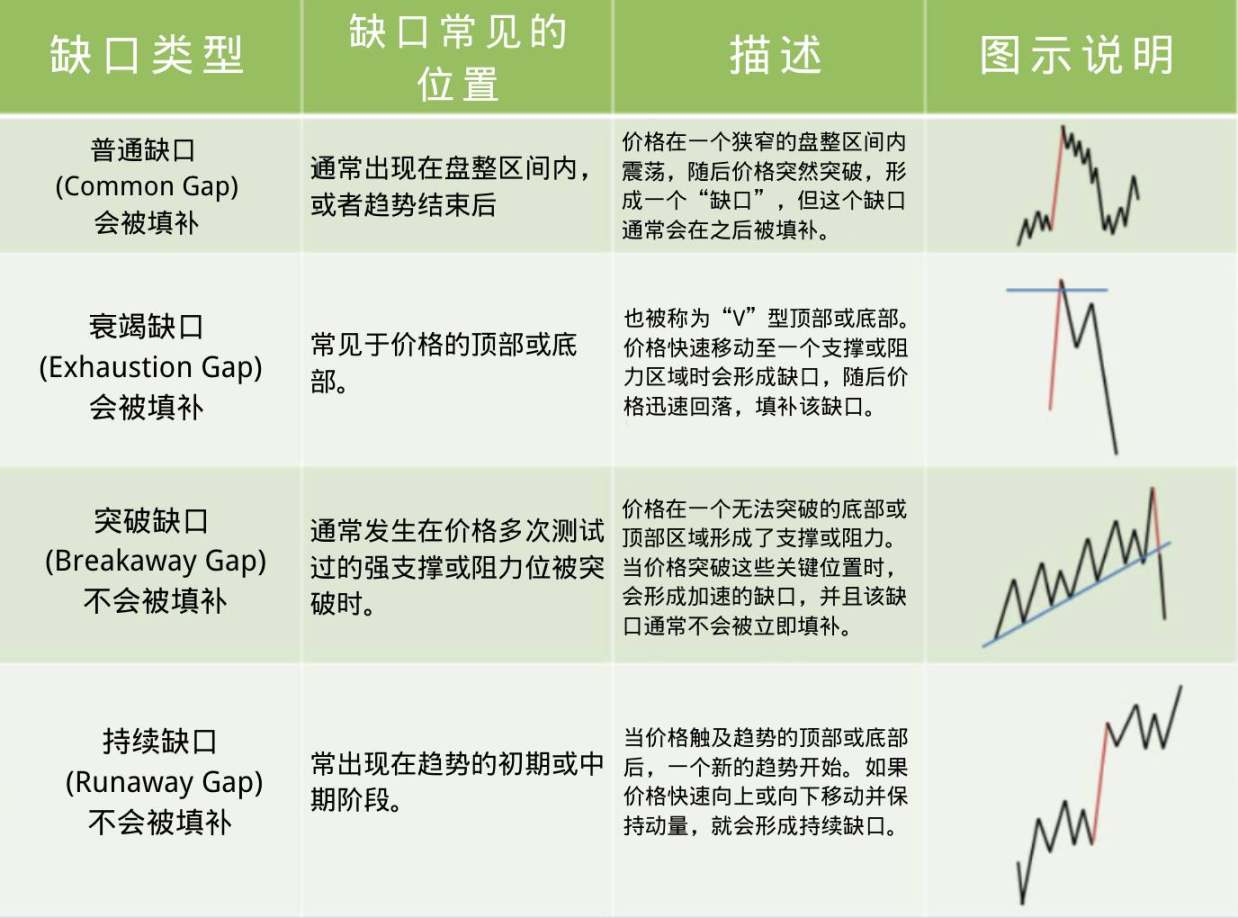
Once the price reaches the next floor, it becomes easier to move upward because the ceiling has been broken, forming a gap, which allows the price to fluctuate more easily where liquidity is scarce.
Liquidity cascading is a very effective way to make money because we are trading with price insensitive groups that are forced to trade (such as traders who are forced to close their positions). But we need to be clear about what we are trading.
If you are trading a liquidity premium, this effect is usually very short-lived, lasting 10-15 seconds at most. In a cascading environment, this changes. In this case, you need to judge whether liquidity has fully recovered from the initial surge.
The knock-on effect of momentum shifts is less reliable than the liquidity premium, but it is more persistent (and most people are actually trading this momentum effect when they think they are trading the liquidity premium).
The first method (liquidity premium) is more suitable for PNL attribution (i.e. analyzing the reasons for making money) and is also a more ideal way of operation. The second method (momentum effect) can capture the core part of large fluctuations, but it is accompanied by greater volatility and looser risk control.
In general, liquidity cascades can cause supply and demand imbalances as a large number of price-insensitive traders rush in and the order book cannot withstand so many active traders. But once the market stabilizes, it will be easier for prices to return to areas that failed to form sufficient volume due to rapid fluctuations.
After all, the market is a double auction mechanism and it will often test those low volume areas for two reasons:
-
Such a path has less resistance;
-
The market seeks efficiency and it will test these areas to see if anyone is willing to trade at these price levels.
As a result, the market will experience a mechanical bounce as the order book takes time to rebalance. At this time, only a small amount of trading volume is needed to drive price fluctuations. Once the market stabilizes, price movements will rely more on momentum, accompanied by higher volatility, but also able to capture more profits.
Remember, high volatility is often followed by high volatility and low volatility is often followed by low volatility, which is called volatility clustering. Therefore, seize the opportunity and adjust your risk management strategy according to each change in market status.
This article is sourced from the internet: Understanding the market like a puzzle: Uncovering the inner logic of liquidity, spreads and market ups and downs
Related: Talking about Ethereum’s current “dilemma” from the perspective of the primary market
Original author: Lao Bai, ABCDE investment research partner Since @jason_chen 998s angry at their lack of competition ETH article fermented, there have been many articles discussing the dispute between ETH and Solana on the Internet in the past few days. I dont intend to repeat or elaborate. Let me add a perspective (not Fud), that is, from the perspective of primary market innovation and financing. After all, many of these projects have not yet entered the public eye and are still being intensively organized. In the two years at ABCDE, I have talked about more than 1,000 projects. Although it certainly cannot cover the overall status of the primary market, the number of samples should not be small. In 2023, ETH and Solana will develop independently in the primary market.…
