My XP
0
Login
At 21:38 on October 1, Eastern Time, the White House said that Iran was preparing to attack Israel. BTC then fell below the upward trend line that had lasted for nearly a month in September and quickly accelerated its decline. Since then, it has repeatedly fallen back to the $60,000 level. The situation in the Middle East is still tense, and the Iranian military claims that it has prepared at least 10 plans to deal with the Israeli militarys attack.
On September 24, Chinas central bank announced the creation of structural monetary policy tools to support financial markets. The deposit reserve ratio was lowered by 0.5 percentage points and the main policy interest rate was reduced by 20 basis points to provide long-term liquidity for the A-share market. The A-share index rose in response and has risen by 26.95% as of todays close. China and the United States are competing for the liquidity of global capital.
The U.S. economic data released in early October to a certain extent demonstrated that the U.S. economy is very resilient, the unemployment rate has dropped, non-farm payrolls far exceeded expectations, and the data for July and August were revised upward. The U.S. job market was not bad at the time. However, the 50 basis point rate cut in September based on the poor employment data to guard against the risk of economic recession seems to have been a mistake. Former U.S. Treasury Secretary Summers also expressed a similar view. So how will the Federal Reserve proceed with the subsequent rate cuts?
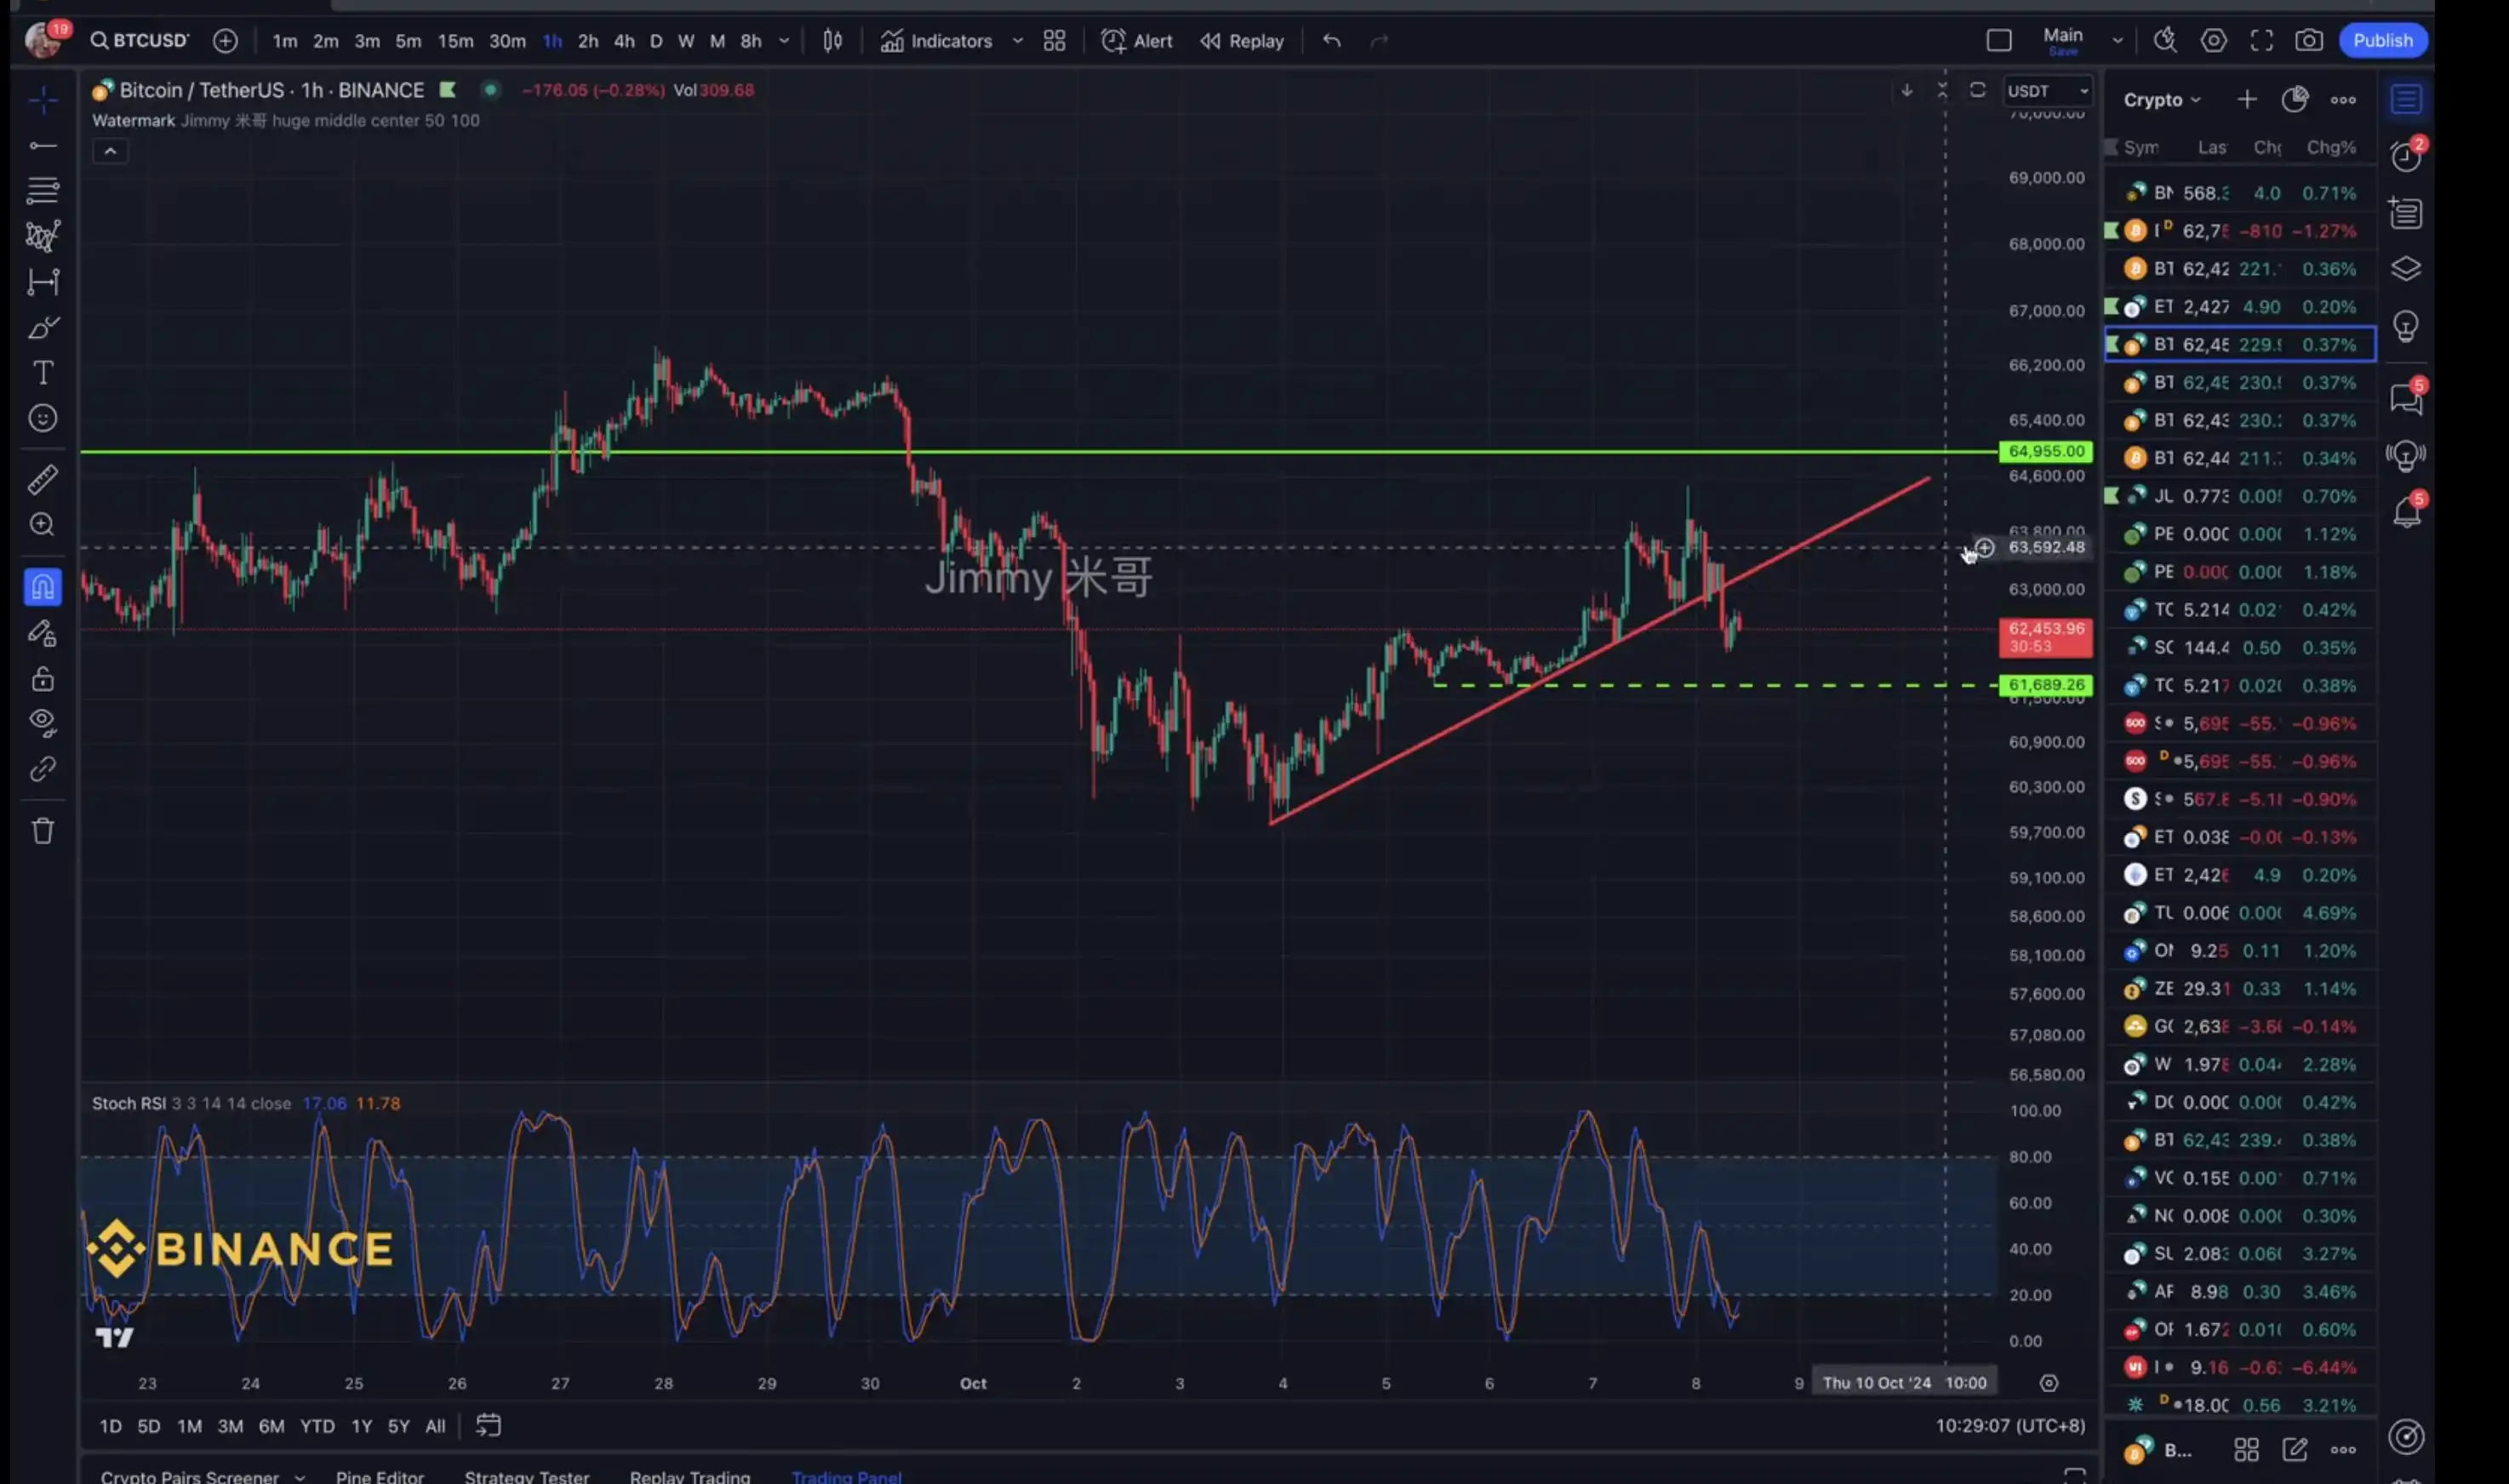
BTC has repeatedly stepped back to $60,000 and gradually reduced its volume, and quickly rebounded to $64,000. The four-hour moving average group gradually adhered. Will there be a large-scale market in the future? From February to mid-October, BTC has been fluctuating in a wide range for 8 months. Is this a high bottom, existing as an upward relay, or as a high top, and needs to seek more downward adjustments? Traders in the market have their own opinions.
@luckychartape believes that BTC is still in a bull market cycle. After the fourth wave finds support at $42,000, it will start the fifth wave, and the ultimate target will be the price range of $260,000.
@TraderChenge believes that if the market falls below $59,800, it may complete such a potential bat pattern and continue to fall? However, before the market falls below $59,800, I will not be bearish. Before it falls below $59,800, my operation idea must be to buy at a low level. The short-term market is changeable, and we need to continue to pay attention to this potential bat pattern.

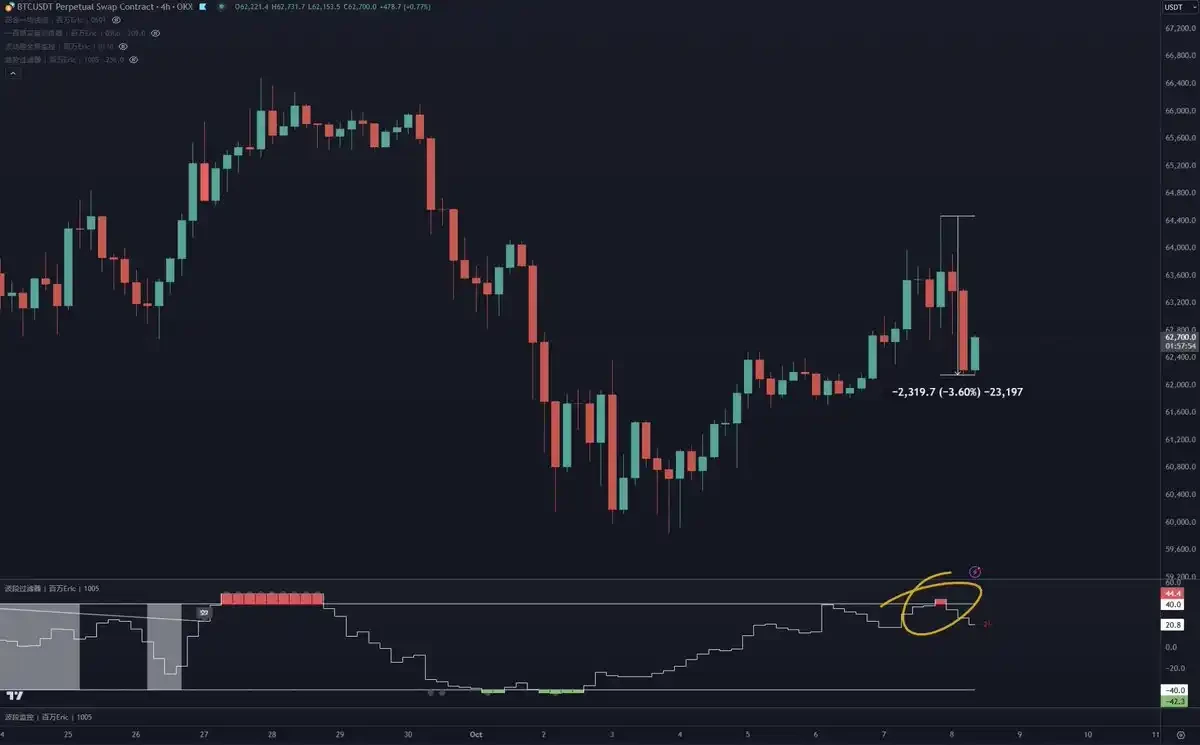
@CycleStudies believes that after Bitcoin price hit the overbought area, it has retreated 3.6%, to about $2,319. It seems to be a mild retracement at present, and the bullish structure is still there.
@CryptosLaowai believes that at a small level, it is currently in a narrow range of 61,000-64,000 US dollars. There may be a false break at 61,500 US dollars, and a large number of buy orders will be executed before rebounding upward. It is unlikely to break through 66,000 US dollars to form a Higher High. There should be a higher point than the previous small level high of 64,400 US dollars.
At a macro level, it is believed that there will be a large-scale correction to around $40,000, forming a head and shoulders bottom pattern. The real bull market will begin in 2025, and the pattern at this time will be more like the pattern at the end of 2019 and the beginning of 2020.

@0x taibai believes that the current main trend is a potential correction. The rebound did not reach the expected $65,000. Strong short selling pressure appeared in the $64,400 range. Whether this is a correction or a reversal needs to be further tested. We need to pay attention to the risk of further correction. The key support positions that need to be paid attention to in the future are $60,000 and $57,800, and the key resistance positions are $63,800 and $65,000.

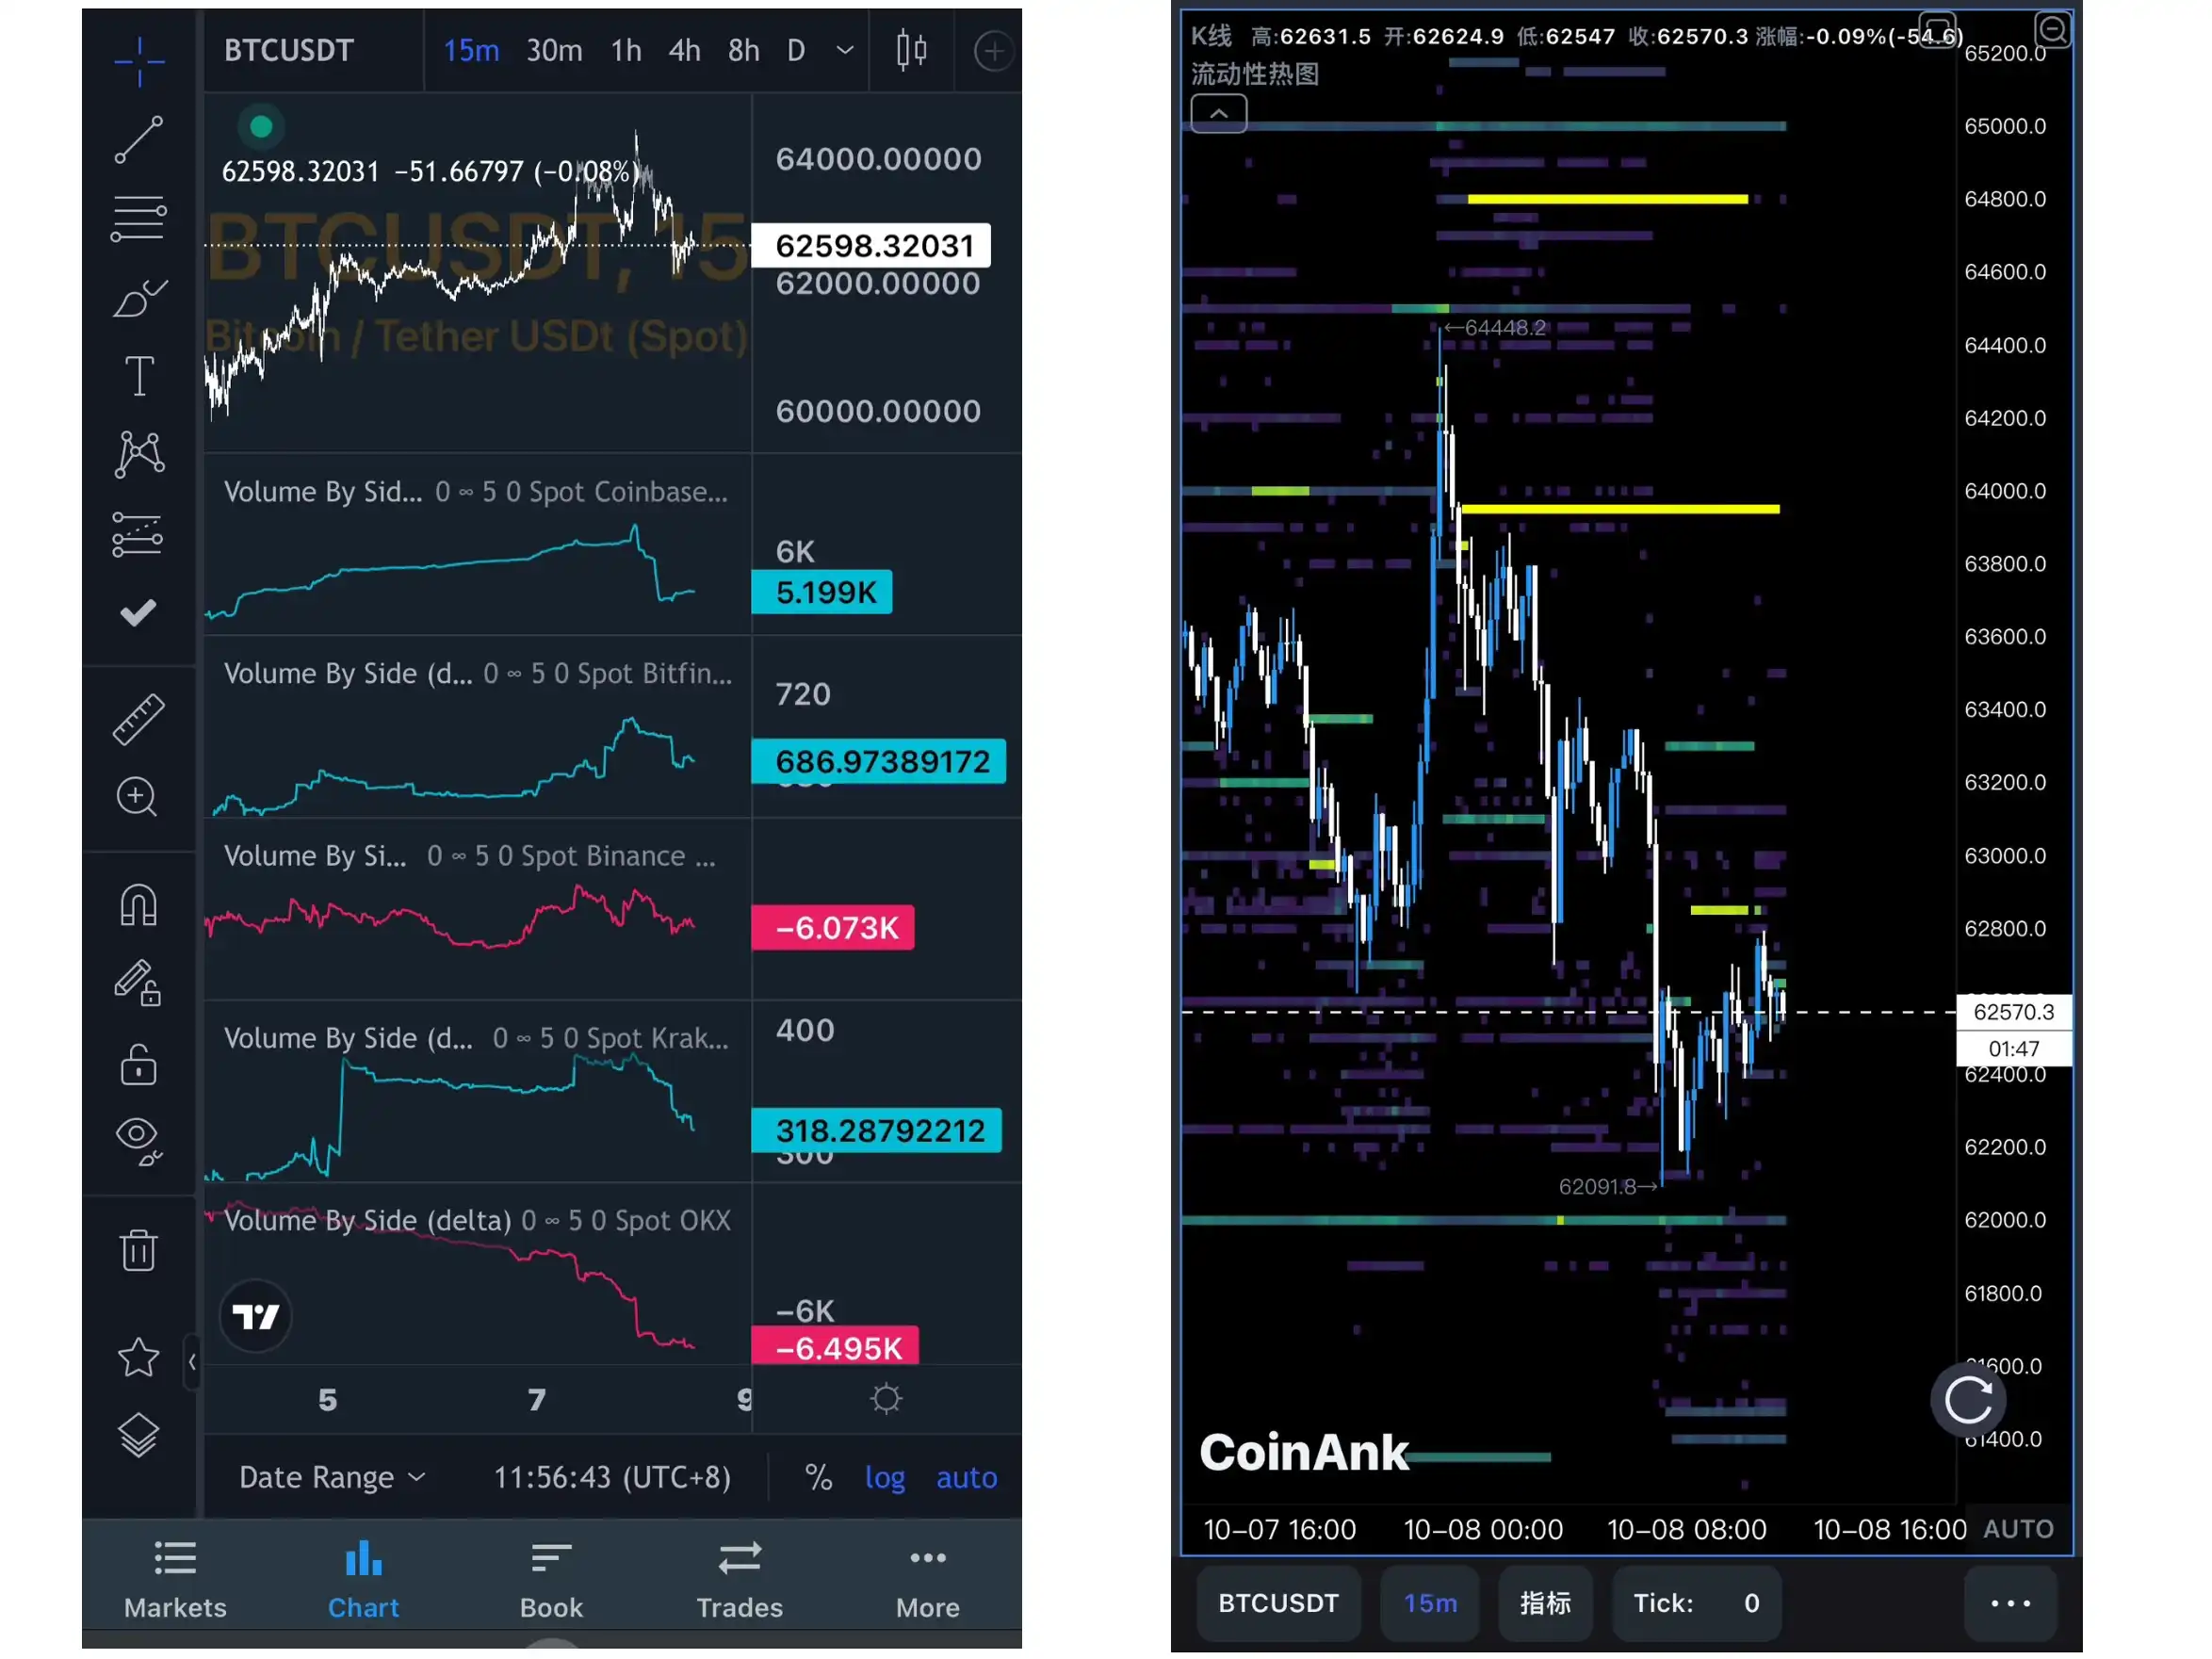
@Xbt 886 From the perspective of the order book, the market and whales are mostly selling their chips, and the outlook is bearish.
@CryptoPainter_X believes that as the U.S. Treasury yield soared to 4%, the markets expectations for further aggressive interest rate cuts began to waver, perhaps because of the domestic A-shares scramble for global liquidity. On the other hand, traders in the interest rate swap market began to further bet on the possibility of no interest rate cut on November 7, and the probability has gradually increased from 3% last week to 10% (currently reaching 15.5%).
Combined with the recent financial operations between China and the United States, it can be clearly felt that both sides are somewhat aggressive in competing for global asset liquidity. If the next inflation data report shows a rebound, it will force the market to further price in the possibility of suspending interest rate cuts in November.
From the perspective of the financial war between China and the United States, China has used the execution power of the epidemic lockdown to drive the stock market as a liquidity pool. Even if the Federal Reserve cuts interest rates by 50 basis points in one go, it is still not as thick as Chinas faucet. Intuitively speaking, the Federal Reserves attempt to cut interest rates by 50 basis points was wrong, and it may continue to maintain a high interest rate environment.
Next, we need to pay close attention to inflation data. If inflation data rises rapidly, then there is a real possibility that there will be no interest rate cut in November. As BTC is at the tail of the Fed鈥檚 liquidity pool, it will be difficult for it to continue its bull market.

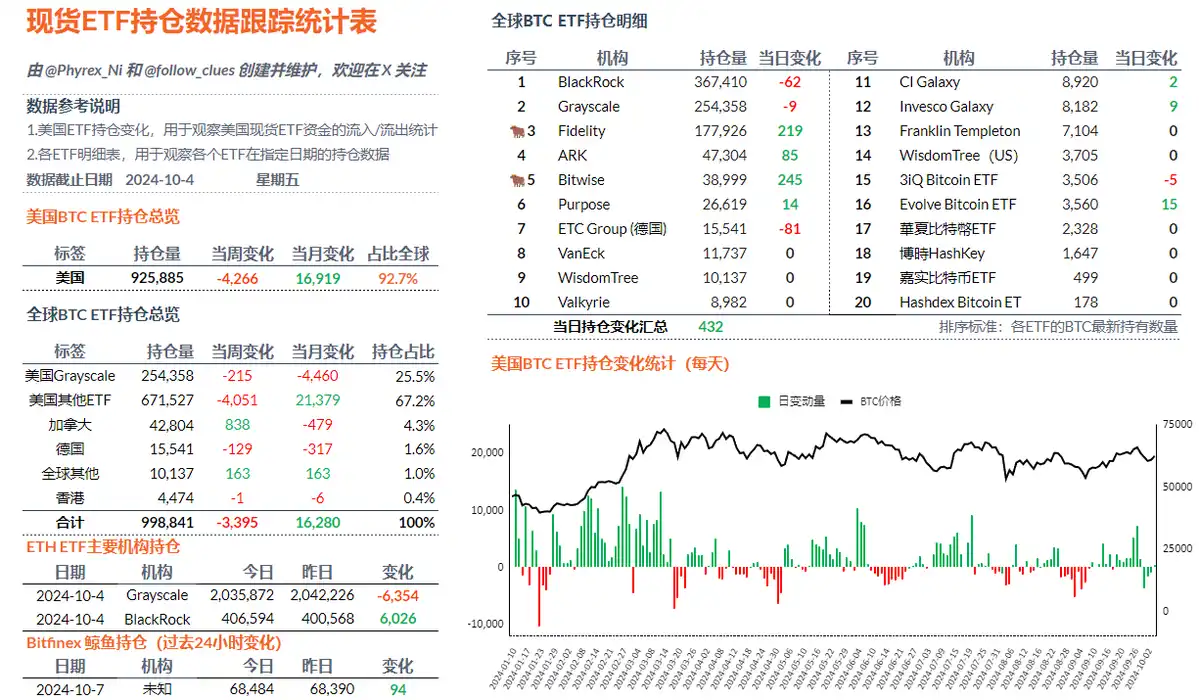
@Phyrex_Ni From the perspective of BTC ETF, there was a net outflow of 3,394 BTC in the past week, ending three consecutive weeks of net increase, of which 4,265 BTC flowed out from twelve ETF institutions in the United States. The only four-digit increase last week was 2,100 BTC from BlackRock. The decline in purchasing power is very obvious. There is no large-scale selling at present, so the price of BTC is more linked to macro sentiment. Unless there is a very obvious negative news, there is not much pressure on the price.
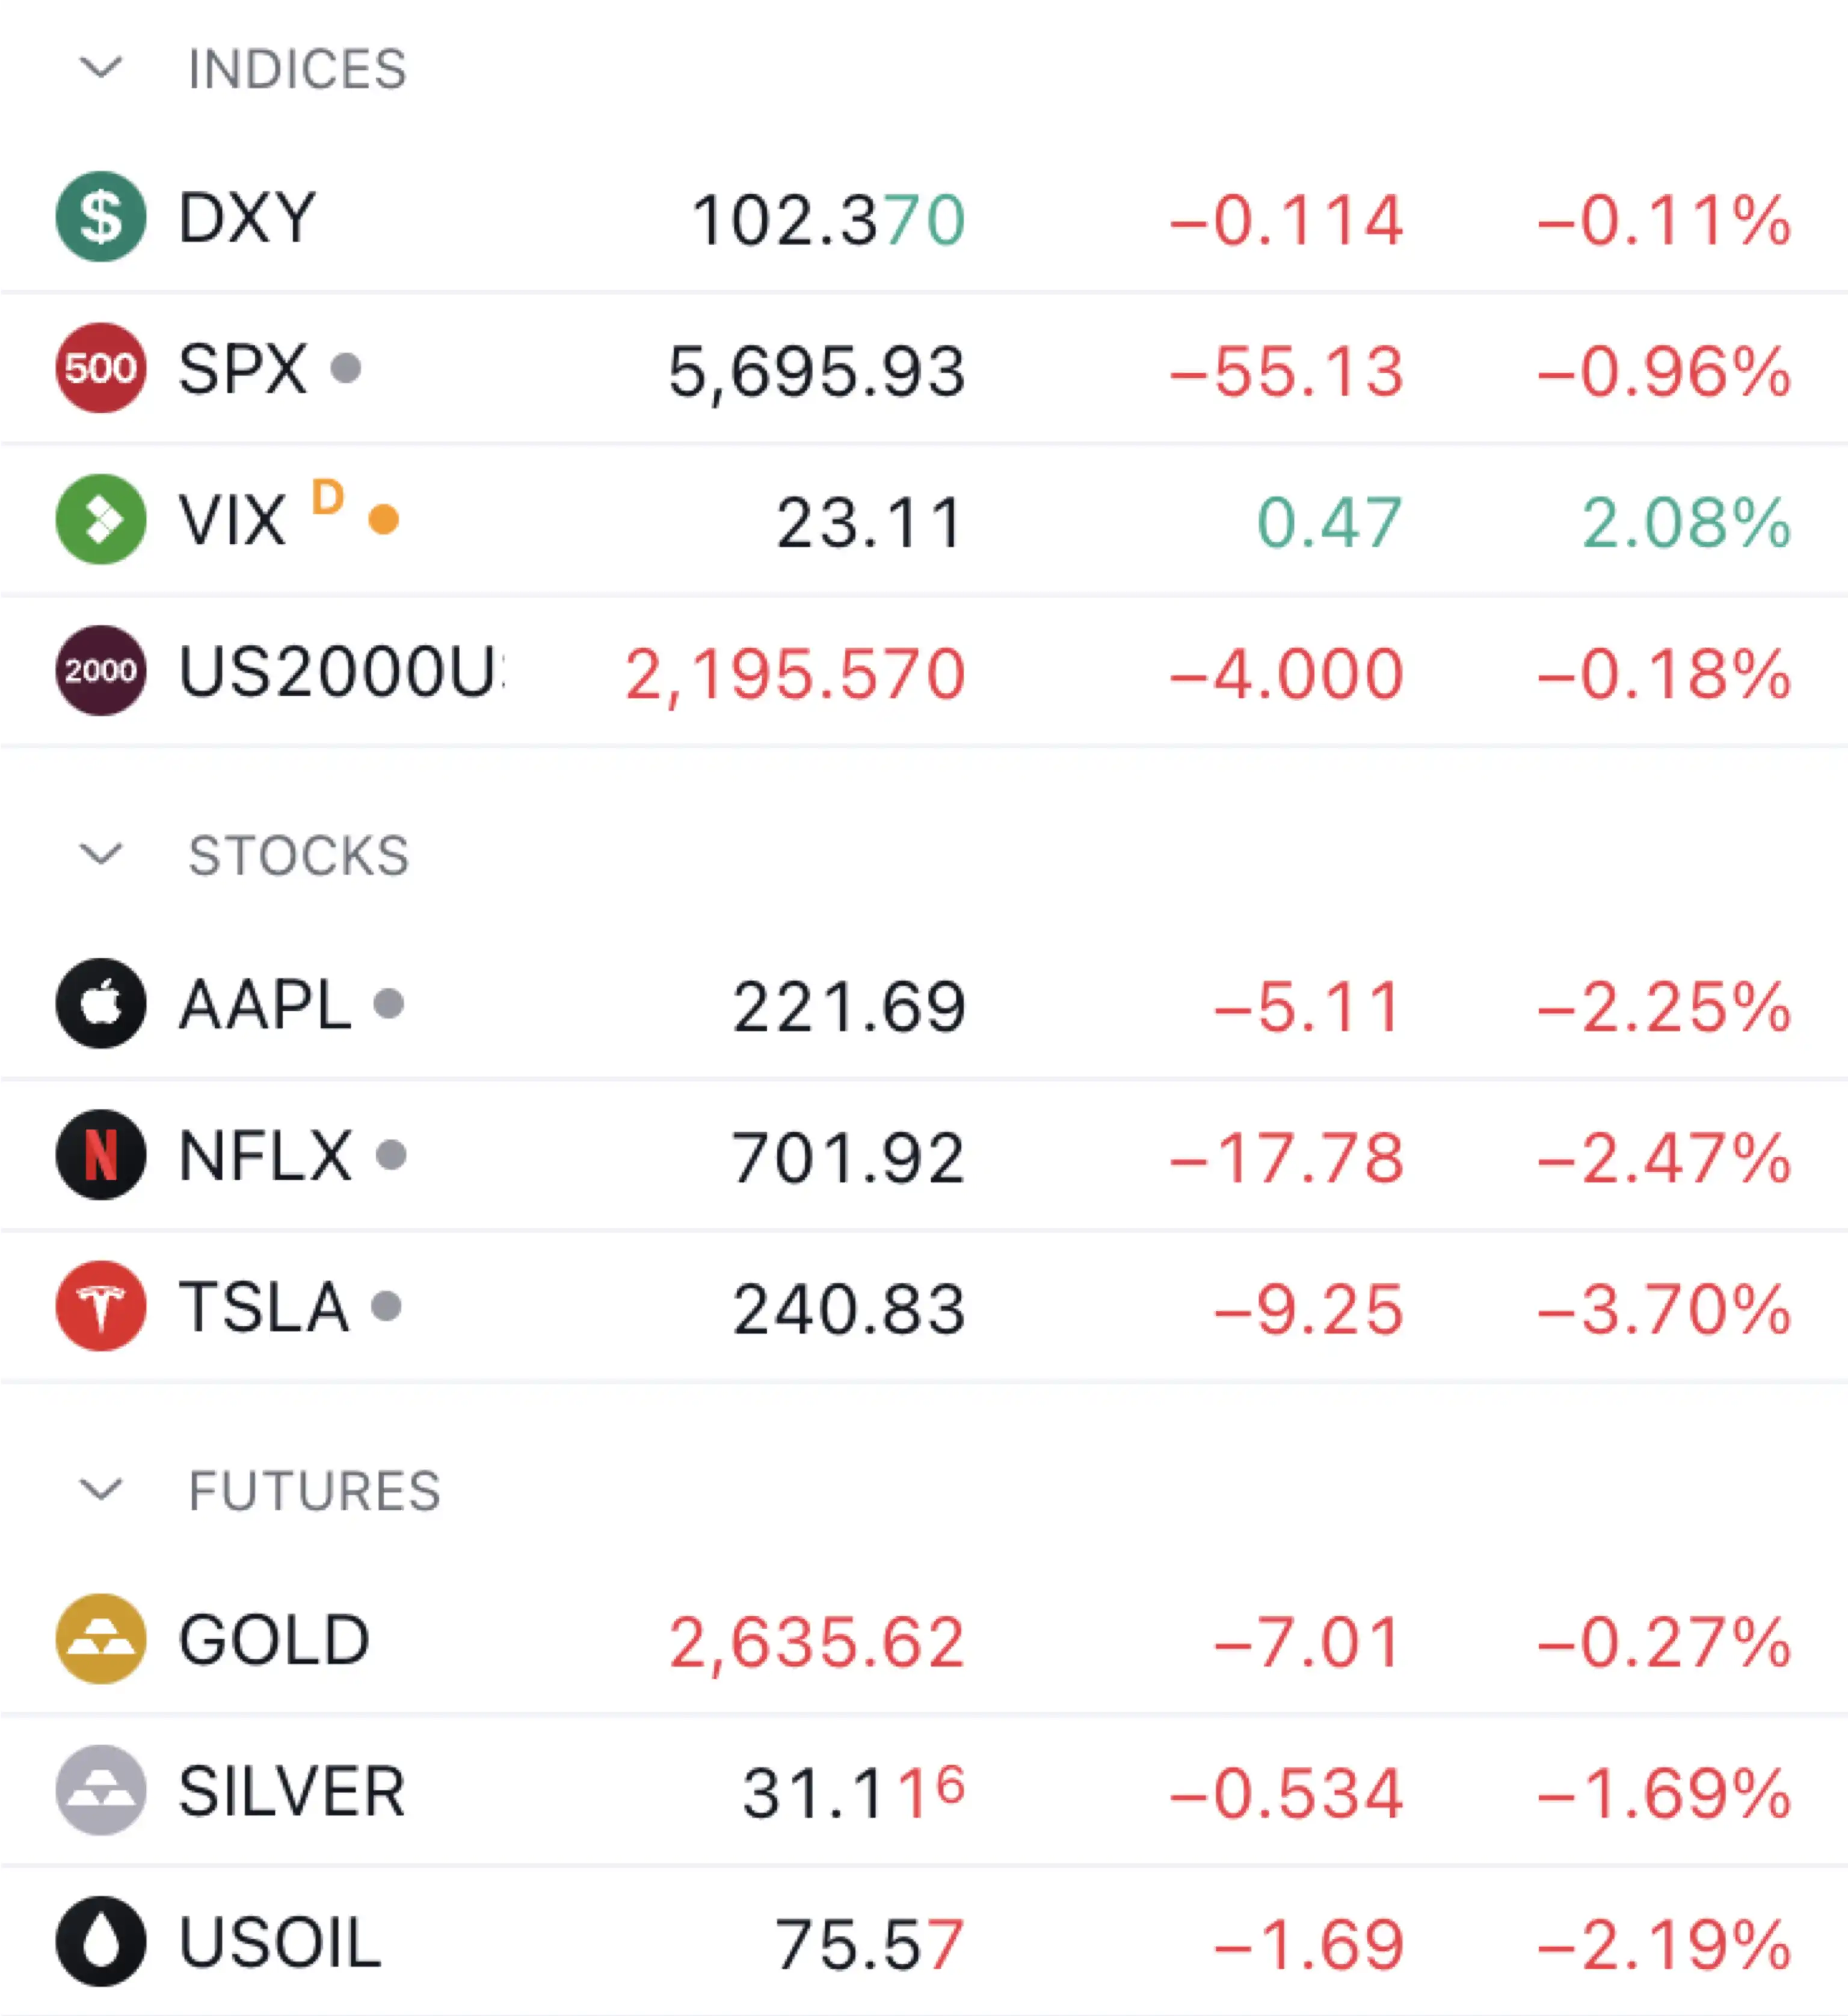
@MaoShu_CN believes that the overly strong employment data on October 4 was a bit too strong. Under the influence of such data, a strong US economy has been built, but the steepness of the US Treasury yield curve has consolidated the health and stability of the economy, but it is not very friendly to the stock market in the short term. The current trend of US stocks is not very good, with a small decline. The US dollar index broke through 102 again and is currently trading sideways around 102.4, continuing to strengthen, which is also the result of last weeks data stimulus.
The 10-year US Treasury yield has once again exceeded 4%, and the yield curve is steep, which is also the killer of the US economy. Gold fell back from its highs last week and is currently fluctuating at a high level, with large intraday fluctuations. It is currently in the stage of falling back and rebounding, with a price of US$2,635. The gold price has experienced several days of consolidation and is likely to rise again this week. Of course, geopolitical factors may stimulate the rise of gold.
This article is sourced from the internet: Middle East turmoil, A-shares bloodsucking, how do traders view the future trend of BTC
Original author: JiaYi This chart from Odaily is very interesting. From the users perspective, the endless stream of Meme and Ton mini-game projects have almost swallowed up the market. Many people point the finger at Binance, thinking that it has corrupted the atmosphere. However, after checking one by one, it turns out that the big exchanges are surprisingly in step with each other. The big brother does not laugh at the second brother. To put it bluntly, this is not just a problem for any CEX, but the entire market is going through a period of adjustment pain. It’s just that Binance’s externalities are too large, and its every move directly affects everyone’s nerves and becomes a weather vane. Therefore, when the market is systematically in trouble, it becomes the…


