My XP
0
Login
Original author: Lars, Head of Research at The Block
Original translation: Jordan, PANews
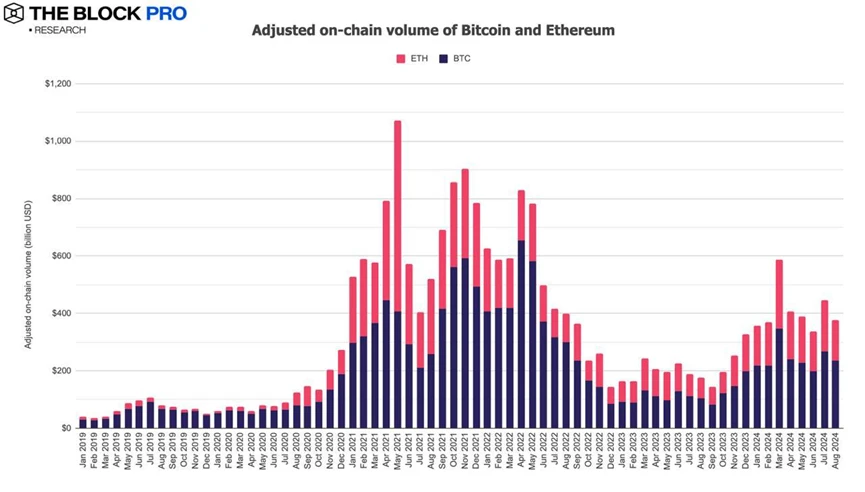
1. In August, the adjusted total transaction volume on the Bitcoin and Ethereum chains fell by 15.3% to $377 billion, of which Bitcoin’s adjusted transaction volume fell by 12.1% and Ethereum’s fell by 20.2%.
2. In August, the adjusted on-chain transaction volume of stablecoins increased by 20.5% to US$1.2 trillion, and the supply of stablecoins issued increased by 2.9% to US$148.4 billion, of which USDT and USDC had market shares of 78.7% and 17.4%, respectively.

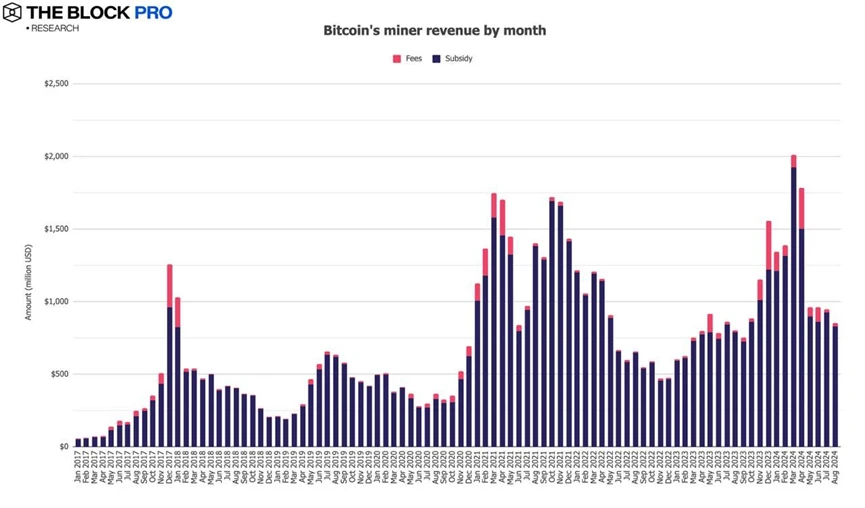
3. Bitcoin miners’ revenue reached $851.4 million in August, a decrease of 10.4%. In addition, Ethereum staking revenue also fell by 19.3% to $218.2 million.
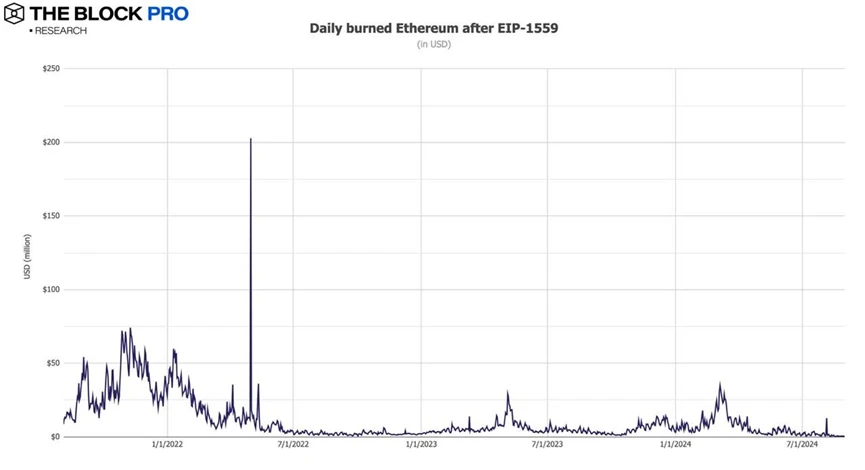
4. In August, the Ethereum network destroyed a total of 13,467 ETH, equivalent to $34.9 million. Data shows that since the implementation of EIP-1559 in early August 2021, Ethereum has destroyed a total of about 4.37 million ETH, worth about $12.3 billion.
5. In August, the transaction volume of the NFT market on the Ethereum chain continued its downward trend, falling by 12.8% to approximately US$123.2 million.

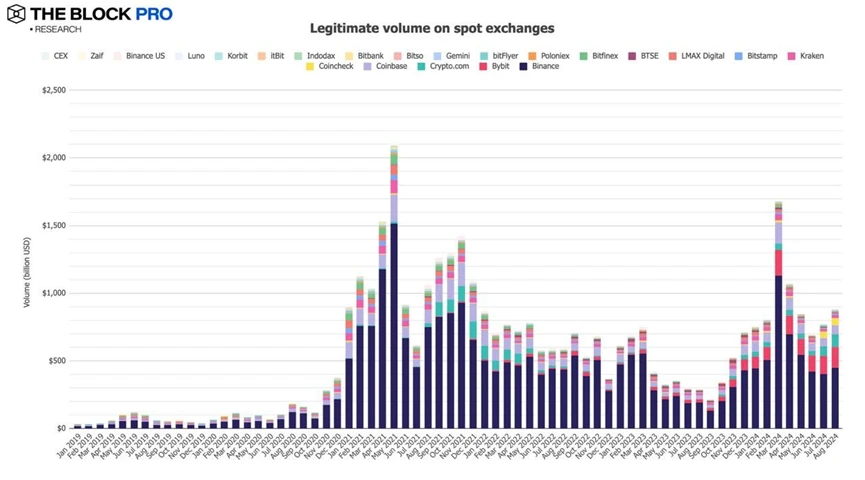
6. The spot trading volume of compliant centralized exchanges (CEX) increased in August, increasing by 13.7% to US$877.5 billion.
7. In August, the net inflow of spot Bitcoin ETF showed negative growth, with outflow amount of about US$422.1 million.

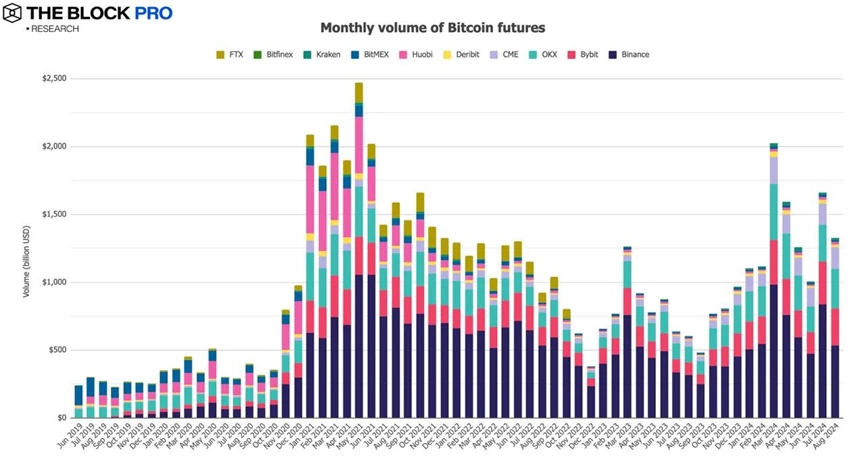
8. In terms of crypto futures, the open interest of Bitcoin futures fell by 17.9% in August; the open interest of Ethereum futures fell by 28.6%; in terms of futures trading volume, Bitcoin futures trading volume fell by 20.2% in August to US$1.33 trillion, and Ethereum futures trading volume fell by 22.2%.
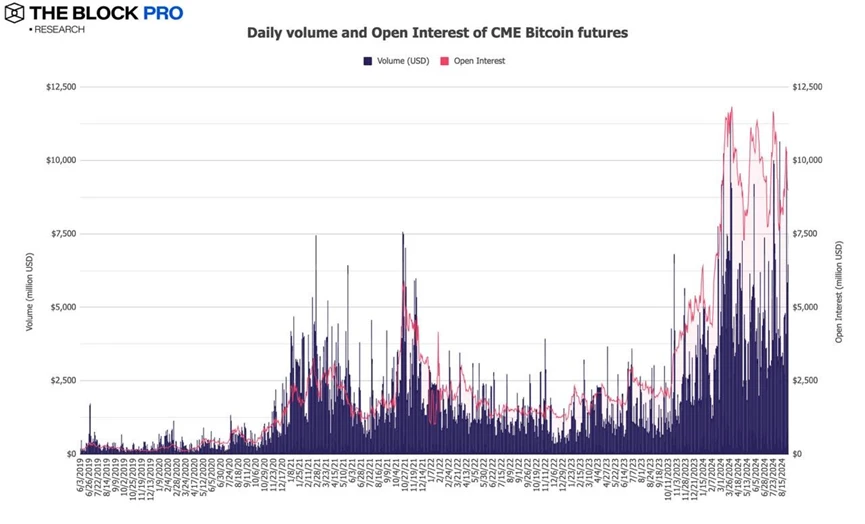
9. In August, CME Bitcoin futures open interest decreased by 15.3% to $9 billion, and the average daily volume decreased by 0.2% to approximately $5.04 billion.
10. In August, the average monthly trading volume of Ethereum futures fell by US$587.5 billion, a drop of 22.2%.

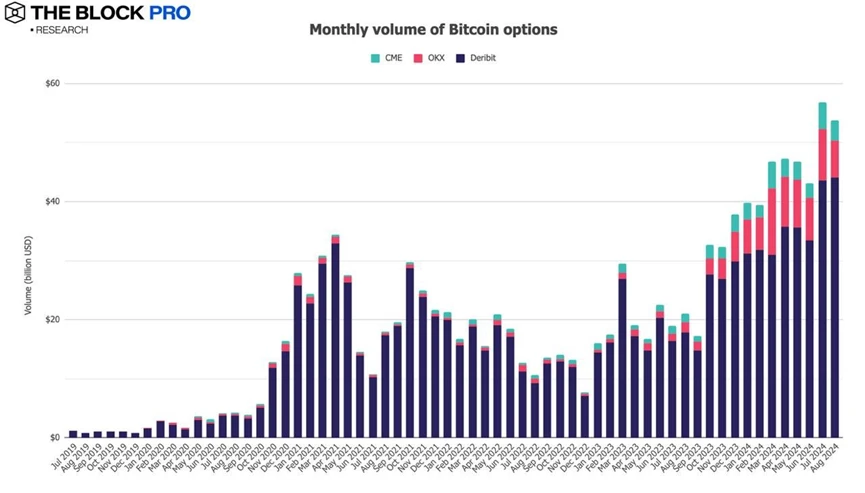
11. In terms of cryptocurrency options, the open interest of Bitcoin options fell by 3.8% in August, and the open interest of Ethereum options also fell by 13.9%. In addition, in terms of Bitcoin and Ethereum options trading volume, the monthly Bitcoin options trading volume reached US$53.8 billion, a decrease of 5.4%; the Ethereum options trading volume was US$15.5 billion, basically the same as last month.
This article is sourced from the internet: A mixed bag of good and bad news: 11 charts to interpret the crypto market in August
Original author: CryptoVizArt, UkuriaOC, Glassnode Original translation: Deng Tong, Golden Finance Summary Bitcoin has recorded its biggest drop of the current cycle, trading more than 26% below its all-time high. Still, the drop is historically low compared to past cycles. The price drop has caused a large amount of short-term holder supply to fall into unrealized losses, with more than 2.8 million BTC currently at a loss based on their on-chain acquisition price. While financial pressure on short-term holders has increased, the magnitude of locked-in losses is still relatively small compared to the size of the market. Price performance The 2023-2024 Bitcoin cycle is both similar and different from previous cycles. After the FTX crash, the market experienced about 18 months of steady price increases, followed by three months of…


