Crypto Market Sentiment Research Report (August 2–9, 2024): Has recession arrived? U.S. non-farm payrolls in July fell f
Recession has arrived? US non-farm payrolls in July fell far short of expectations
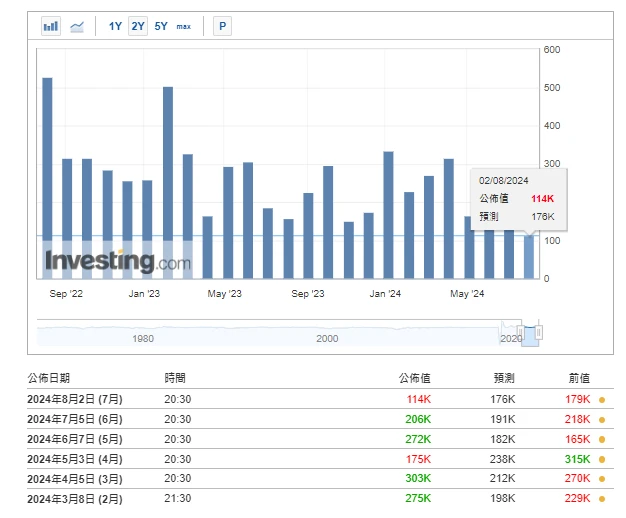
Image source: https://hk.investing.com/economic-calendar/nonfarm-payrolls-227
The US non-farm payrolls report for July surprised the market, with the number of new jobs hitting a three-and-a-half-year low and the unemployment rate rising to a three-year high, triggering the Sams Rule, a recession indicator with 100% accuracy. Panic spread rapidly, and traders began to bet on the possibility of a 50 basis point rate cut in September, and predicted that the rate cut this year would exceed 110 basis points. This week, both US stocks and Bitcoin rebounded after a significant decline.
-
The Sahm Rule is an indicator proposed by economist Claudia Sahm to predict economic recessions. The rule is based on changes in the unemployment rate and has a trigger condition: if the three-month moving average employment rate is 0.5 percentage points lower than the highest employment rate in the past 12 months, then the indicator is triggered, indicating that the economy may be about to or has entered a recession.
There are about 40 days until the next Federal Reserve interest rate meeting (September 19, 2024)
https://hk.investing.com/economic-calendar/interest-rate-decision-168
Market technical and sentiment environment analysis
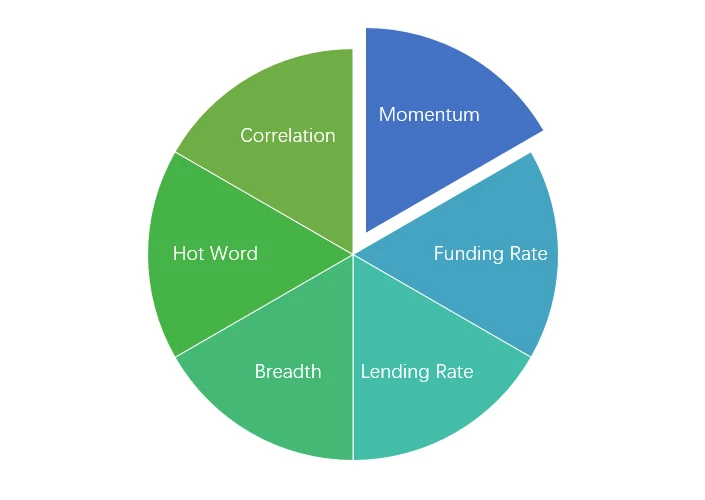
Sentiment Analysis Components
Technical indicators
Price Trends
BTC price fell -5.61% and ETH price fell -16.26% in the past week.
The above picture is the price chart of BTC in the past week.
The above picture is the price chart of ETH in the past week.
The table shows the price change rate over the past week.
Price Volume Distribution Chart (Support and Resistance)
In the past week, BTC and ETH fell to a low level and formed a new dense trading area before rebounding.
The above picture shows the distribution of BTCs dense trading areas in the past week.
The above picture shows the distribution of ETHs dense trading areas in the past week.
The table shows the weekly intensive trading range of BTC and ETH in the past week.
Volume and Open Interest
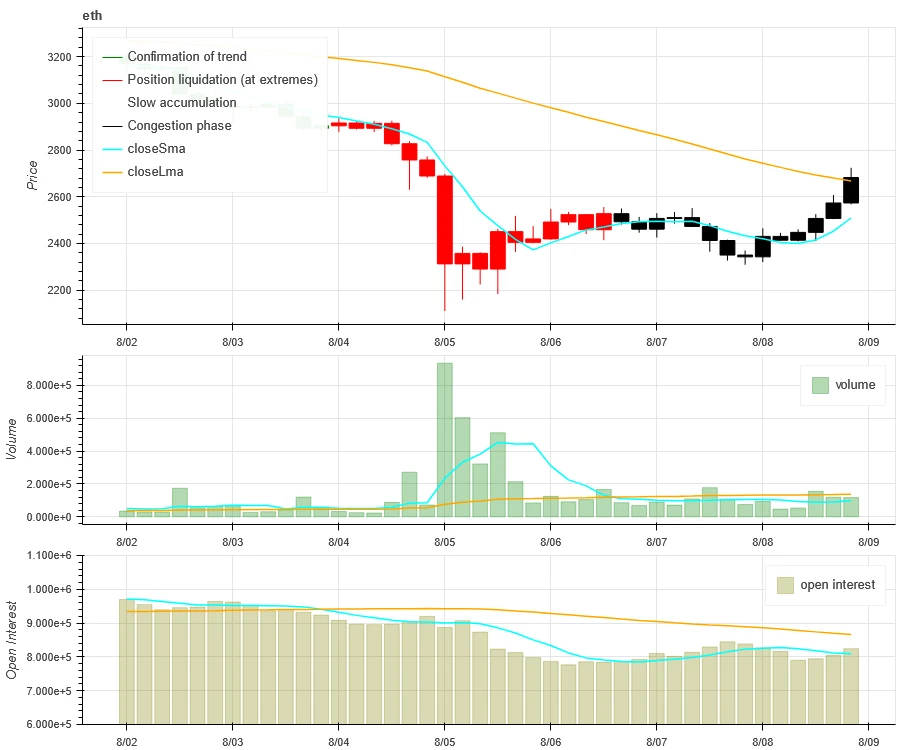
In the past week, both BTC and ETH had the largest trading volume when they fell to 8.5; the open interest of BTC and ETH both fell sharply.
The top of the above picture shows the price trend of BTC, the middle shows the trading volume, the bottom shows the open interest, the light blue is the 1-day average, and the orange is the 7-day average. The color of the K-line represents the current state, green means the price rise is supported by the trading volume, red means closing positions, yellow means slowly accumulating positions, and black means crowded state.
The top of the above picture shows the price trend of ETH, the middle is the trading volume, the bottom is the open interest, the light blue is the 1-day average, and the orange is the 7-day average. The color of the K-line represents the current state, green means the price rise is supported by the trading volume, red is closing positions, yellow is slowly accumulating positions, and black is crowded.
Historical Volatility vs. Implied Volatility
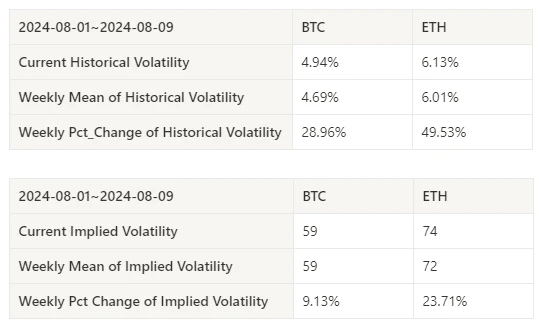
This past week, historical volatility for BTC and ETH was highest at 8.5, while implied volatility for both BTC and ETH increased.
The yellow line is the historical volatility, the blue line is the implied volatility, and the red dot is its 7-day average.
Event-driven
The non-farm data of the past week was significantly lower than expected, which pushed the mainstream currencies to continue to decline for several days after the data was released.
Sentiment Indicators
Momentum Sentiment
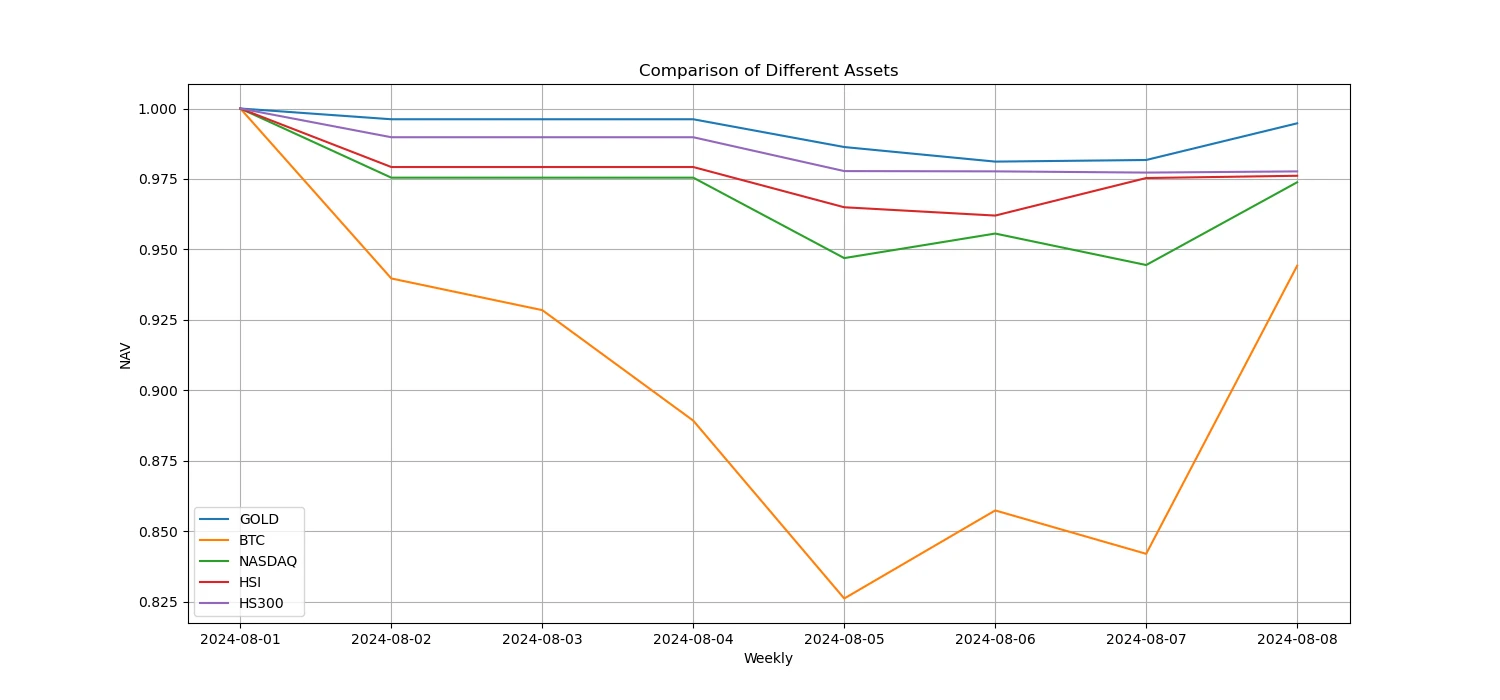
In the past week, among Bitcoin/Gold/Nasdaq/Hang Seng Index/SSE 300, gold was the strongest, while Bitcoin performed the worst.
The above picture shows the trend of different assets in the past week.
Lending Rate_Lending Sentiment
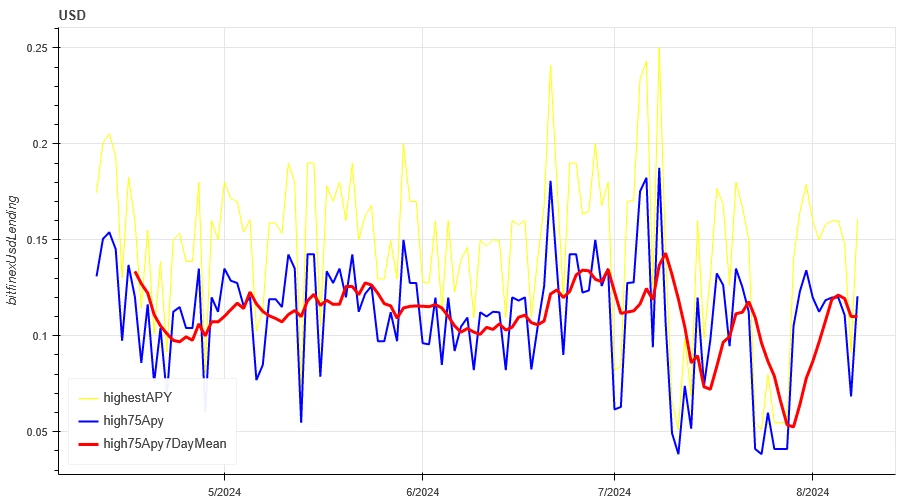
The average annualized return on USD lending over the past week was 11.1%, and short-term interest rates remained at 12.1%.
The yellow line is the highest price of USD interest rate, the blue line is 75% of the highest price, and the red line is the 7-day average of 75% of the highest price.
The table shows the average returns of USD interest rates for different holding days in the past
Funding Rate_Contract Leverage Sentiment
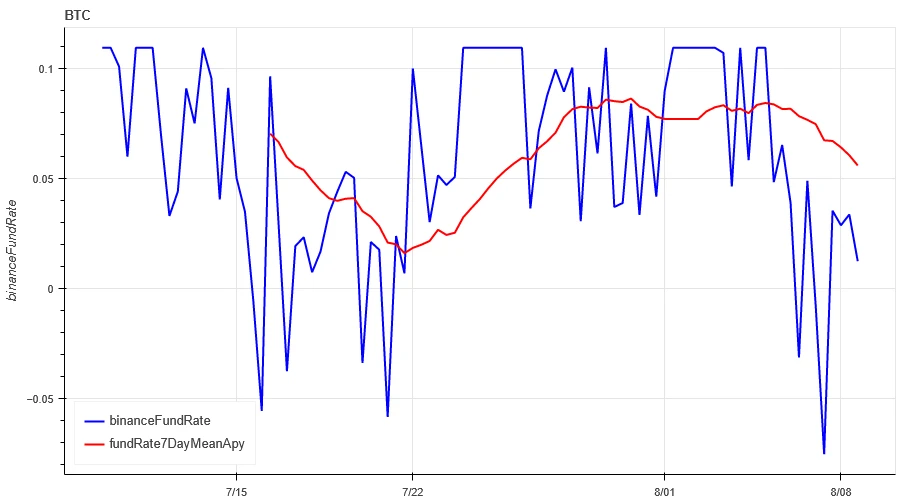
The average annualized return on BTC fees in the past week was 5.8%, and contract leverage sentiment was gradually declining.
The blue line is the funding rate of BTC on Binance, and the red line is its 7-day average
The table shows the average return of BTC fees for different holding days in the past.
Market Correlation_Consensus Sentiment
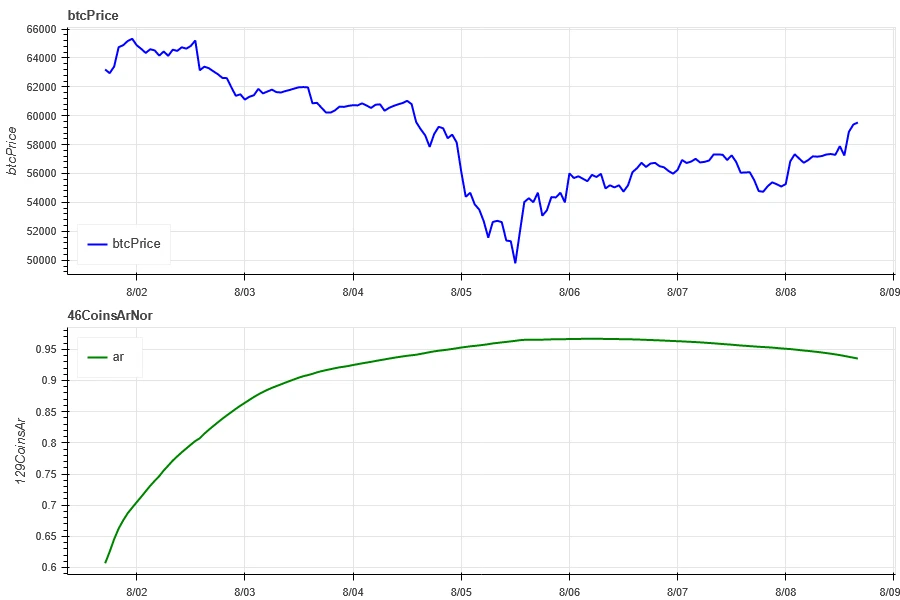
The correlation among the 129 coins selected in the past week was around 0.95, and the consistency between different varieties rose to a high level.
In the above picture, the blue line is the price of Bitcoin, and the green line is [1000 floki, 1000 lunc, 1000 pepe, 1000 shib, 100 0x ec, 1inch, aave, ada, agix, algo, ankr, ant, ape, apt, arb, ar, astr, atom, audio, avax, axs, bal, band, bat, bch, bigtime, blur, bnb, btc, celo, cfx, chz, ckb, comp, crv, cvx, cyber, dash, doge, dot, dydx, egld, enj, ens, eos,etc, eth, fet, fil, flow, ftm, fxs, gala, gmt, gmx, grt, hbar, hot, icp, icx , imx, inj, iost, iotx, jasmy, kava, klay, ksm, ldo, link, loom, lpt, lqty, lrc, ltc, luna 2, magic, mana, matic, meme, mina, mkr, near, neo, ocean, one, ont, op, pendle, qnt, qtum, rndr, rose, rune, rvn, sand, sei, sfp, skl, snx , sol, ssv, stg, storj, stx, sui, sushi, sxp, theta, tia, trx, t, uma, uni, vet, waves, wld, woo, xem, xlm, xmr, xrp, xtz, yfi, zec, zen, zil, zrx] overall correlation
Market Breadth_Overall Sentiment
Among the 129 coins selected in the past week, 6.3% of them were priced above the 30-day moving average, 12% were priced above the 30-day moving average relative to BTC, 9% were more than 20% away from the lowest price in the past 30 days, and 10% were less than 10% from the highest price in the past 30 days. The market breadth indicator in the past week showed that most coins in the overall market maintained a downward trend.
The picture above is [bnb, btc, sol, eth, 1000 floki, 1000 lunc, 1000 pepe, 1000 sats, 1000 shib, 100 0x ec, 1inch, aave, ada, agix, ai, algo, alt, ankr, ape, apt, arb, ar, astr, atom, avax, axs, bal, band, bat, bch, bigtime, blur, cake, celo, cfx, chz, ckb, comp, crv, cvx, cyber, dash, doge, dot, dydx, egld, enj, ens, eos,etc, fet, fil, flow, ftm, fxs, gala, gmt, gmx, grt, hbar, hot , icp, icx, idu, imx, inj, iost, iotx, jasmy, jto, jup, kava, klay, ksm, ldo, link, loom, lpt, lqty, lrc, ltc, luna 2, magic, mana, manta, mask, matic, meme, mina, mkr, near, neo, nfp, ocean, one, ont, op, ordi, pendle, pyth, qnt, qtum, rndr, robin, rose, rune, rvn, sand, sei, sfp, skl, snx, ssv, stg, storj, stx, sui, sushi, sxp, theta, tia, trx, t, uma, uni, vet, waves, wif, wld, woo,xai, xem, xlm, xmr, xrp, xtz, yfi, zec, zen, zil, zrx ] 30-day proportion of each width indicator
Summarize
In the past week, the prices of Bitcoin (BTC) and Ethereum (ETH) fell sharply on August 5, when the volatility and trading volume of these two cryptocurrencies reached a peak. The volume of open contracts decreased significantly, while the implied volatility increased simultaneously. Bitcoins funding rate continued to decline, which may reflect the weakening interest of market participants in its leveraged trading. Market breadth indicators show that the prices of most cryptocurrencies fell, and the entire market continued to be under pressure. In addition, the non-agricultural data was significantly lower than expected, which pushed the mainstream currencies to continue to decline for several days after the data was released.
Twitter: @ https://x.com/CTA_ChannelCmt
Website: channelcmt.com
This article is sourced from the internet: Crypto Market Sentiment Research Report (August 2–9, 2024): Has recession arrived? U.S. non-farm payrolls in July fell far short of expectations
Related: Must-read guide: Play with the TON ecosystem and seize early dividends
Original author: Biteye core contributor Viee Original editor: Biteye core contributor Crush Have you started to FOMO TON? These past two days, I have been crazy about posting black and white dog MEMEs and showing off my points. I thought the bull market was back. Today, Biteye will teach you how to play in the TON ecosystem and seize potential airdrop opportunities. We have organized this thread into a mind map, please take it if you need it. 01 Wallet Introduction The first step to participate in the TON ecosystem is to use a wallet. Currently, there are 49 wallets that support the TON chain. Here are two of the most popular ones: Wallet and TON Space Wallet Wallet is Telegrams native centralized custodian wallet, similar to WeChat Wallet, which…
