Crypto Market Sentiment Research Report (2024.07.19-07.26): Ethereum price fell by more than 7.5%, and ETHE capital outf
Ethereum price drops more than 7.5%, ETHE outflow surges
Data from Coinglass
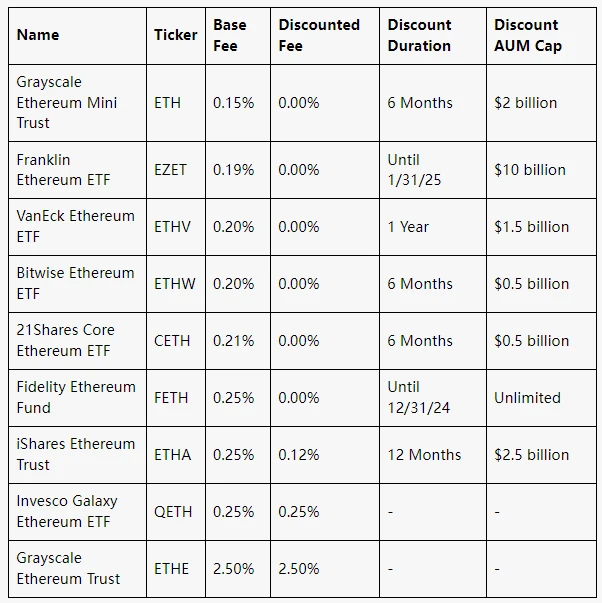
ETHE is Grayscales Ethereum trust ETF with a fee of 2.5%. The Ethereum spot ETF had an overall net outflow of $133 million on the second day of listing. The culprit was Grayscales ETHE, which caused the sharp drop in Ethereum this week, with ETH falling to as low as around $3,100.
For most investors, the decision comes down to fees. Eight of the nine ETFs have management fees between 0.15% and 0.25%. Grayscale Ethereum Mini Trust (ETH), a new fund created specifically for listing as an ETF, has a management fee of just 0.15%. These fees will be waived completely for the first six months after listing or until the funds assets under management (AUM) reaches $2 billion.
There are about 5 days until the next Fed meeting (2024.08.01)
https://hk.investing.com/economic-calendar/interest-rate-decision-168
Market technical and sentiment environment analysis
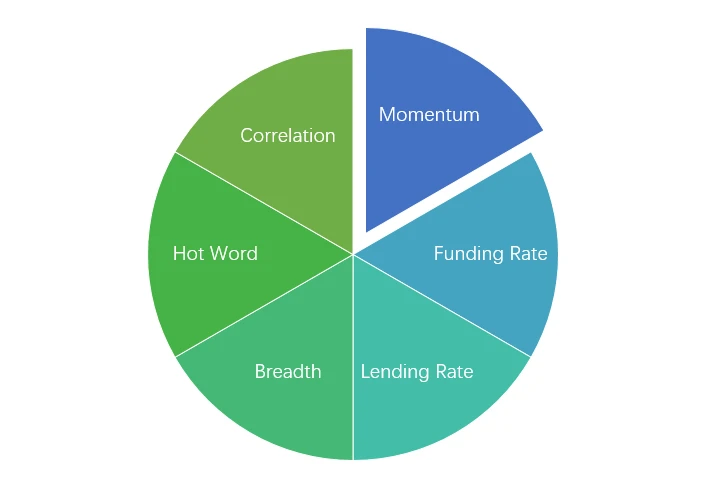
Sentiment Analysis Components
Technical indicators
Price trend
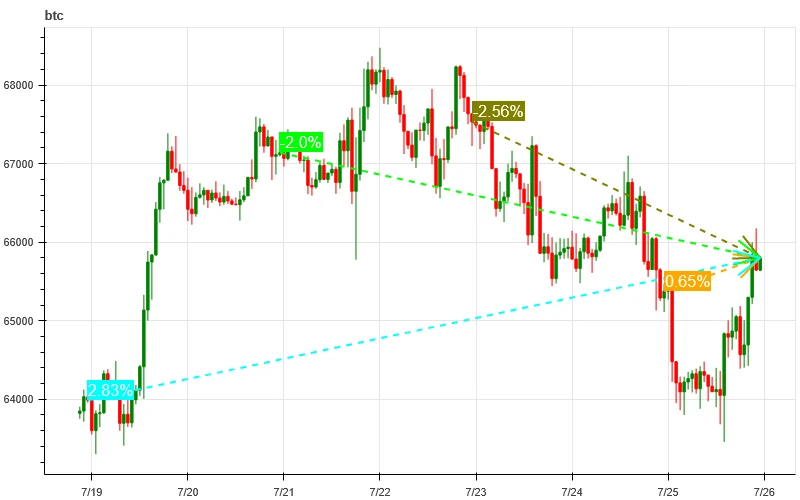
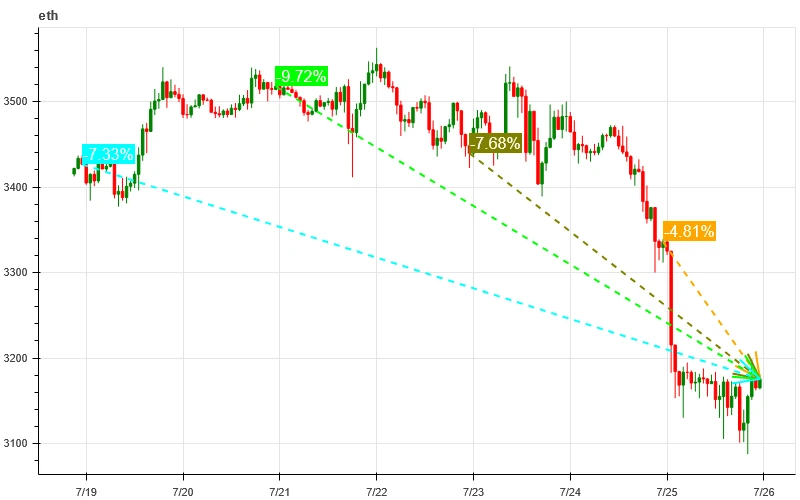
BTC price rose 2.83% in the past week, while ETH price fell -7.33%.
The above picture is the price chart of BTC in the past week.
The above picture is the price chart of ETH in the past week.
The table shows the price change rate over the past week.
Price Volume Distribution Chart (Support and Resistance)
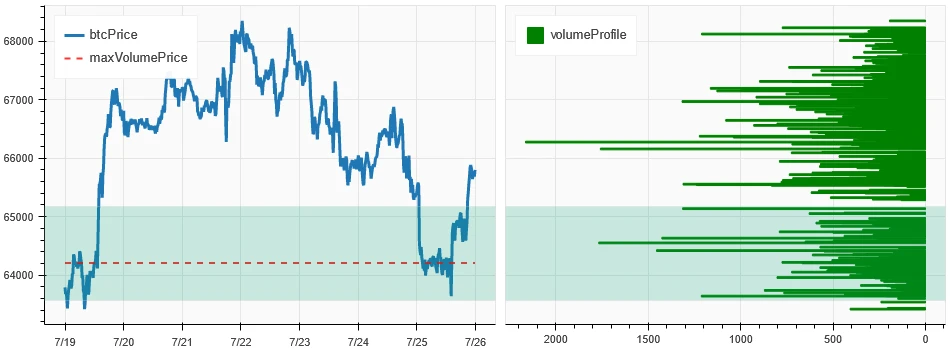
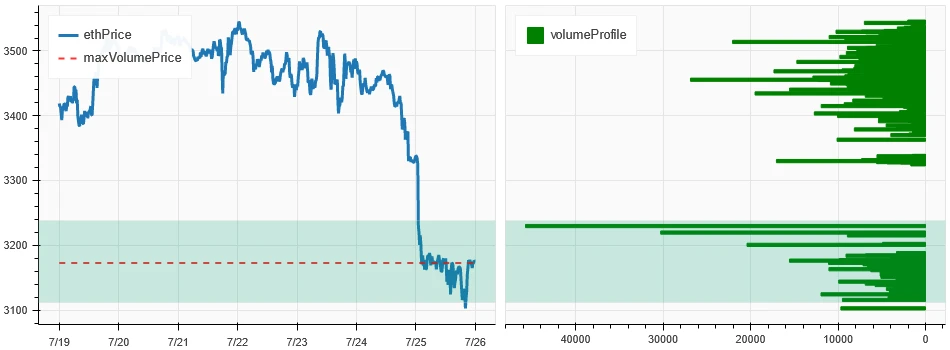
In the past week, BTC rose and then fell back into the concentrated trading area, while ETH fell and formed a new concentrated trading area at a low level.
The above picture shows the distribution of BTCs dense trading areas in the past week.
The above picture shows the distribution of ETHs dense trading areas in the past week.
The table shows the weekly intensive trading range of BTC and ETH in the past week.
Volume and Open Interest
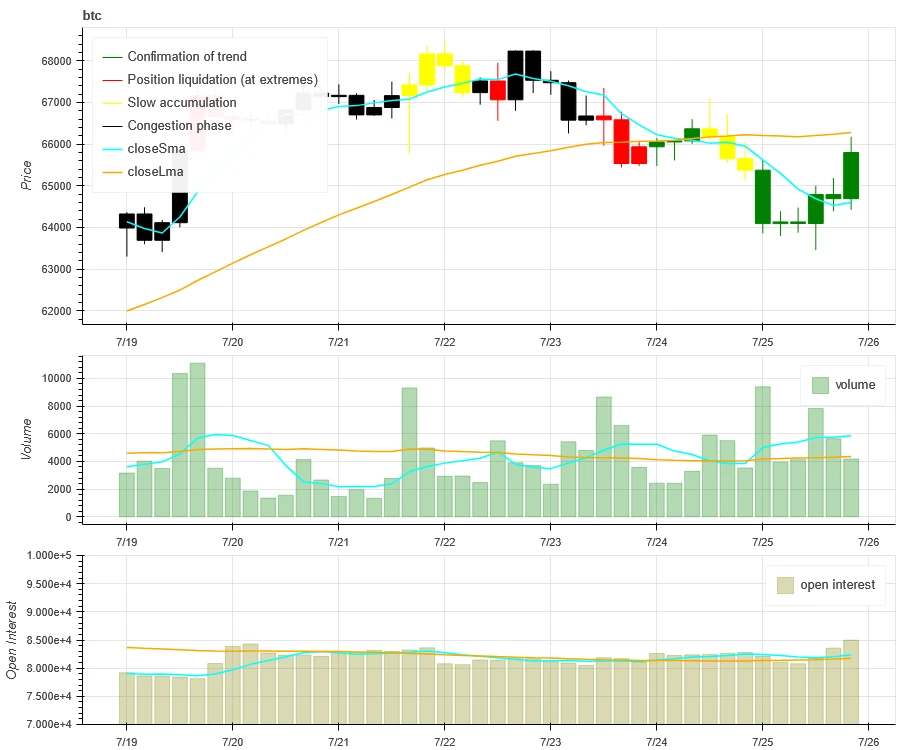
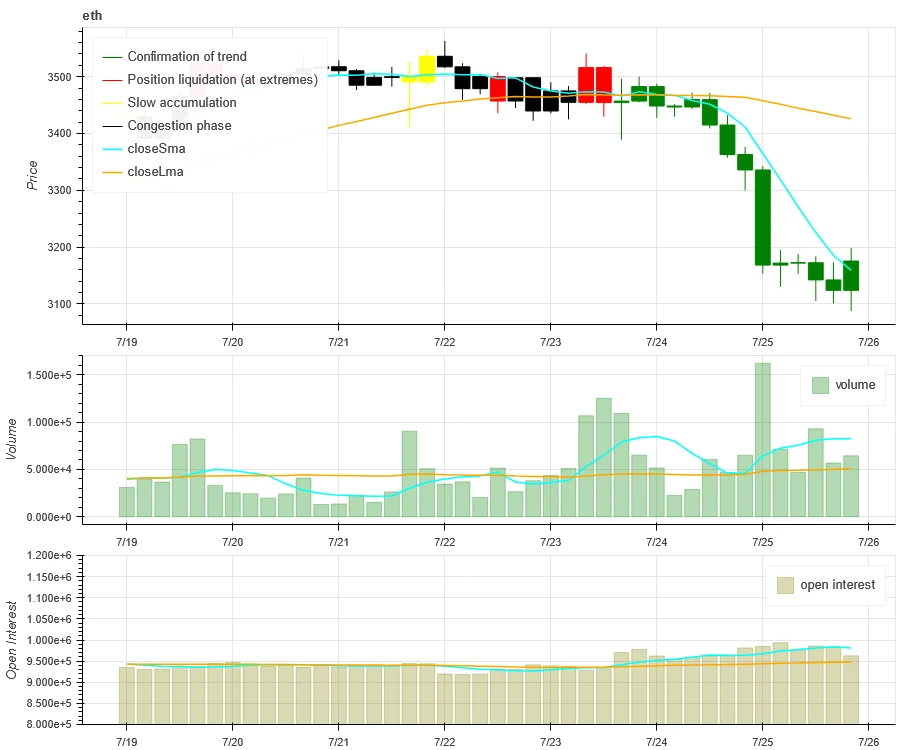
The biggest volume this past week was when BTC rose on July 19 and ETH fell on July 25; open interest rose for both BTC and ETH.
The top of the above picture shows the price trend of BTC, the middle shows the trading volume, the bottom shows the open interest, the light blue is the 1-day average, and the orange is the 7-day average. The color of the K-line represents the current state, green means the price rise is supported by the trading volume, red means closing positions, yellow means slowly accumulating positions, and black means crowded state.
The top of the above picture shows the price trend of ETH, the middle is the trading volume, the bottom is the open interest, the light blue is the 1-day average, and the orange is the 7-day average. The color of the K-line represents the current state, green means the price rise is supported by the trading volume, red is closing positions, yellow is slowly accumulating positions, and black is crowded.
Historical Volatility vs. Implied Volatility
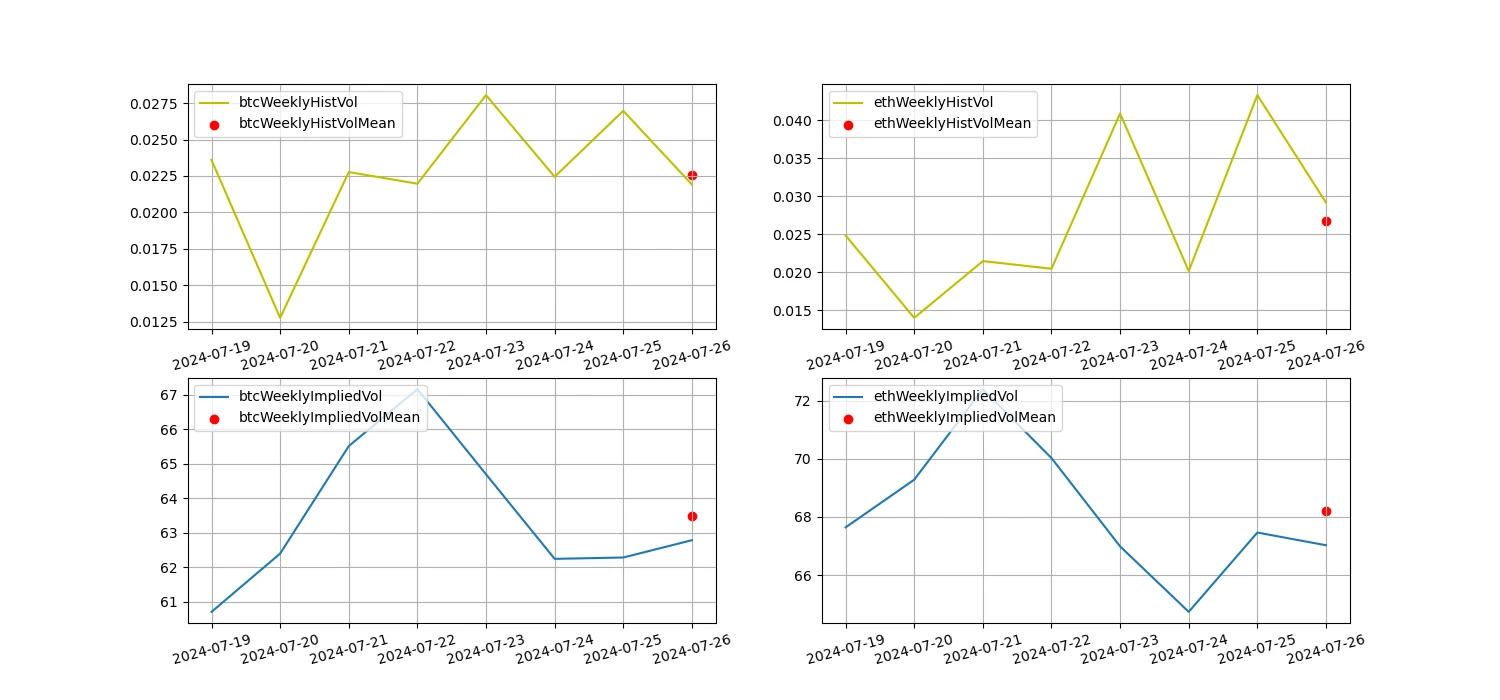
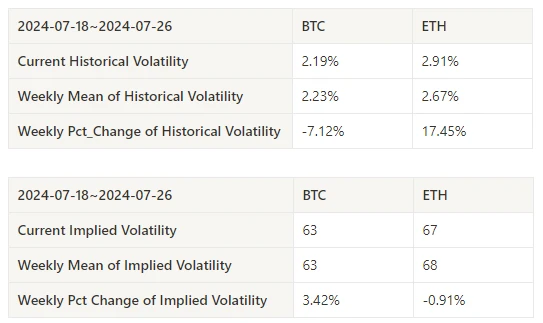
Historical volatility was highest this past week with BTC at 7.23 and ETH at 7.25; implied volatility was up with BTC and down with ETH.
The yellow line is the historical volatility, the blue line is the implied volatility, and the red dot is its 7-day average.
Event-driven
There were no major data releases in the past week.
Sentiment Indicators
Momentum Sentiment
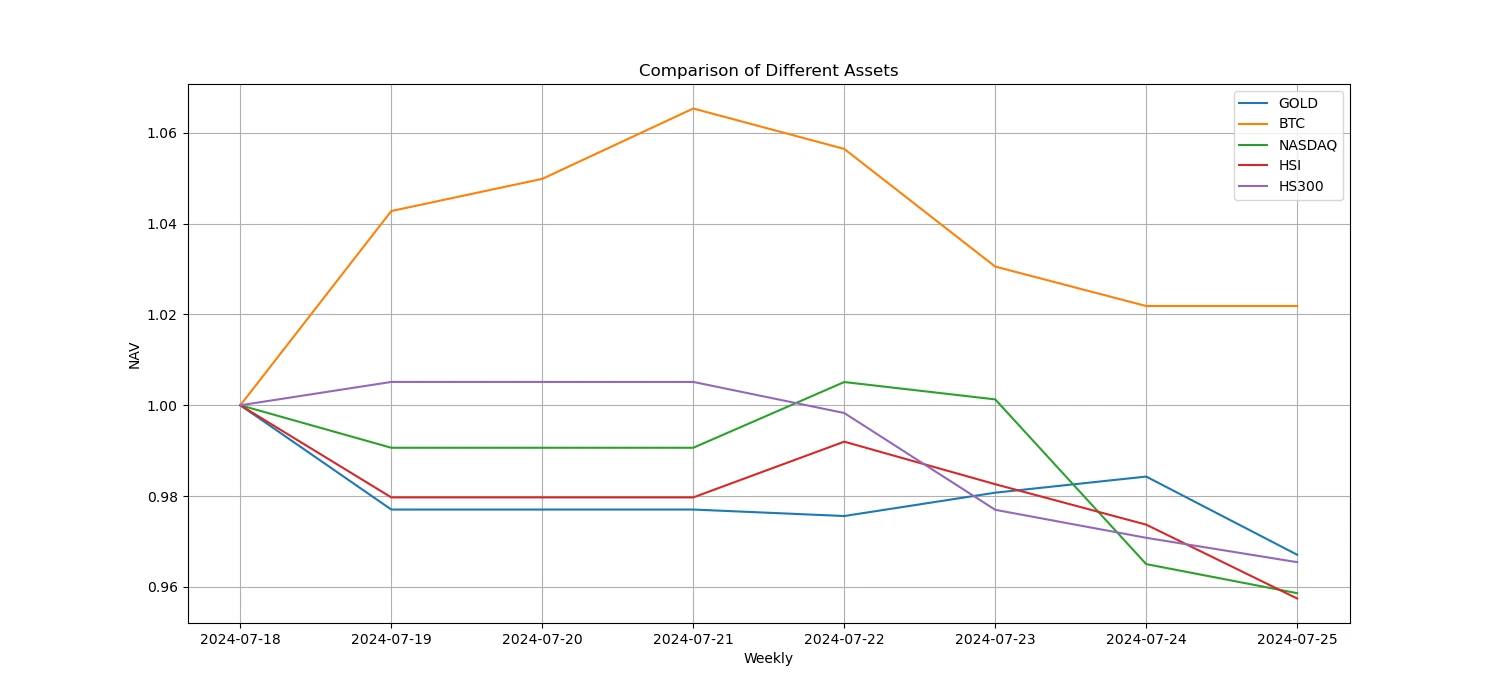
In the past week, among Bitcoin/Gold/Nasdaq/Hang Seng Index/CSI 300, Bitcoin was the strongest, while Hang Seng Index performed the worst.
The above picture shows the trend of different assets in the past week.
Lending Rate_Lending Sentiment
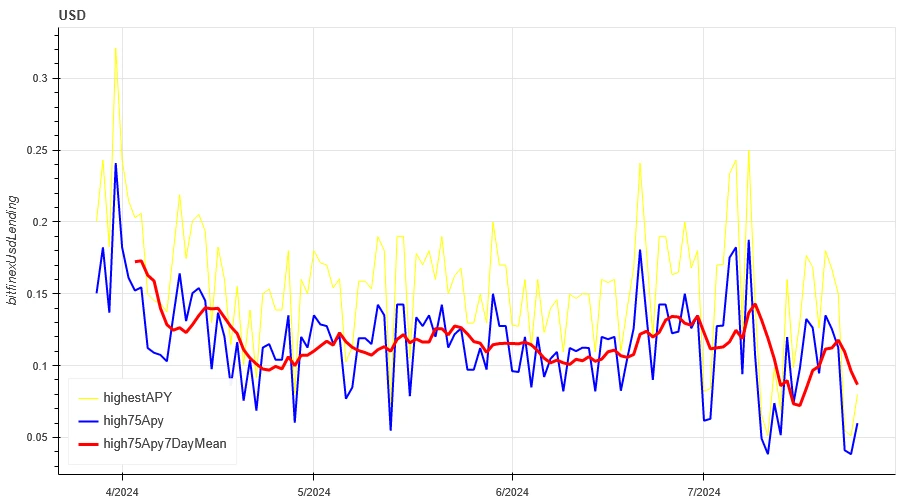
The average annualized return on USD lending over the past week was 9.2%, and short-term interest rates fell to 6%.
The yellow line is the highest price of USD interest rate, the blue line is 75% of the highest price, and the red line is the 7-day average of 75% of the highest price.
The table shows the average returns of USD interest rates at different holding days in the past
Funding Rate_Contract Leverage Sentiment
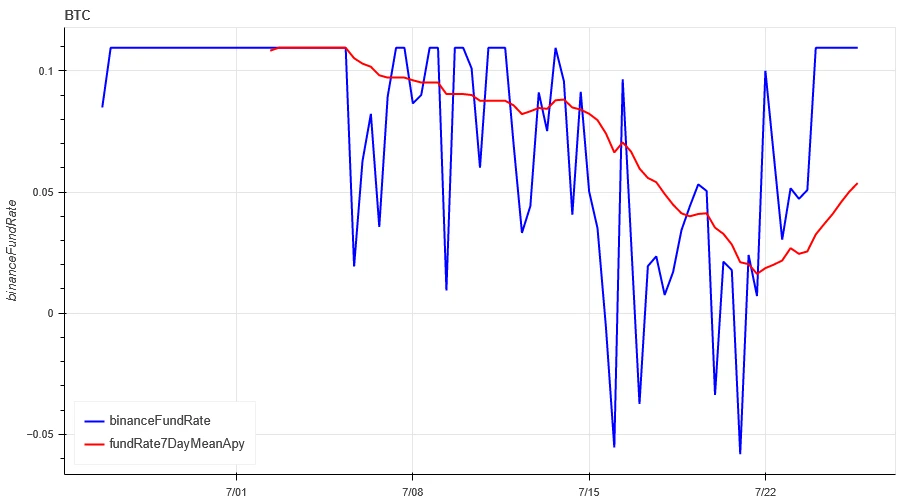
The average annualized return on BTC fees in the past week was 5.3%, and contract leverage sentiment rebounded from a low level.
The blue line is the funding rate of BTC on Binance, and the red line is its 7-day average
The table shows the average return of BTC fees for different holding days in the past.
Market Correlation_Consensus Sentiment
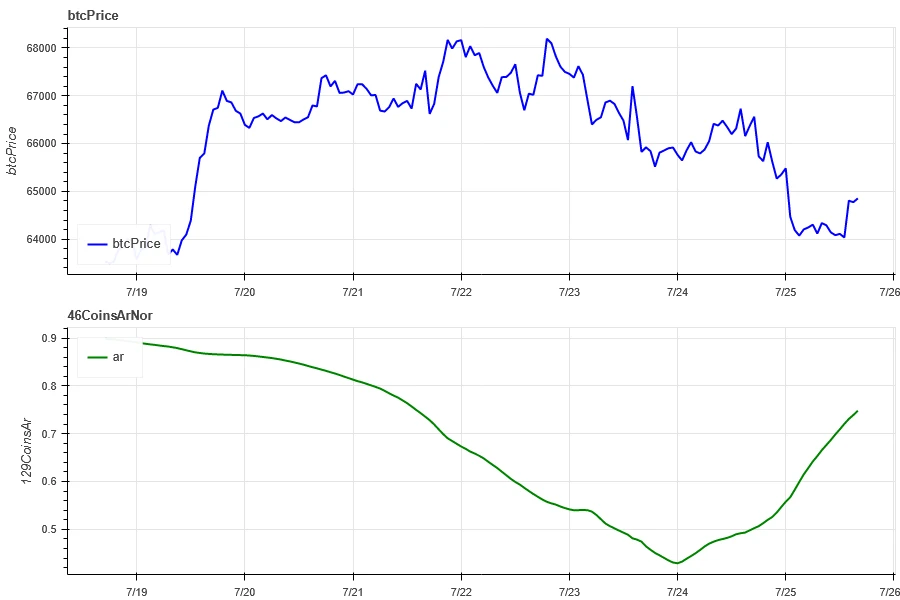
The correlation among the 129 coins selected in the past week was around 0.75, and the consistency between different varieties fell sharply and then rebounded.
In the above picture, the blue line is the price of Bitcoin, and the green line is [1000 floki, 1000 lunc, 1000 pepe, 1000 shib, 100 0x ec, 1inch, aave, ada, agix, algo, ankr, ant, ape, apt, arb, ar, astr, atom, audio, avax, axs, bal, band, bat, bch, bigtime, blur, bnb, btc, celo, cfx, chz, ckb, comp, crv, cvx, cyber, dash, doge, dot, dydx, egld, enj, ens, eos,etc, eth, fet, fil, flow, ftm, fxs, gala, gmt, gmx, grt, hbar, hot, icp, icx , imx, inj, iost, iotx, jasmy, kava, klay, ksm, ldo, link, loom, lpt, lqty, lrc, ltc, luna 2, magic, mana, matic, meme, mina, mkr, near, neo, ocean, one, ont, op, pendle, qnt, qtum, rndr, rose, rune, rvn, sand, sei, sfp, skl, snx , sol, ssv, stg, storj, stx, sui, sushi, sxp, theta, tia, trx, t, uma, uni, vet, waves, wld, woo, xem, xlm, xmr, xrp, xtz, yfi, zec, zen, zil, zrx] overall correlation
Market Breadth_Overall Sentiment
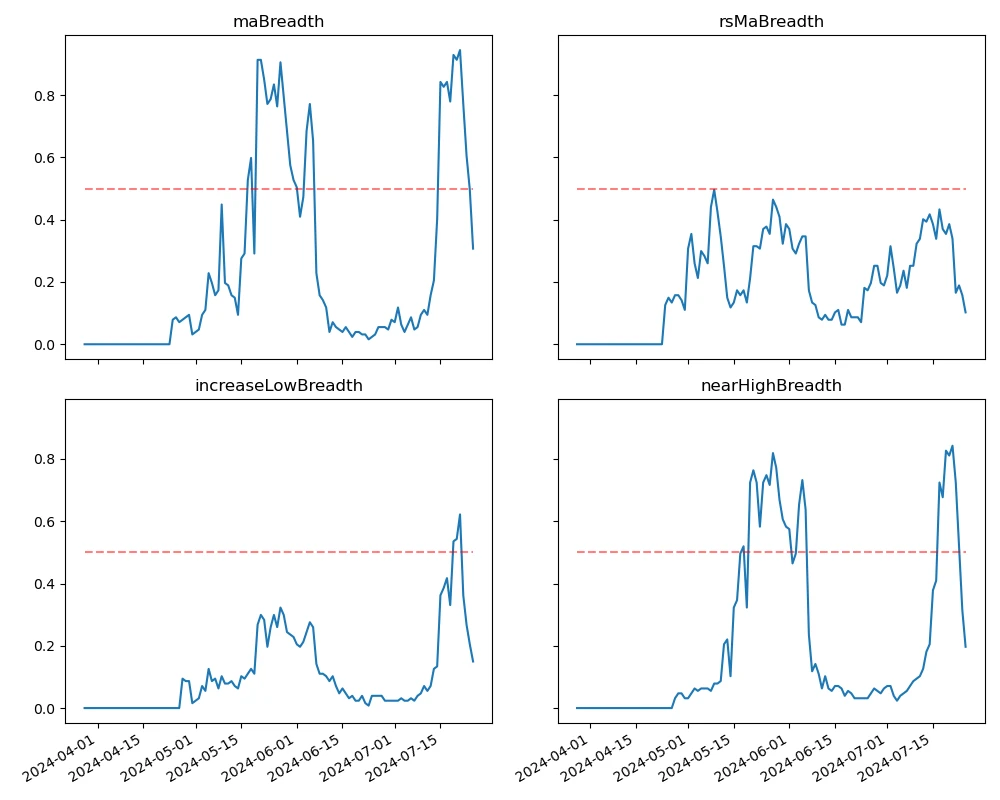
Among the 129 coins selected in the past week, 30% of the coins were priced above the 30-day moving average, 10% of the coins were priced above the 30-day moving average relative to BTC, 15% of the coins were more than 20% away from the lowest price in the past 30 days, and 20% of the coins were less than 10% away from the highest price in the past 30 days. The market breadth indicator in the past week showed that most coins in the overall market returned to a downward trend.
The picture above is [bnb, btc, sol, eth, 1000 floki, 1000 lunc, 1000 pepe, 1000 sats, 1000 shib, 100 0x ec, 1inch, aave, ada, agix, ai, algo, alt, ankr, ape, apt, arb, ar, astr, atom, avax, axs, bal, band, bat, bch, bigtime, blur, cake, celo, cfx, chz, ckb, comp, crv, cvx, cyber, dash, doge, dot, dydx, egld, enj, ens, eos,etc, fet, fil, flow, ftm, fxs, gala, gmt, gmx, grt, hbar, hot , icp, icx, idu, imx, inj, iost, iotx, jasmy, jto, jup, kava, klay, ksm, ldo, link, loom, lpt, lqty, lrc, ltc, luna 2, magic, mana, manta, mask, matic, meme, mina, mkr, near, neo, nfp, ocean, one, ont, op, ordi, pendle, pyth, qnt, qtum, rndr, robin, rose, rune, rvn, sand, sei, sfp, skl, snx, ssv, stg, storj, stx, sui, sushi, sxp, theta, tia, trx, t, uma, uni, vet, waves, wif, wld, woo,xai, xem, xlm, xmr, xrp, xtz, yfi, zec, zen, zil, zrx ] 30-day proportion of each width indicator
Summarize
In the past week, the market performance of Bitcoin and Ethereum was different. Bitcoin fluctuated widely within the range, with the trading volume reaching the highest point on July 19 when it rose, the open interest volume increased, the implied volatility increased, and the funding rate rebounded, indicating that market sentiment has warmed up. Ethereum, on the other hand, fell in price after the shock, mainly affected by the outflow of ETHE funds, with the trading volume reaching the highest point on July 25 when it fell, the open interest volume increased, and the implied volatility decreased. The market breadth indicator shows that most cryptocurrencies have returned to a downward trend, indicating that the entire market has been dominated by declines in the past week.
Twitter: @ https://x.com/CTA_ChannelCmt
Website: channelcmt.com
This article is sourced from the internet: Crypto Market Sentiment Research Report (2024.07.19-07.26): Ethereum price fell by more than 7.5%, and ETHE capital outflow surged
Related: After zkSync, what other potential airdrop projects are worth paying attention to?
Original author: zuc l1 ck , crypto KOL Original translation: Felix, PANews After the zkSync airdrop incident, airdrops for first-tier projects seem to have lost their meaning. This is a new era. Second-tier projects have low airdrop costs, fast airdrops, and strong scalability. Crypto KOL zuc l1 ck counted the airdrop data received by individuals. The data proves that the second- and third-tier projects bring the most benefits, and there is no large amount of money invested in these projects. The following are potential airdrop projects worth paying attention to this year. Berachain Berachain is an Ethereum Virtual Machine (EVM) compatible L1 built on Cosmos SDK. The following is an interactive guide: Add Berachain Artio to your wallet: https://chainlist.org/chain/80085 Connect your wallet Add Berachain Artio to Metamask Approve and switch…

