My XP
0
Login
Original author: Charles Yu
Original translation: Luffy, Foresight News
The Bitcoin spot ETF (launched on January 11, 2024) has received a total net inflow of US$15.1 billion as of June 15, 2024.
Nine issuers are working on launching 10 Ethereum spot ETFs in the United States.
The U.S. Securities and Exchange Commission (SEC) approved all 19 b-4 filings on May 23, and the ETFs are expected to begin trading in July 2024.
As with the Bitcoin ETF, we believe the primary source of net inflows is independent investment advisors, or investment advisors affiliated with banks or broker/dealers.
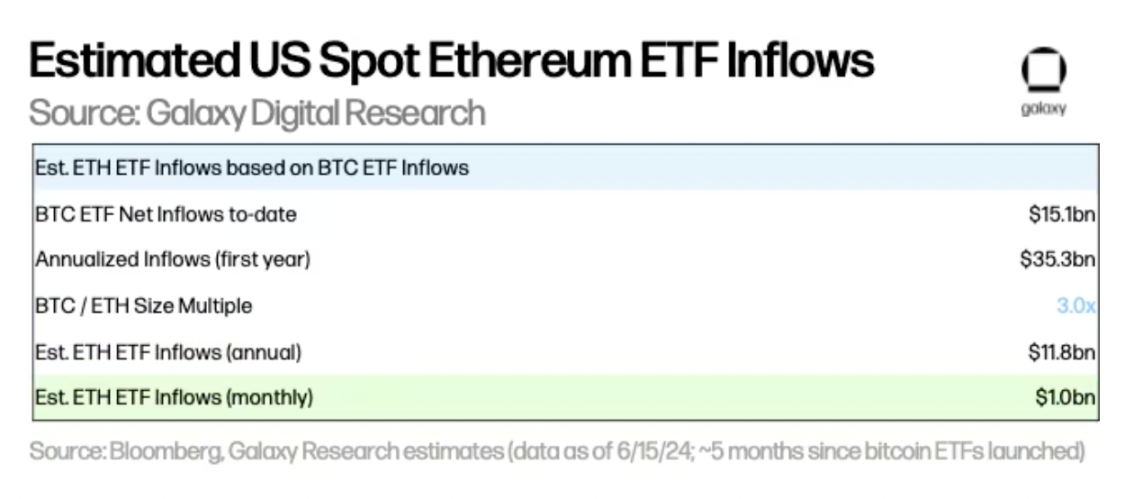
We expect Ethereum ETF net inflows in the first five months to account for 20-50% of Bitcoin ETF net inflows in the same period. Our estimated target is 30%, which means a monthly net inflow of US$1 billion.
Overall, we believe ETHUSD is more price sensitive to ETF inflows than BTC, as a large portion of ETH’s total supply is locked in staking, cross-chain bridges, and smart contracts, while a smaller amount is held on centralized exchanges.
For months, observers and analysts have been underestimating the chances of the U.S. Securities and Exchange Commission (SEC) approving a spot Ethereum exchange-traded product (ETP). Pessimism stems from the SEC’s reluctance to explicitly acknowledge ETH as a commodity, the lack of news of engagement between the SEC and potential issuers, and the SEC’s ongoing investigations and enforcement actions related to the Ethereum ecosystem. Bloomberg analysts Eric Balchunas and James Seyffart had estimated the chances of approval in May at 25%. However, on Monday, May 20, Bloomberg analysts suddenly raised the odds of approval to 75% following reports that the SEC had contacted stock exchanges.
In fact, later that week, all of the spot Ethereum ETP filings were approved by the SEC. We look forward to the actual launch of these instruments after the S-1 filing becomes effective (which we expect to happen sometime in the summer of 2024). This report will use the performance of the Bitcoin spot ETP to forecast demand for Ethereum ETPs once they launch. We estimate that Ethereum spot ETPs will achieve net inflows of approximately $5 billion in the first five months of trading (approximately 30% of Bitcoin ETP net inflows).
There are currently 9 issuers competing to launch 10 exchange-traded products (ETPs) for spot ETH. In the past few weeks, some issuers have withdrawn. ARK chose not to launch an Ethereum ETP in partnership with 21 Shares, while Valkyrie, Hashdex, and WisdomTree have withdrawn their applications. The following chart shows the current status of applicants sorted by 19 b-4 application date:

Grayscale is looking to convert the Grayscale Ethereum Trust (ETHE) into an ETP, just as the company did with its Grayscale Bitcoin Investment Trust (GBTC), but Grayscale has also applied for a “mini” version of the Ethereum ETP.
On May 23, the SEC approved all 19 b-4 filings (the rule changes that allow stock exchanges to eventually list ETH spot ETPs), but now each issuer needs to go back and forth with the regulator about its registration statement. Until the SEC allows these S-1 filings (or S-3 filings in the case of ETHE) to go into effect, the products themselves can’t actually begin trading. Based on our research, as well as Bloomberg’s reporting, we think Ethereum spot ETPs could begin trading as early as the week of July 11, 2024.
The Bitcoin ETF has been launched for nearly 6 months and can be used as a benchmark to predict the popularity of the Ethereum spot ETF.
Source: Bloomberg
Here are some observations from the first few months of trading in the Bitcoin spot ETP:
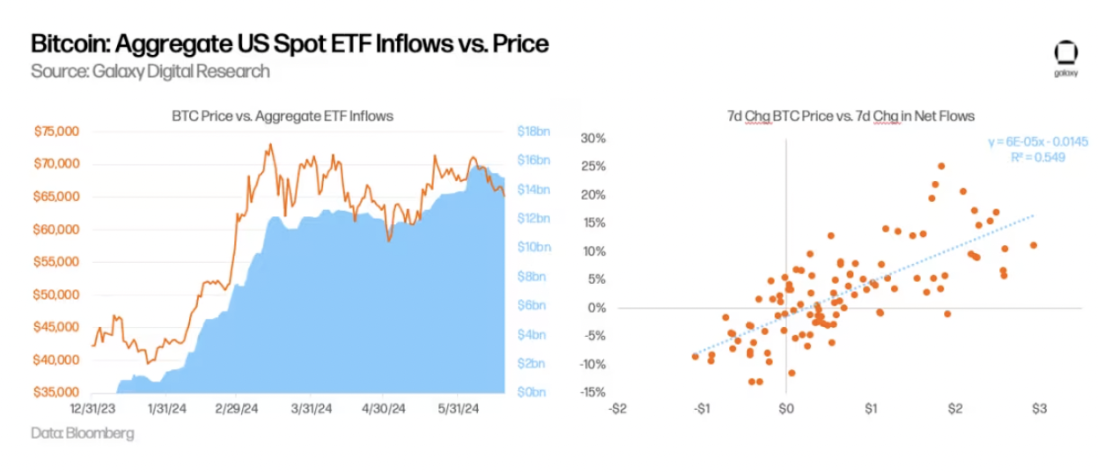
So far, inflows have been on an upward trend. As of June 15, U.S. spot Bitcoin ETFs have accumulated more than $15 billion in net inflows since their launch, with an average net inflow of $136 million per trading day. The total amount of BTC held by these ETFs is about 870,000 BTC, accounting for 4.4% of the current BTC supply. BTC is trading at about $66,000, and the total AUM of all U.S. spot ETFs is about $58 billion (Note: GBTC held about 619,000 BTC before the launch of the ETF).
ETF inflows are partly responsible for the rise in BTC prices. By regressing the 1-week change in BTC price and ETF net inflows, we calculated an r-sq of 0.55, indicating that the two variables are highly correlated. Interestingly, we also found that price changes are a leading indicator of inflows, but not the other way around.
GBTC has been a major concern for the overall flow of the ETF. Since converting the trust to an ETF, GBTC has experienced significant outflows in the first few months. GBTC daily outflows peaked in mid-March, with an outflow of $642 million on March 18, 2024. Outflows have since eased, and GBTC has even seen a few days of positive net inflows starting in May. As of June 15, the balance of BTC held by GBTC has dropped from 619,000 to 278,000 since the launch of the ETF.
ETF demand is mainly driven by retail investors, and institutional demand is picking up. 13 F filings show that as of March 31, 2024, more than 900 US investment companies hold Bitcoin ETFs, holding approximately $11 billion worth of holdings, accounting for approximately 20% of total Bitcoin ETF holdings, indicating that most of the demand is driven by retail investors. The list of institutional buyers includes major banks (e.g., JPMorgan Chase, Morgan Stanley, Wells Fargo), hedge funds (e.g., Millennium, Point 72, Citadel) and even pension funds (e.g., Wisconsin Investment Board).
Wealth management platforms have not yet started buying Bitcoin ETFs for clients. The largest wealth management platforms have not yet allowed their brokers to recommend Bitcoin ETFs, though Morgan Stanley is reportedly exploring letting its brokers solicit clients to buy. We wrote in our report, “Market Size for Bitcoin ETFs,” that it may be years before wealth management platforms (including broker-dealers, banks, and RIAs) help clients buy Bitcoin ETFs. So far, inflows from wealth management platforms have been minimal, but we believe it will be a significant catalyst for Bitcoin adoption in the near to medium term.
GBTC daily flow after ETF approval (USD)
Referring to the situation of Bitcoin ETP, we can roughly estimate the markets potential demand for Ethereum ETP.

Relative size of BTC and ETH ETP markets
To estimate the potential inflows into an Ethereum ETF, we applied a BTC/ETH multiple to US Bitcoin spot ETF inflows based on the relative asset sizes of multiple markets where BTC and ETH trade. As of May 31:
BTCs market capitalization is 2.9 times that of ETH.
Across all exchanges, BTC’s futures market is roughly twice as large as ETH’s based on open interest levels and trading volume. Specifically on CME, BTC’s open interest is 8.4 times that of ETH, while BTC’s daily trading volume is 4.2 times that of ETH.
The AUM of various existing funds (broken down by Grayscale Trust, futures, spot, and selected global markets) shows that BTC funds are 2.6x-5.3x the size of ETH funds.
Based on the above, we believe that the inflow of Ethereum spot ETF will be about 1/3 of the inflow of Bitcoin spot ETF (estimated range 20%-50%).
Applying this data to the $15 billion in Bitcoin spot ETF inflows prior to June 15th implies monthly inflows of around $1 billion in the first five months after the Ethereum ETF launched (estimated range: $600 million to $1.5 billion per month).
US Spot Ethereum ETF Inflow Estimation
We are seeing some valuations below our forecasts due to several factors. That being said, our previous report forecasted first-year Bitcoin ETF inflows of $14 billion, assuming the entry of wealth management platforms, but Bitcoin ETFs have seen significant inflows before these platforms entered. Therefore, we recommend caution when predicting low demand for Ethereum ETFs.
Several structural/market differences between BTC and ETH will impact ETF flows:
Due to the lack of staking rewards, demand for spot Ethereum ETFs may be affected. Unstaked ETH has the opportunity cost of forgoing (i) inflation rewards paid to validators, (ii) priority fees paid to validators, and MEV income paid to validators via relayers. Based on data from September 15, 2022 to June 15, 2024, we estimate the annualized opportunity cost of forgoing staking rewards to be 5.6% for spot ETH holders (4.4% using year-to-date data), which is a significant difference. This would make spot Ethereum ETFs less attractive to potential buyers. Note that ETPs offered in other locations outside the United States (such as Canada) provide holders with additional yield through staking.
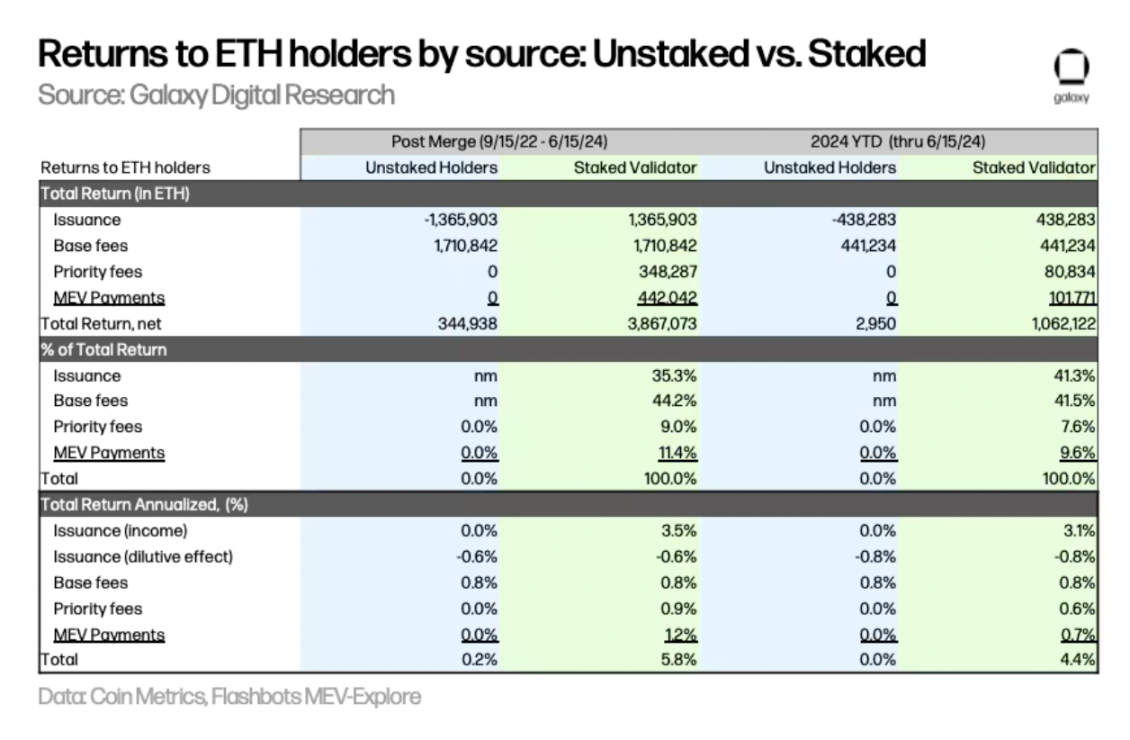
Sources of income for unstaked and staked ETH holders
Grayscale’s ETHE could be a drag on Ethereum ETF inflows. Just as the GBTC Grayscale Trust experienced significant outflows in its ETF conversion, the ETHE Grayscale Trust conversion to an ETF will also result in outflows. Assuming ETHE’s outflow rate matches that of GBTC in the first 150 days (i.e., 54.2% of the trust supply is withdrawn), we estimate that ETHE’s outflows will be approximately 319,000 ETH per month, which at the current price of $3,400 would amount to $1.1 billion per month or $36 million per day. Note that the percentage of tokens held by these trusts as a percentage of their respective total supply is: BTC 3.2% and ETH 2.4%. This suggests that the ETHE ETF conversion will put less pressure on ETH prices than GBTC. Additionally, unlike GBTC, ETHE will not face forced sales due to bankruptcy cases (such as 3AC or Genesis), further supporting the view that ETH will experience relatively less selling pressure associated with the Grayscale Trust than BTC.
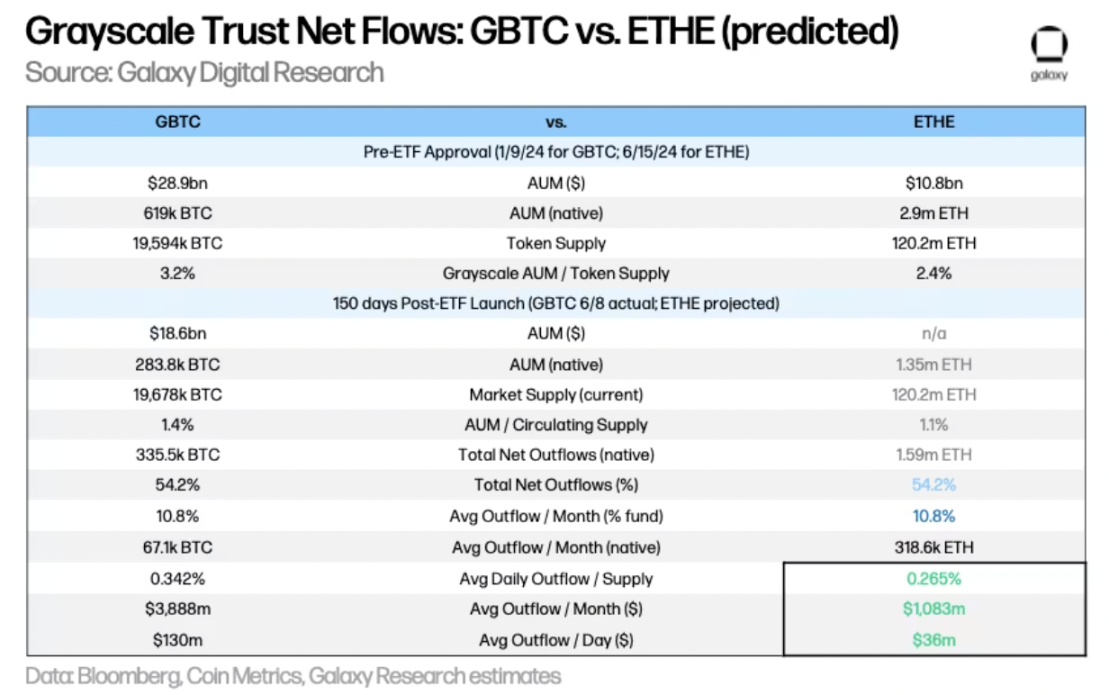
GBTC and ETHE (forecasted) net flows
Basis trading may have driven demand for Bitcoin ETFs from hedge funds. Basis trading may have driven demand for Bitcoin ETFs from hedge funds that want to arbitrage the difference between Bitcoin spot and futures prices. As mentioned earlier, 13 F filings show that as of March 31, 2024, more than 900 US investment firms held Bitcoin ETFs, including some well-known hedge funds such as Millennium and Schonfeld. Throughout 2024, ETHs funding rate on exchanges averaged higher than BTC, indicating that (i) there is relatively large demand for long ETH and (ii) a spot Ethereum ETF may bring more demand from hedge funds that take advantage of basis trading.
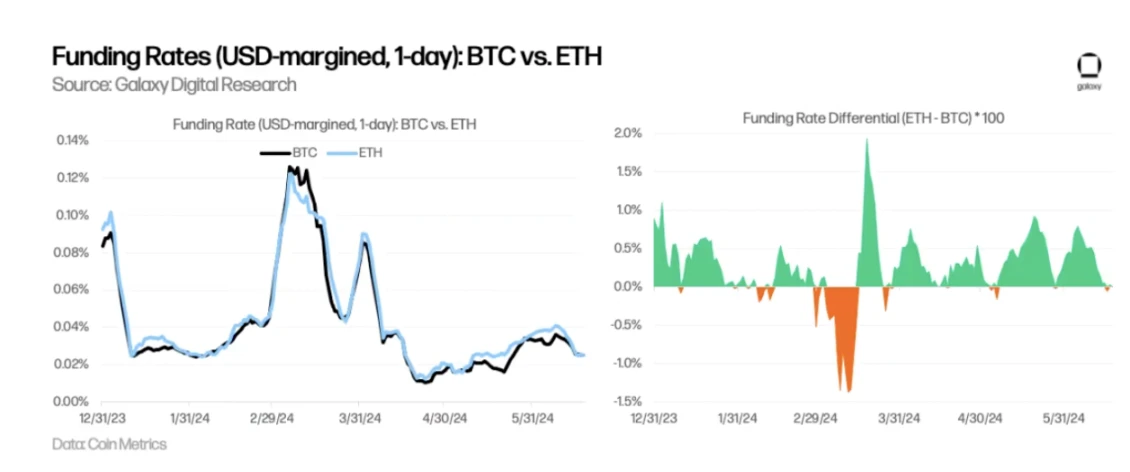
Funding rates for BTC and ETH
Since our estimated ratio of Ethereum ETF inflows to market cap is roughly equal to the ratio of Bitcoin flows to market cap, we would expect the price impact to be roughly the same, all else being equal. However, there are several key differences in the supply and demand of the two assets that could make Ethereum price more sensitive to ETF flows:

BTC and ETH market supply differences
Supply Held on Exchanges: Currently, a larger percentage of BTC supply is held on exchanges than ETH (11.7% vs. 10.3%), suggesting that ETH supply may be tighter and, assuming inflows are proportional to market cap, ETH price sensitivity would be higher (note: this metric relies heavily on exchange address attribution and can vary widely between different data providers).
Inflation and Destruction: Following the latest halving on April 20, 2024, BTC has an annual inflation rate of about 0.8%. After the Ethereum merger, ETH has experienced net negative issuance (-0.19% annualized) as new issuance paid to stakers (+0.63%) has been offset by base fees destroyed (-0.83%). In the past month, ETH base fees have been relatively low (-0.34% annualized) and have failed to offset new issuance (+0.76% annualized), resulting in a net positive annualized inflation rate of +0.42%.
Supply held by ETFs: Since launch, the net amount of BTC entering US spot ETFs (excluding the starting balance of GBTC) has totaled 251,000 BTC, or 1.3% of the current supply. If calculated on a one-year basis, the ETF will absorb 583,000 BTC, or 3.0% of the current BTC supply, which will far exceed the dilution caused by miner rewards (0.81% inflation rate).
However, the actual market liquidity available for purchase is much lower than the reported current supply. We believe that a better representation of the available market supply for each asset in the ETF would include adjustments for factors such as staked supply, dormant/lost, and supply held in cross-chain bridges and smart contracts:
Calculation of BTC and ETH adjusted supply
Staked Supply (Discount: 30%): Staked supply reduces the amount of tokens available for ETF purchases. Currently, Bitcoin does not have a staking feature. Ethereum requires ETH to be staked to secure the network, but stakers can unstake some of the ETH to use elsewhere. Currently, the amount of staked ETH accounts for about 27% of ETHs current supply. We use a 30% discount to estimate the available market supply, resulting in an 8.2% supply discount.
Dormant/Lost Supply (Discount: 50%): A portion of BTC and ETH is considered unrecoverable (e.g., lost keys, shipwrecks), so the available supply is reduced. We calculate the dormant/lost supply using Bitcoin addresses that have been dormant for more than 10 years and Ethereum addresses that have been dormant for more than 7 years, which accounts for 16.6% and 6.7% of the current supply of BTC and ETH, respectively. We apply a 50% discount rate to this balance, as the supply held in some of these assumed dormant addresses could come back online at any time.
Supply in bridges and smart contracts (discount: 25%): This is the supply locked in bridges and contracts for production purposes. For Bitcoin, the BTC balance held by BitGo for wrapped BTC (wBTC) is ~153k BTC, and we estimate that roughly the same amount is locked in other bridges, totaling ~1.6% of BTC supply. ETH locked in smart contracts accounts for 11.4% of current supply. We apply a lower discount to this balance than to the staked supply, i.e. 25%, because we assume that this supply is more liquid than the staked supply (i.e., likely not subject to the same lock-up requirements and withdrawal queues).
Applying discount weights to each factor to calculate the adjusted supply of BTC and ETH, we estimate that the available supply of BTC and ETH is 8.7% and 14.4% less than the reported current supply, respectively.
Overall, ETH should have higher price sensitivity to relative market cap weighted inflows than BTC due to: (i) lower available market supply based on adjusted supply factors, (ii) a lower percentage of supply on exchanges, and (iii) lower inflation. Each of these factors should have a multiplicative (rather than additive) effect on price sensitivity, with prices tending to be more sensitive to larger changes in market supply and liquidity.
Looking ahead, we face several issues in terms of adoption and second-order effects:
How should allocators think about BTC and ETH? Will existing holders migrate from the Bitcoin ETF to ETH? For allocators, some rebalancing is expected. Will the spot Ethereum ETF attract new buyers who havent bought BTC yet? What will the mix of potential buyers be? Will they hold only BTC, only ETH, or both?
When will the staking feature be added? Does the absence of staking rewards have an impact on the adoption of spot Ethereum ETFs? Will investment demand for DeFi, tokenization, NFTs, and other crypto-related applications drive further adoption of Ethereum ETFs?
What potential impact does this have on other altcoins? Are we more likely to see other altcoin ETFs approved after Ethereum?
Overall, we believe that the launch of a spot Ethereum ETF will have a large positive impact on the adoption of Ethereum and the broader cryptocurrency market for two main reasons: (i) it expands the reach of cryptocurrencies and (ii) it provides greater recognition for cryptocurrencies through formal recognition by regulators and trusted financial services brands. ETFs can expand the reach of retail and institutional investors, provide wider distribution through more investment channels, and can support the use of Ethereum in portfolios for more investment strategies. In addition, greater understanding of Ethereum by financial professionals will accelerate its investment and adoption.
This article is sourced from the internet: Galaxy: Using Bitcoin as an example, exploring the market size of Ethereum ETFs
Today, Bitlayer announced that the first Dapp ranking competition will be officially launched on May 23, issuing $20 million worth of token airdrops to projects deployed on the Bitlayer mainnet. All rewards will be distributed according to the Bitlayer ecosystem contribution. Projects can choose to distribute all airdrop rewards to users. This ranking competition is part of the Bitlayer 50 million USD token developer incentive airdrop program, Ready Player One. After this competition, the remaining token rewards will be distributed through subsequent ranking competitions and the Bitlayer Most Valuable Player (MVP) program. Dapp ranking competition time planning There are two phases of Dapp ranking competition, the specific schedule is as follows: Epoch 1: 4 weeks, May 23 – June 23 Epoch 2: 8 weeks, expected to be from June to…


