On-chain behavior analysis: How far could BTC fall in extreme cases?
Original author: Murphy, crypto KOL (X: @Murphychen 888)
Based on the on-chain behavior analysis, to what extent might BTC fall in the bull market under extreme circumstances?
The overall logic is to evaluate from two aspects based on on-chain behavior analysis and historical data.
Method 1: From the perspective of STH-MVRV (short-term holders)
Short-term holders are important participants in the bull-bear transition, so the performance of STH-MVRV has extremely important reference value in the bull market cycle. I have used 2 tweets to explain its principles and functions in detail. New friends can refer to the following link, and I will not repeat it here.
For a detailed explanation of the role of STH-MVRV in the bull market, please refer to the following link: https://x.com/Murphychen888/status/1780825849962590374
For the important historical performance of STH-MVRV, please refer to the following link: https://x.com/Murphychen888/status/1781342103639130544
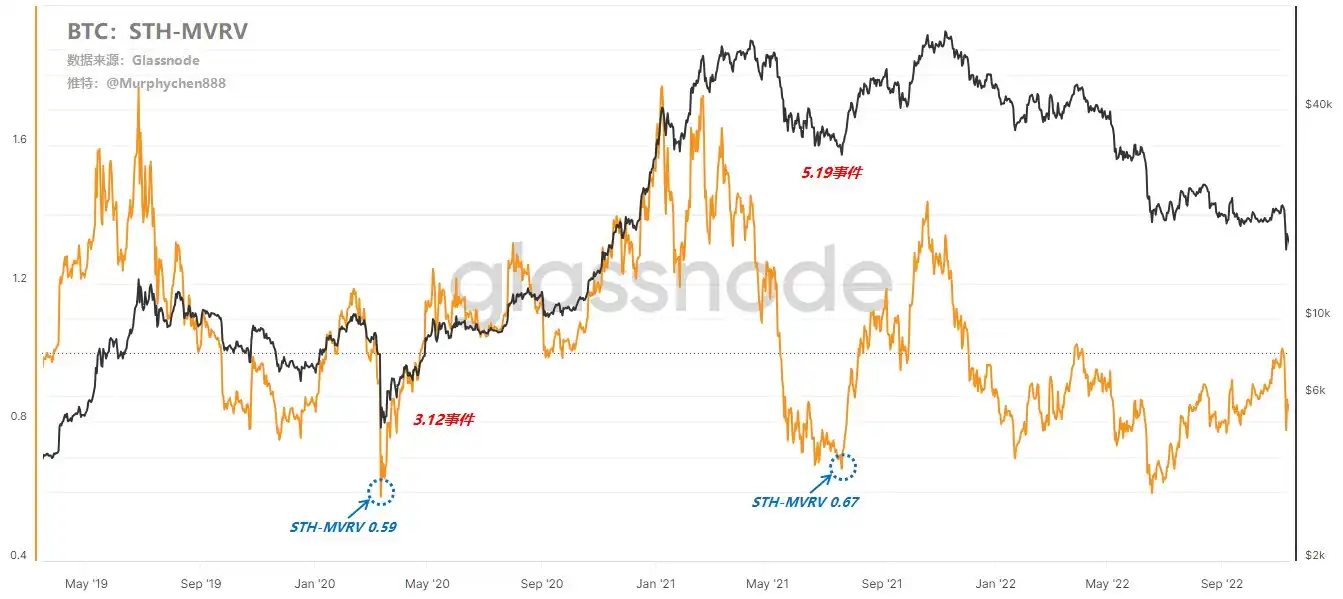
As we all know, there were two terrifying black swan events in the last cycle, which also triggered a sharp drop in BTC prices. From the figure below, we can see that when the March 12 incident occurred, STH-MVRV was as low as 0.59 ; when the May 19 incident occurred, STH-MVRV was as low as 0.67. This means that on March 12, STH (short-term holders) suffered an average floating loss of 41%, and on May 19, STH (short-term holders) suffered an average floating loss of 33%. It can be seen how tragic the market was at that time.
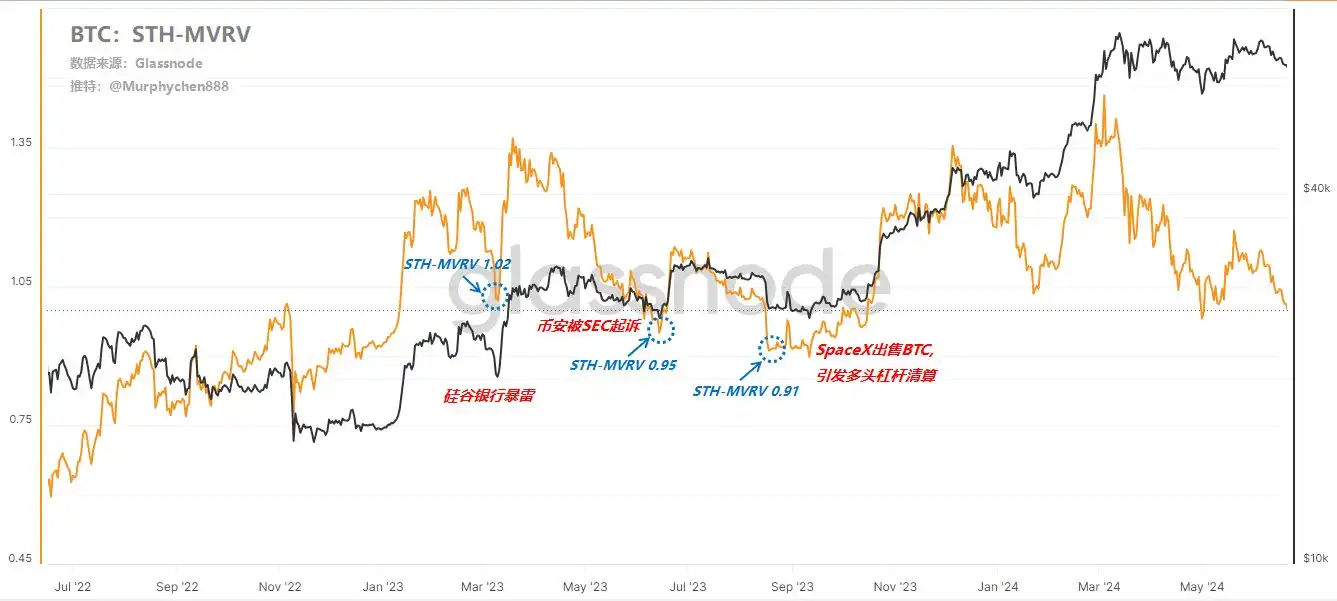
There have also been three impressive market capitulation events in this cycle:
1. On March 10, 2023, Silicon Valley Bank collapsed, and the price of BTC fell from $25,000 to $20,000. During this period , STH-MVRV dropped to a minimum of 1.02 ;
2. On June 5, 2023, Binance was sued by the SEC, and the price of BTC fell from US$30,000 to US$25,000. During this period , STH-MVRV dropped to a low of 0.95 .
3. On August 17, 2023, it was reported that SpaceX sold $373 million worth of BTC, triggering long leverage liquidation, during which STH-MVRV dropped to a low of 0.91 ;
The STH-MVRV values under these special events correspond to the current BTC prices as follows:
STH-MVRV 0.59 = $37,979
STH-MVRV 0.67 = $43,129
STH-MVRV 1.02 = $65,659
STH-MVRV 0.95 = $61,153
STH-MVRV 0.91 = $58,579
I wonder if you have noticed that when the market moves out of the bear market bottom range, we can use the performance of STH-MVRV to evaluate the volatility of market sentiment. The depth of the STH-MVRV retracement also reflects the magnitude of the influence of the event that caused the BTC price to fall.
For example, the COVID-19 pandemic swept the world in 2020. This was a severe test for human life and health. In the face of the survival crisis, no one could think about anything other than life, including investment. The impact of the 3.12 incident on the risk market was equivalent to a magnitude 9 earthquake. I think that in this round of bull market cycle, based on the current situation that can be predicted, the probability of a black swan event of the same level (affecting human survival) occurring again is almost zero. Therefore, it can be inferred that STH-MVRV will not reach 0.59, that is, the price of BTC will not reach $37,979 (can be ignored);
The cause of the 5.19 incident was a panic caused by the Chinese governments withdrawal of mining companies. Although it was also a black swan, it was not to the extent of life-threatening. Therefore, STH-MVRV reached a minimum of 0.67, which was significantly better than the situation at 3.12. Therefore, I think that if the risk market shock caused by the US economic recession is similar to the level of 5.19 at most. If this is used as a metric, the limit of BTC price retracement in this bull market cycle is around $43,129.
The current markets expectation of the Feds postponement of interest rate cuts and the possibility of only one rate cut this year should have a similar impact on the crypto market as the Silicon Valley Bank crash and Binance FUD. Therefore, I still maintain the view in the previous long tweet that BTC is more likely to make a wide range adjustment in the C1 and C2 ranges (i.e., $60,000-64,000 and $66,000-70,000).
As of June 21, STH-MVRV is 0.99. In the course of a bull market, when STH-MVRV is below 1, opportunities usually outweigh risks (only for BTC, not including ALT).
Method 2: From the perspective of market fair price algorithm
We first need to introduce a new concept, namely True Market Fair Price (TMMP), its algorithm and principle are as follows:
TMMP = (Realized Cap – Thermocap) / (Liveliness x Circulating Supply)
There are 3 basic concepts to understand in this formula:
1. Realized Cap:
Each UTXO is valued at the corresponding price at the last move, and the value of all unspent UTXOs in the network is accumulated and summed to get the Realized Cap. Because it takes into account the last move time and price of each Bitcoin, it more accurately reflects the total capital investment that actually flows into the BTC market.
2. Thermocap:
Also known as the total security expenditure, it is the sum of the dollar value of all block rewards (including block rewards and transaction fees) received by miners.
3. Liveliness:
It is the ratio of Coin Days Destroyed to all Coin Days Generated.
Coin Days (CD): is calculated by multiplying the number of days each Bitcoin is held by its quantity. One Bitcoin held for one day is equal to one Coin Day.
Coin Days Destroyed (CDD): When a Bitcoin is spent, the Coin Days it holds are destroyed. That is, Coin Days Destroyed is the sum of the Coin Days of all spent Bitcoins.
The numerator of the TMMP algorithm is Realized Cap minus Thermocap, which means that the portion of the total capital flowing into the BTC market that is paid to miners is deducted from the general cost basis of the market. The denominator is Liveliness multiplied by the circulating supply, which means the number of all currently active BTC (spent).
It covers all active chips on the chain, including ETFs, whales, transfers in and out of exchanges, etc., and excludes the miners, and does not include long-term dormant or lost chips. Therefore, using TMMP as the on-chain cost basis for evaluating active investors to buy BTC in the secondary market is one of the most accurate mean reversion models for analysts to seek investors on-chain holdings.
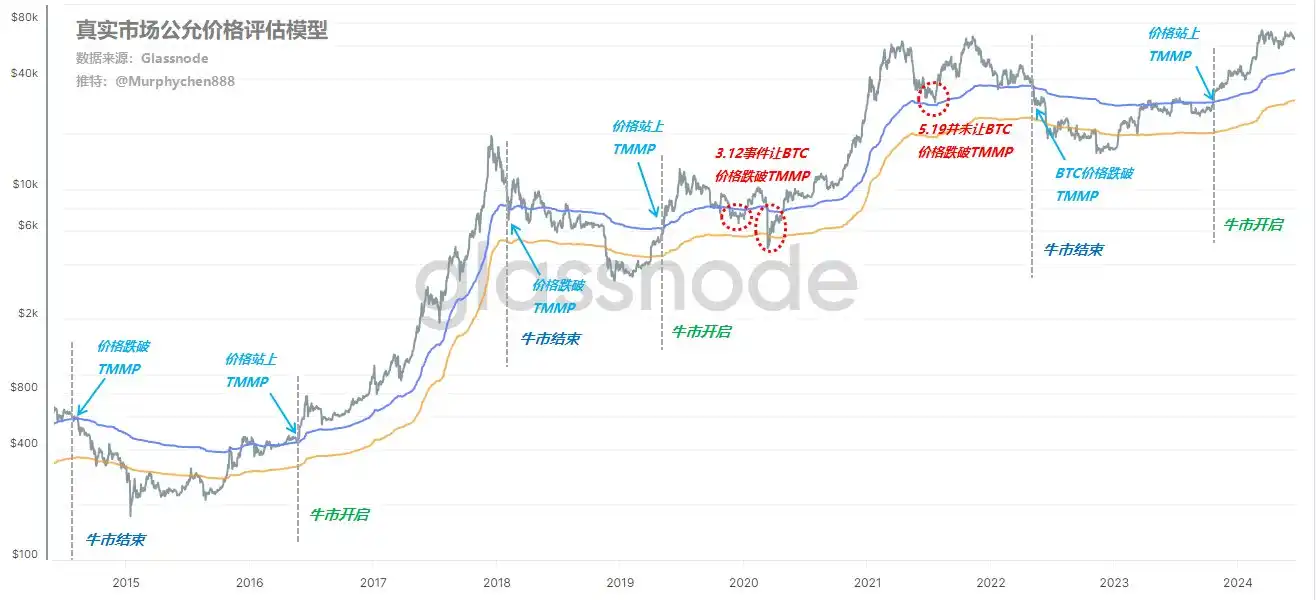
As shown in the above figure, the blue line is TMMP, and the gray line is the BTC price; whenever the BTC price stands on the blue line, it means that the market has exited the bear market and entered the bull market cycle. Although there will be false breakthroughs before this, after the effective breakthrough is finally formed, the price of BTC will hardly be lower than TMMP, even when the 5.19 black swan event occurred. But 3.12 is the only exception, which makes the price of BTC lower than TMMP again after entering the bull market cycle.
At the end of the bull market, once the BTC price falls below TMMP, it means the end of the bull market. In other words, as long as it is still in the bull market cycle, the BTC price will not be lower than TMMP unless a super black swan event (a level that affects human survival) occurs.
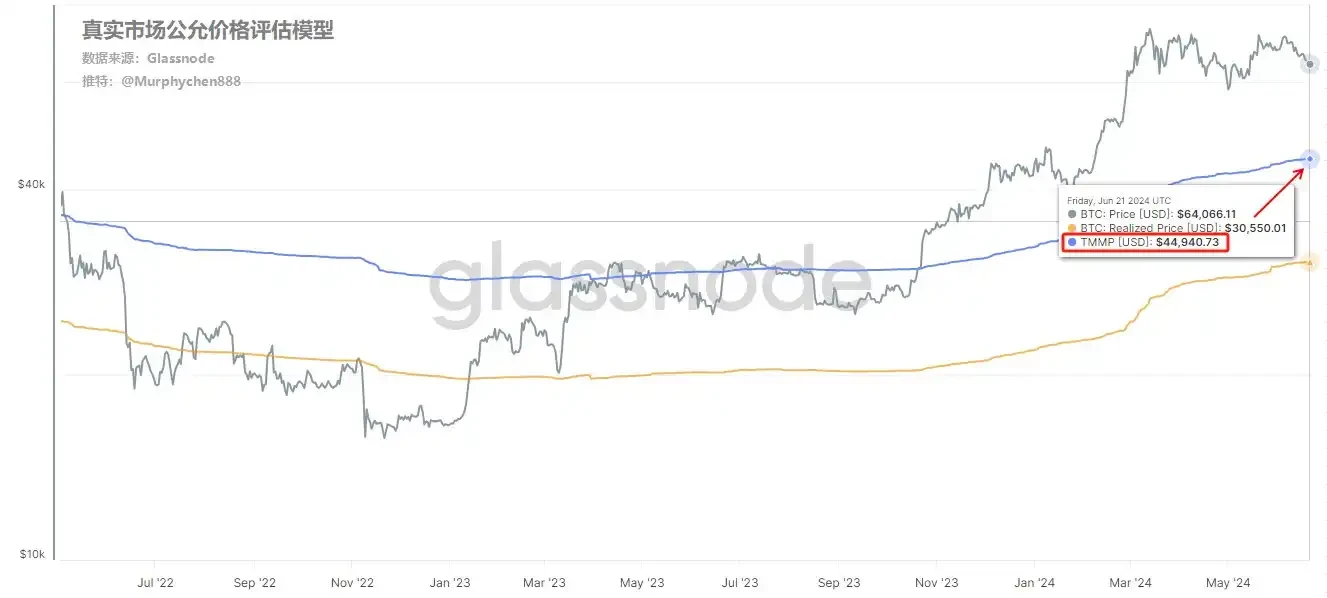
As of June 21, the real market fair price assessed by the TMMP model is $44,940. That is to say, even if a black swan event similar to the 5.19 level occurs, the limit of BTC price retracement will be around $44,900. This price is close to the limit value of $43,129 assessed by STH-MVRV in the previous article, so I think this is a number worth referring to.
To sum up, we can draw some conclusions:
1. Under the premise that no super black swan event occurs, even if BTC is affected by other macro factors, the maximum retracement value will not be lower than 43,000-44,000;
2. The influence of the so-called super black swan must reach a major level that challenges human life (such as a nuclear war between Russia and Ukraine); obviously, US economic recession is not enough.
3. Since it is a limit value, it means it is unlikely to reach that value rather than it may reach that value.
4. The above analysis period is in the bull market cycle. If the bear market comes, the extreme standards of STH-MVRV and TMMP will become invalid.
In addition, I can make a more long-term prediction without shame: even at the bottom of the next bear market cycle, the price of #BTC will not be lower than $22,500. Although it doesnt mean much at the moment, it can tell us that the lower limit of BTC will get higher and higher over time. If the cost of the #BTC you hold is below this, please cherish it.
Based on the CVDD algorithm:
CVDD (USD) = ∑(CDD × price) / (days × 6,000,000)

As shown in the figure above, CVDD depicts the historical bottom of BTC prices in each cycle with amazing accuracy. When BTC is transferred from one investor to another, the transaction not only has a dollar value, but also destroys the time value associated with the original investors holding time of the token.
Its unique algorithm makes the value trend of CVDD continue to rise, that is, todays CVDD will definitely be higher than yesterdays and will never fall back. This is very effective for building a lower limit of the market bottom that continues to rise in a bear market with falling prices!
This article is sourced from the internet: On-chain behavior analysis: How far could BTC fall in extreme cases?
Related: Shiba Inu (SHIB) Price Is Poised to Drop This Weekend
In Brief Shiba Inu’s price is stuck within a downtrend despite multiple fakeouts noted in the past two months. SHIB whales have been exhibiting skepticism since the beginning of March, which is evident in their selling. The meme coin is following Bitcoin’s footsteps and could potentially end up being a victim of corrections. Shiba Inu (SHIB) is threatened to note a decline due to the lack of recovery observed in the broader market cues. SHIB investors are not keenly bullish either, which could translate into losses for the meme coin. Shiba Inu Whales Are a Problem Shiba Inu’s price could experience a price correction due to the waning support from SHIB holders. These meme coin enthusiasts have been losing optimism toward a rally, which is visible in their increasing selling pressure. In the…