My XP
0
Login
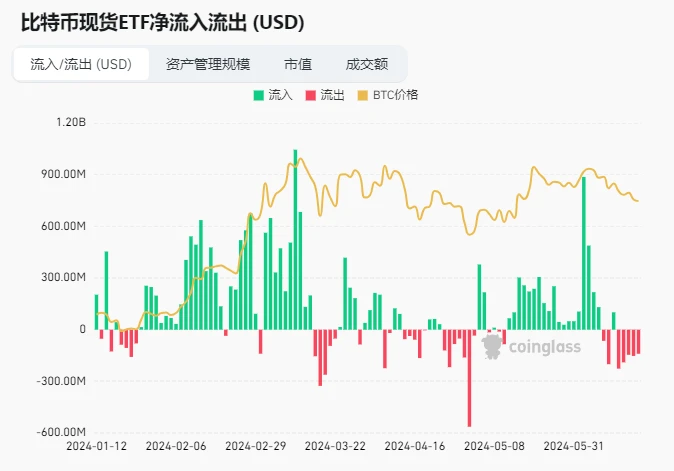
Data source: https://www.coinglass.com/en/bitcoin-etf
The latest data shows that the US spot Bitcoin ETF set off a selling storm on June 17! A total of 3,169 Bitcoins were sold, worth more than $200 million!
Among them, the well-known institution Fidelity reduced its holdings of 1,224 bitcoins, worth up to $80.34 million, and currently still holds a large amount of bitcoins. Another giant, Grayscale, also reduced its holdings of 936 bitcoins, worth more than $61.4 million. The reduction of holdings by these two giants has undoubtedly brought a lot of shock to the market.
This selling storm has created more uncertainty about the future trend of the Bitcoin market, and more risk management is needed.
There are about 38 days until the next Federal Reserve interest rate meeting (2024.08.01)
https://hk.investing.com/economic-calendar/interest-rate-decision-168

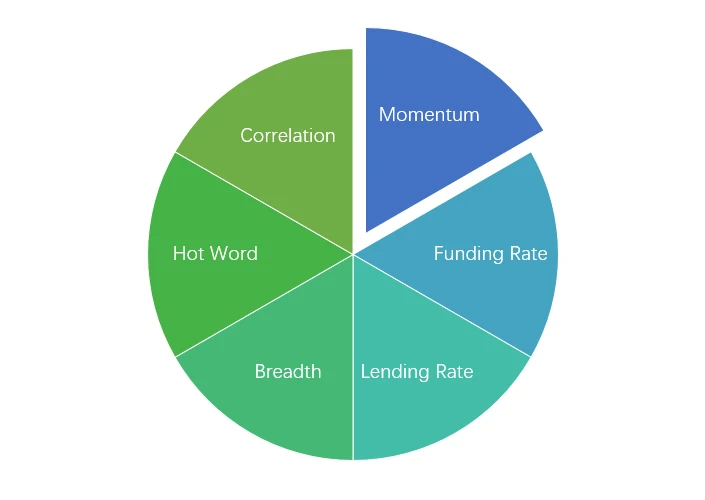
Sentiment Analysis Components

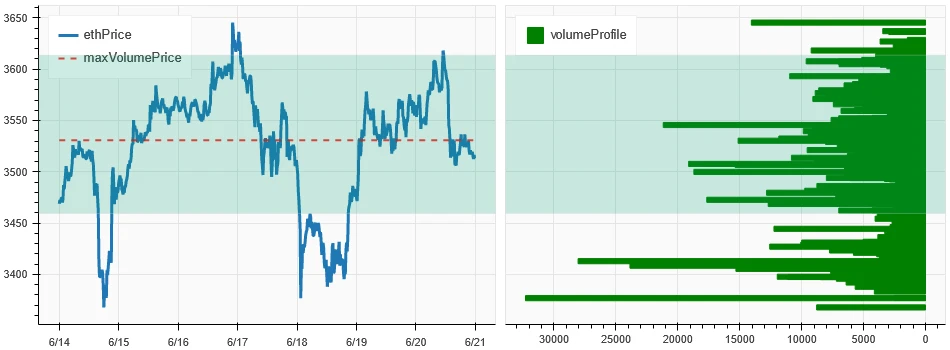
Over the past week, BTC prices fell -2.85% and ETH prices rose 1.26%.

The above picture is the price chart of BTC in the past week.
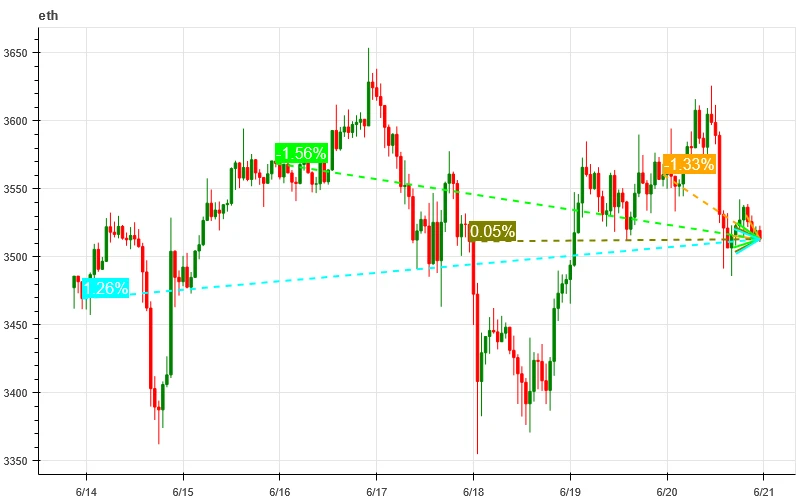
The above picture is the price chart of ETH in the past week.
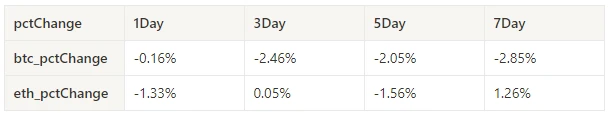
The table shows the price change rate over the past week.
In the past week, BTC and ETH have fluctuated widely in the area of intensive trading.
The above picture shows the distribution of BTCs dense trading areas in the past week.

The above picture shows the distribution of ETHs dense trading areas in the past week.

The table shows the weekly intensive trading range of BTC and ETH in the past week.
BTC and ETH saw the largest volume this past week, with the decline on June 18; open interest for BTC fell while ETH rose slightly.
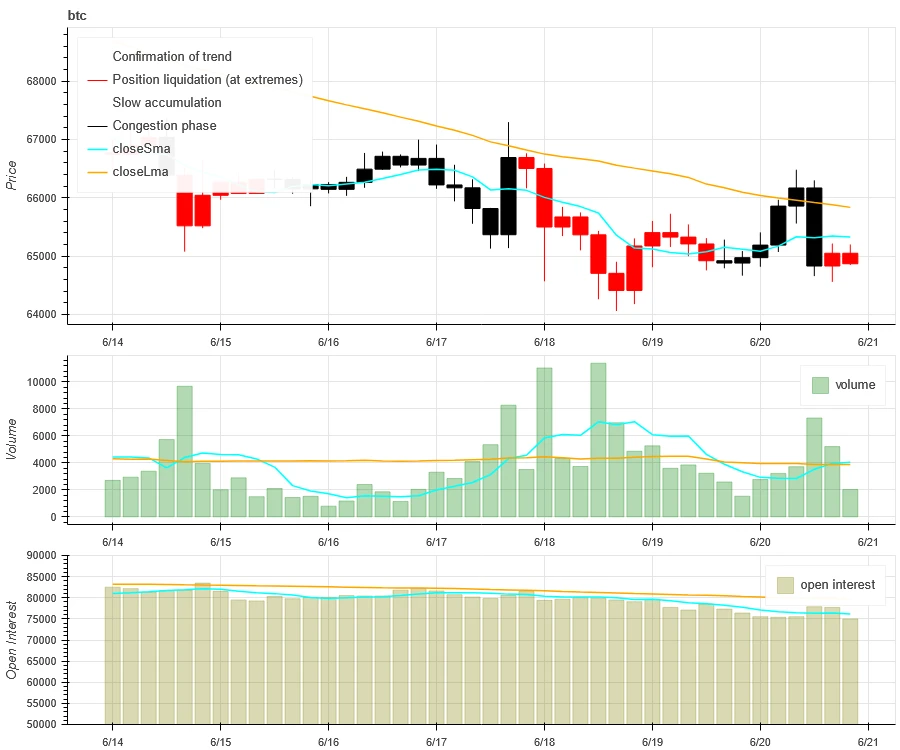
The top of the above picture shows the price trend of BTC, the middle shows the trading volume, the bottom shows the open interest, the light blue is the 1-day average, and the orange is the 7-day average. The color of the K-line represents the current state, green means the price rise is supported by the trading volume, red means closing positions, yellow means slowly accumulating positions, and black means crowded state.

The top of the above picture shows the price trend of ETH, the middle is the trading volume, the bottom is the open interest, the light blue is the 1-day average, and the orange is the 7-day average. The color of the K-line represents the current state, green means the price rise is supported by the trading volume, red is closing positions, yellow is slowly accumulating positions, and black is crowded.
In the past week, the historical volatility of BTC and ETH was the highest when it fell to 6.14; the implied volatility of BTC and ETH both increased compared to the beginning of the week.

The yellow line is the historical volatility, the blue line is the implied volatility, and the red dot is its 7-day average.

No data was released in the past week.
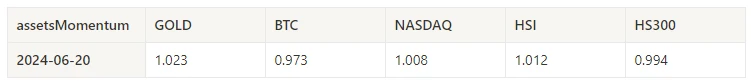
In the past week, among Bitcoin/Gold/Nasdaq/Hang Seng Index/SSE 300, gold was the strongest, while Bitcoin performed the worst.
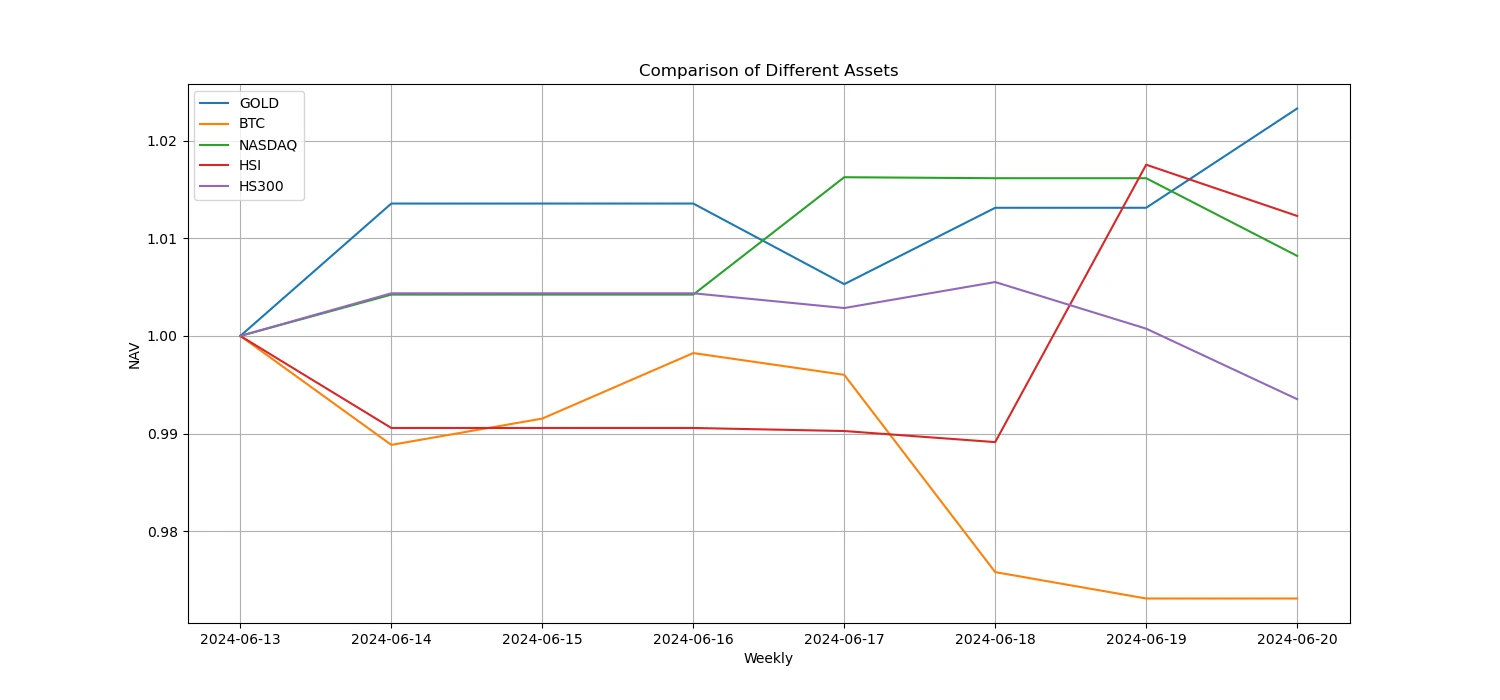
The above picture shows the trend of different assets in the past week.
The average annualized return on USD lending in the past week was 10.8%, and short-term interest rates rebounded to around 12.6%.
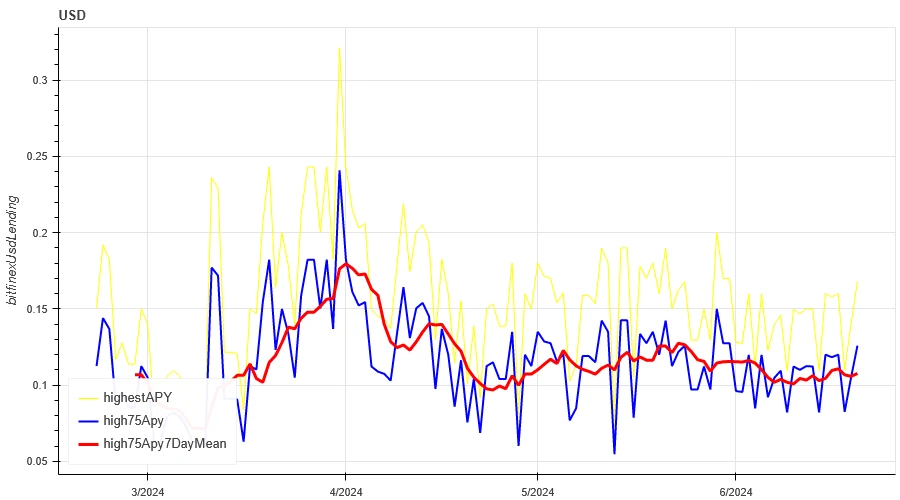
The yellow line is the highest price of USD interest rate, the blue line is 75% of the highest price, and the red line is the 7-day average of 75% of the highest price.

The table shows the average returns of USD interest rates for different holding days in the past
The average annualized return on BTC fees in the past week was 9.6%, and contract leverage sentiment returned to a low level.

The blue line is the funding rate of BTC on Binance, and the red line is its 7-day average
The table shows the average return of BTC fees for different holding days in the past.
The correlation among the 129 coins selected in the past week remained at around 0.88, and the consistency between different varieties was at a high level.

In the above picture, the blue line is the price of Bitcoin, and the green line is [1000 floki, 1000 lunc, 1000 pepe, 1000 shib, 100 0x ec, 1inch, aave, ada, agix, algo, ankr, ant, ape, apt, arb, ar, astr, atom, audio, avax, axs, bal, band, bat, bch, bigtime, blur, bnb, btc, celo, cfx, chz, ckb, comp, crv, cvx, cyber, dash, doge, dot, dydx, egld, enj, ens, eos,etc, eth, fet, fil, flow, ftm, fxs, gala, gmt, gmx, grt, hbar, hot, icp, icx, imx, inj, iost, iotx, jasmy, kava, klay, ksm, ldo, link, loom, lpt, lqty, lrc, ltc, luna 2, magic, mana, matic, meme, mina, mkr, near, neo, ocean, one, ont, op, pendle, qnt, qtum, rndr, rose, rune, rvn, sand, sei, sfp, skl, snx, sol, ssv, stg, storj, stx, sui, sushi, sxp, theta, tia, trx, t, uma, uni, vet, waves, wld, woo, xem, xlm, xmr, xrp, xtz, yfi, zec, zen, zil, zrx] overall correlation
Among the 129 coins selected in the past week, 4% of them were priced above the 30-day moving average, 8.6% of them were above the 30-day moving average relative to BTC, 2.4% of them were more than 20% away from the lowest price in the past 30 days, and 4.7% of them were less than 10% away from the highest price in the past 30 days. The market breadth indicator in the past week showed that the overall market was in a continuous decline for most coins.

The above picture shows [bnb, btc, sol, eth, 1000 floki, 1000 lunc, 1000 pepe, 1000 sats, 1000 shib, 100 0x ec, 1inch, aave, ada, agix, ai, algo, alt, ankr, ape, apt, arb, ar, astr, atom, avax, axs, bal, band, bat, bch, bigtime, blur, cake, celo, cfx, chz, ckb, comp, crv, cvx, cyber, dash, doge, dot, dydx, egld, enj, ens, eos,etc, fet, fil, flow, ftm, fxs, gala, gmt, gmx, grt, hbar, hot, icp, icx, idu, imx, inj, iost, iotx, jasmy, jto, jup, kava, klay, ksm, ldo, link, loom, lpt, lqty, lrc, ltc, luna 2, magic, mana, manta, mask, matic, meme, mina, mkr, near, neo, nfp, ocean, one, ont, op, ordi, pendle, pyth, qnt, qtum, rndr, robin, rose, rune, rvn, sand, sei, sfp, skl, snx, ssv, stg, storj, stx, sui, sushi, sxp, theta, tia, trx, t, uma, uni, vet, waves, wif, wld, woo,xai, xem, xlm, xmr, xrp, xtz, yfi, zec, zen, zil, zrx ] 30-day proportion of each width indicator

Over the past week, the prices of Bitcoin (BTC) and Ethereum (ETH) experienced wide range declines, reaching the peak of volatility on June 18. At the same time, the trading volume of these two cryptocurrencies also reached the highest level during the decline on June 18. Bitcoins open interest volume has declined, while Ethereums open interest volume has increased slightly. In addition, both implied volatilities have increased slightly. In addition, Bitcoins funding rate has fallen to a low level, which may reflect the decline in leverage sentiment of market participants towards Bitcoin. In addition, the market breadth indicator shows that most currencies continue to fall, which indicates that the entire market has generally shown a weak trend over the past week.
Twitter: @ https://x.com/CTA_ChannelCmt
Website: channelcmt.com
This article is sourced from the internet: Crypto Market Sentiment Research Report (2024.06.14-2024.06.21): Bitcoin ETFs have been continuously sold off in the past 5 days
Original | Odaily Planet Daily Author | Azuma At 20:00 Beijing time on April 30, Kamino, the leading DeFi protocol in the Solana ecosystem, will officially open token applications for the governance token KMNO. Previously on April 5, Kamino added a token creation page to its official website. Users could previously query the specific KMNO token airdrop shares through this page. Tonight鈥檚 open claim means that users will be able to claim the established KMNO shares through this interface and trade them on DEX or some CEX that supports KMNO. Kamino business model breakdown Kaminos business model is not complicated, and its basic product is a lending protocol that everyone is familiar with. According to DeFi Llama data, Kamino is currently the third-ranked DeFi protocol and the first-ranked lending protocol…


