The inflow of US spot ETFs is astonishing, so why hasn’t BTC risen sharply?
Original author: CryptoVizArt, UkuriaOC, Glassnode
Original translation: Deng Tong, Golden Finance
Summary
With the advent of Runes Protocol, a counter-intuitive divergence has emerged between the decrease in active addresses and the increase in the number of transactions.
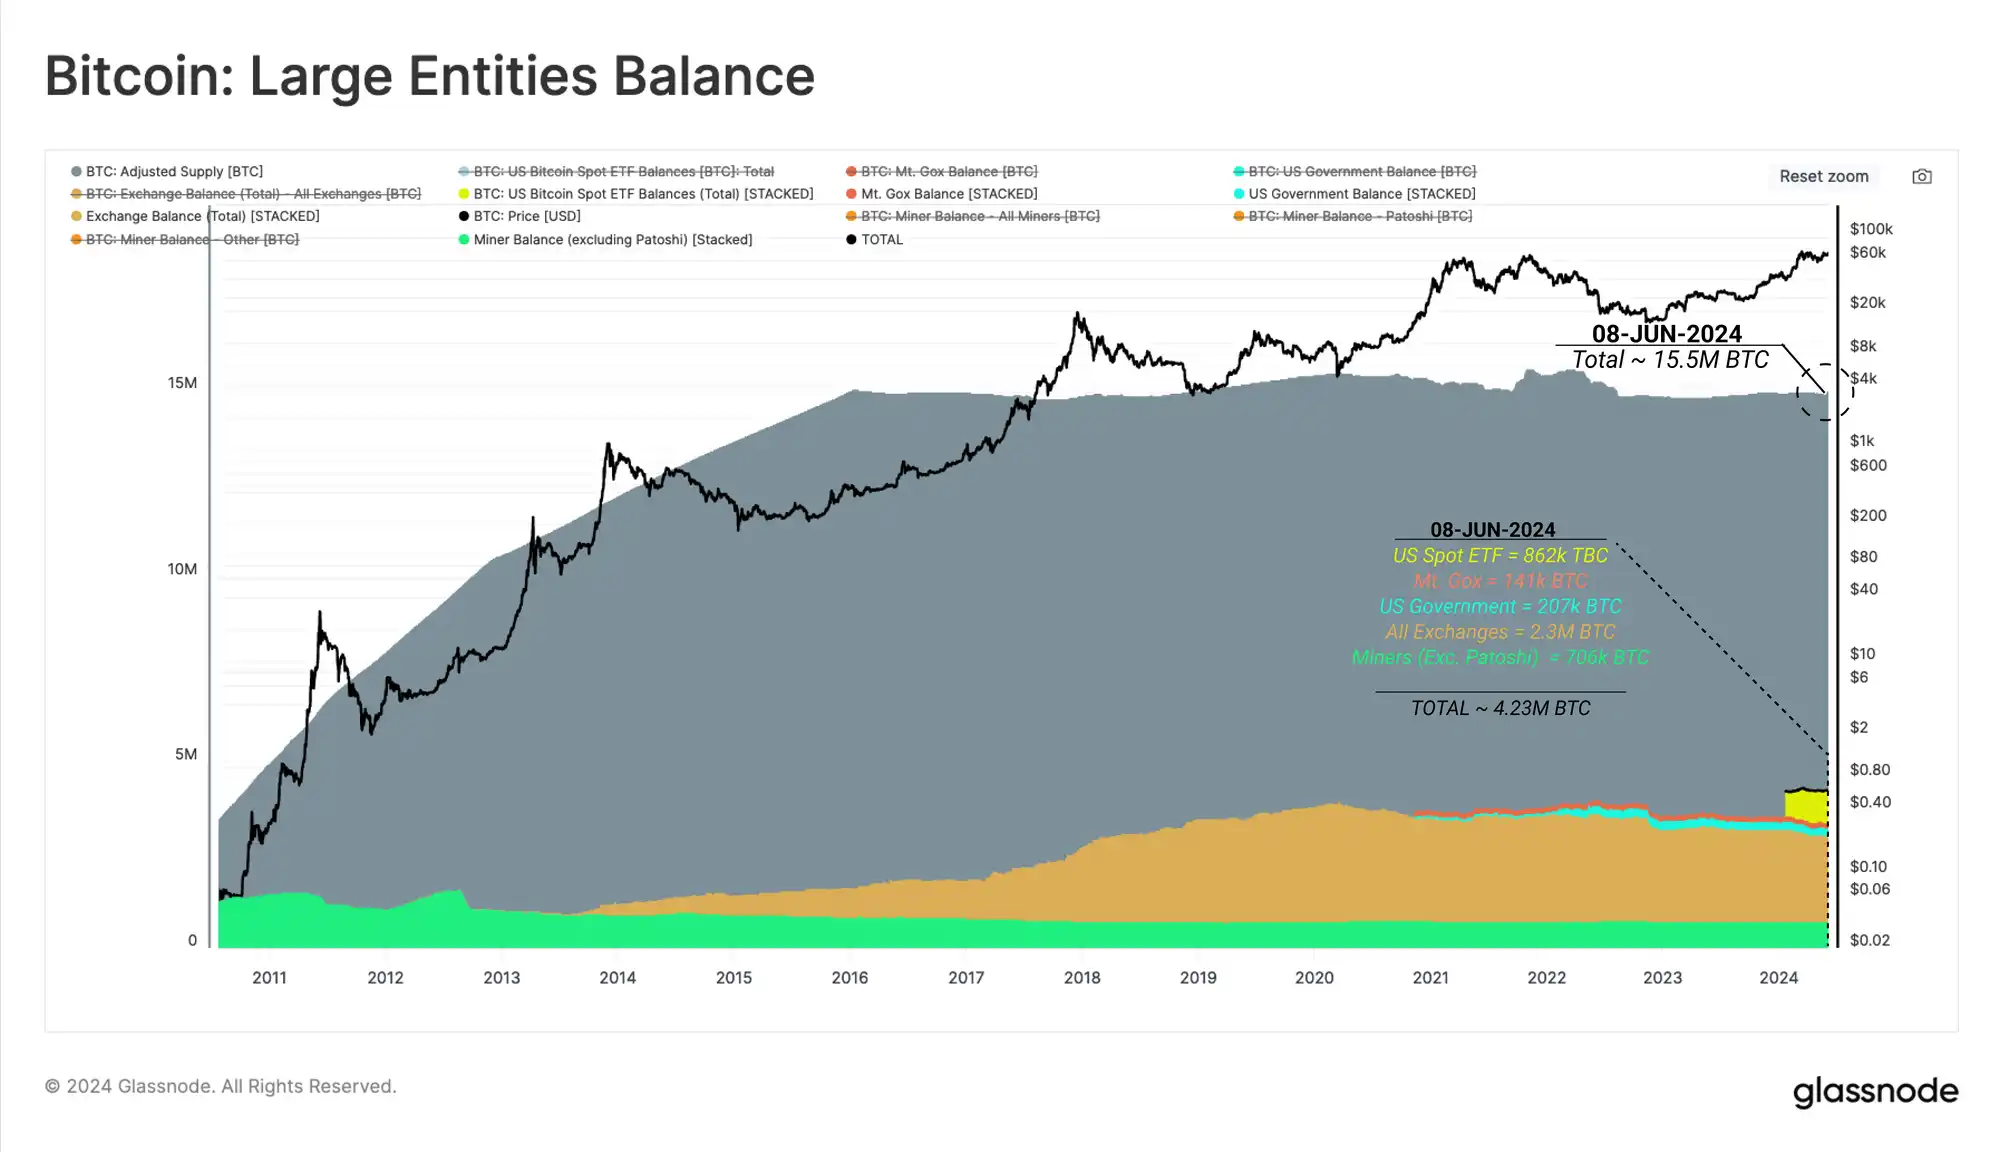
Major tokenizing entities now hold a staggering ~4.23M BTC, representing over 27% of the adjusted supply, with US spot ETFs now holding a balance of 862,000 BTC.
Spot and hedge structures appear to be a significant source of demand for ETF inflows, with ETFs being used as a vehicle to gain long spot exposure, while net short positions in Bitcoin in CME Group futures markets are growing.
The decrease in active addresses and the increase in network transaction volume
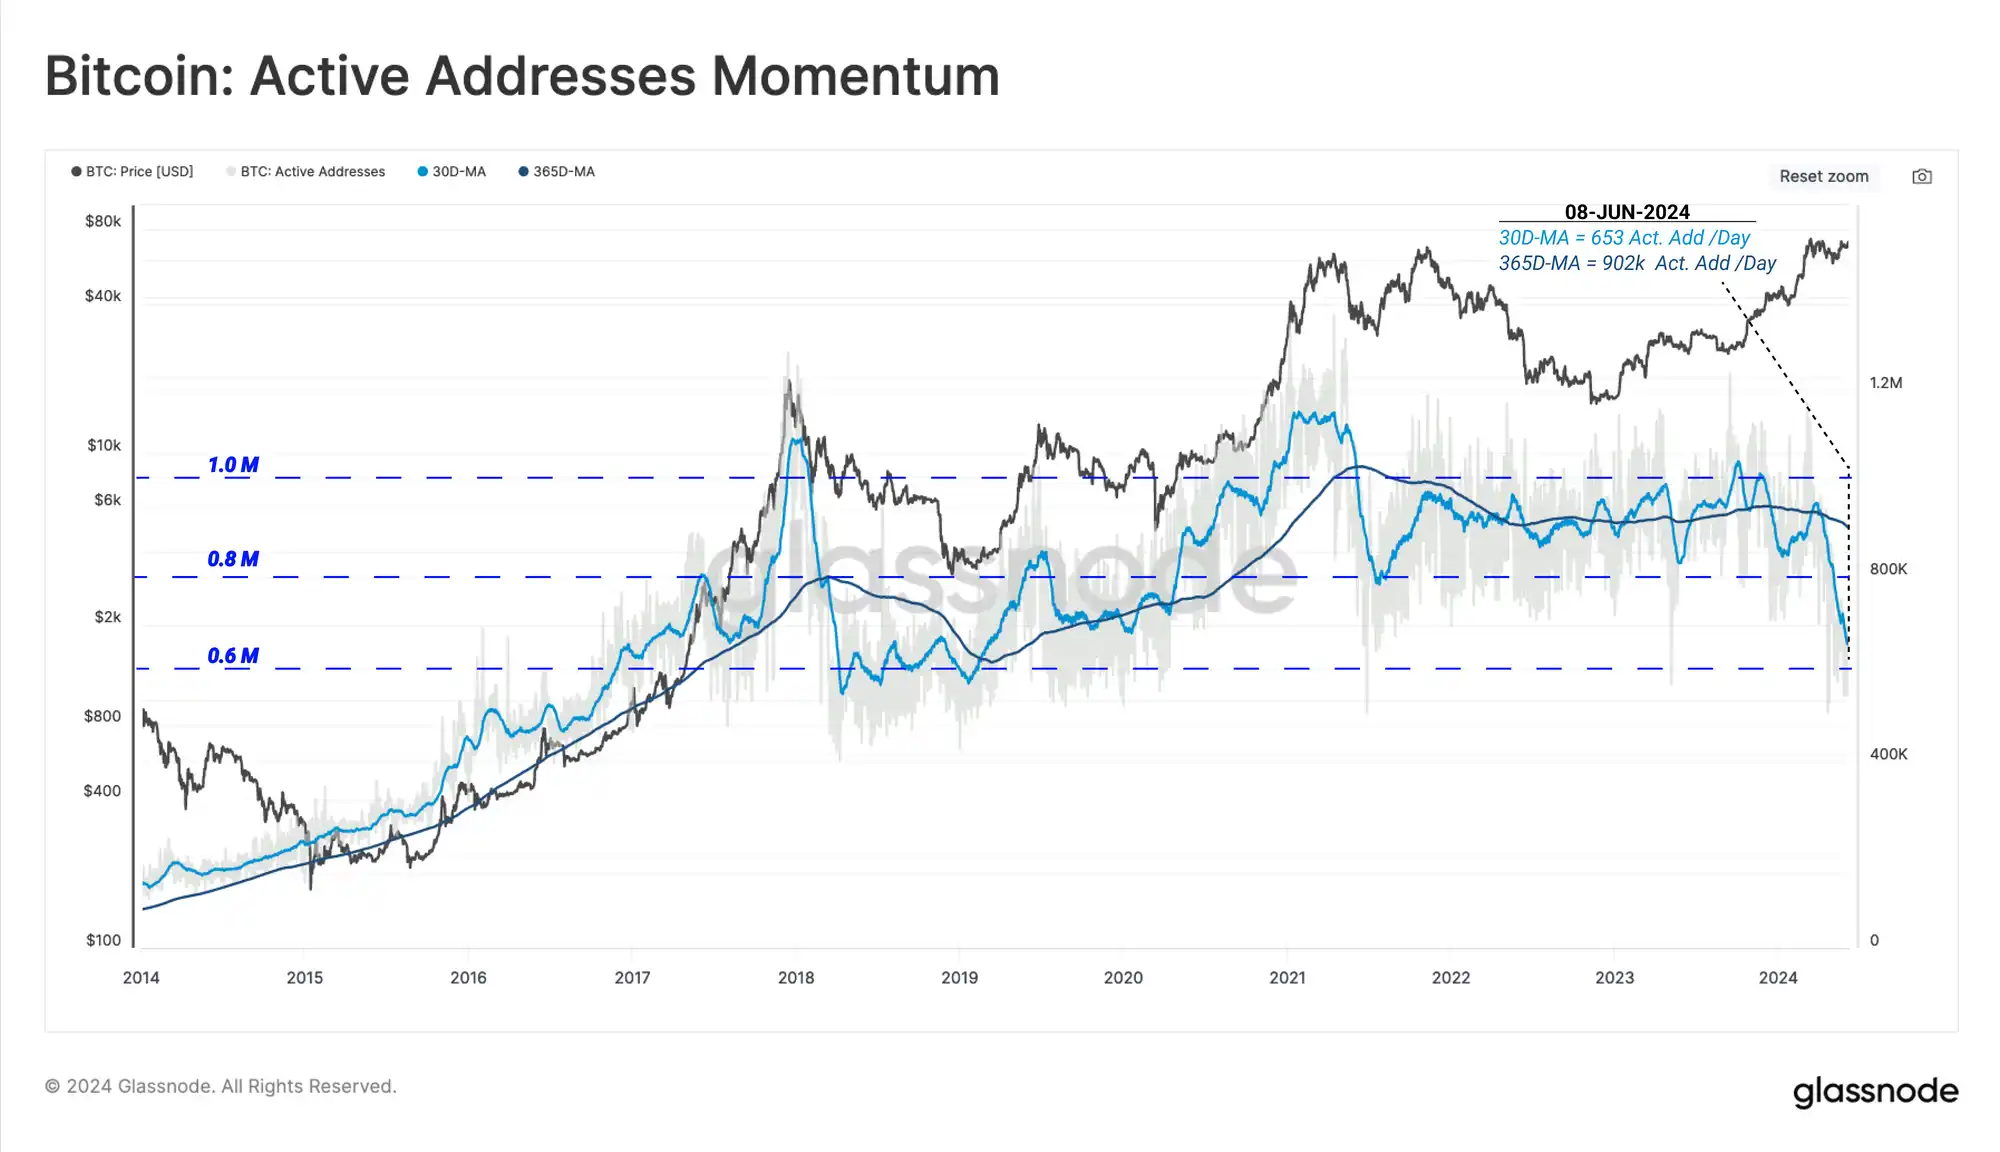
On-chain activity metrics such as active addresses, transactions, and transaction volume provide a valuable toolkit for analyzing the growth and performance of blockchain networks. When restrictions on Bitcoin mining were implemented in mid-2021, the number of active addresses on the Bitcoin network fell sharply, from more than 1.1 million per day to only about 800,000 per day.
The Bitcoin network is currently experiencing a similar contraction in network activity, albeit driven by entirely different factors. In the following sections, we will explore how the emergence of Inscriptions, Ordinals, BRC-20, and Runes can significantly change the way on-chain analysts view future activity metrics.
Despite strong market momentum, rising active addresses and daily transaction volume, this trend is deviating.
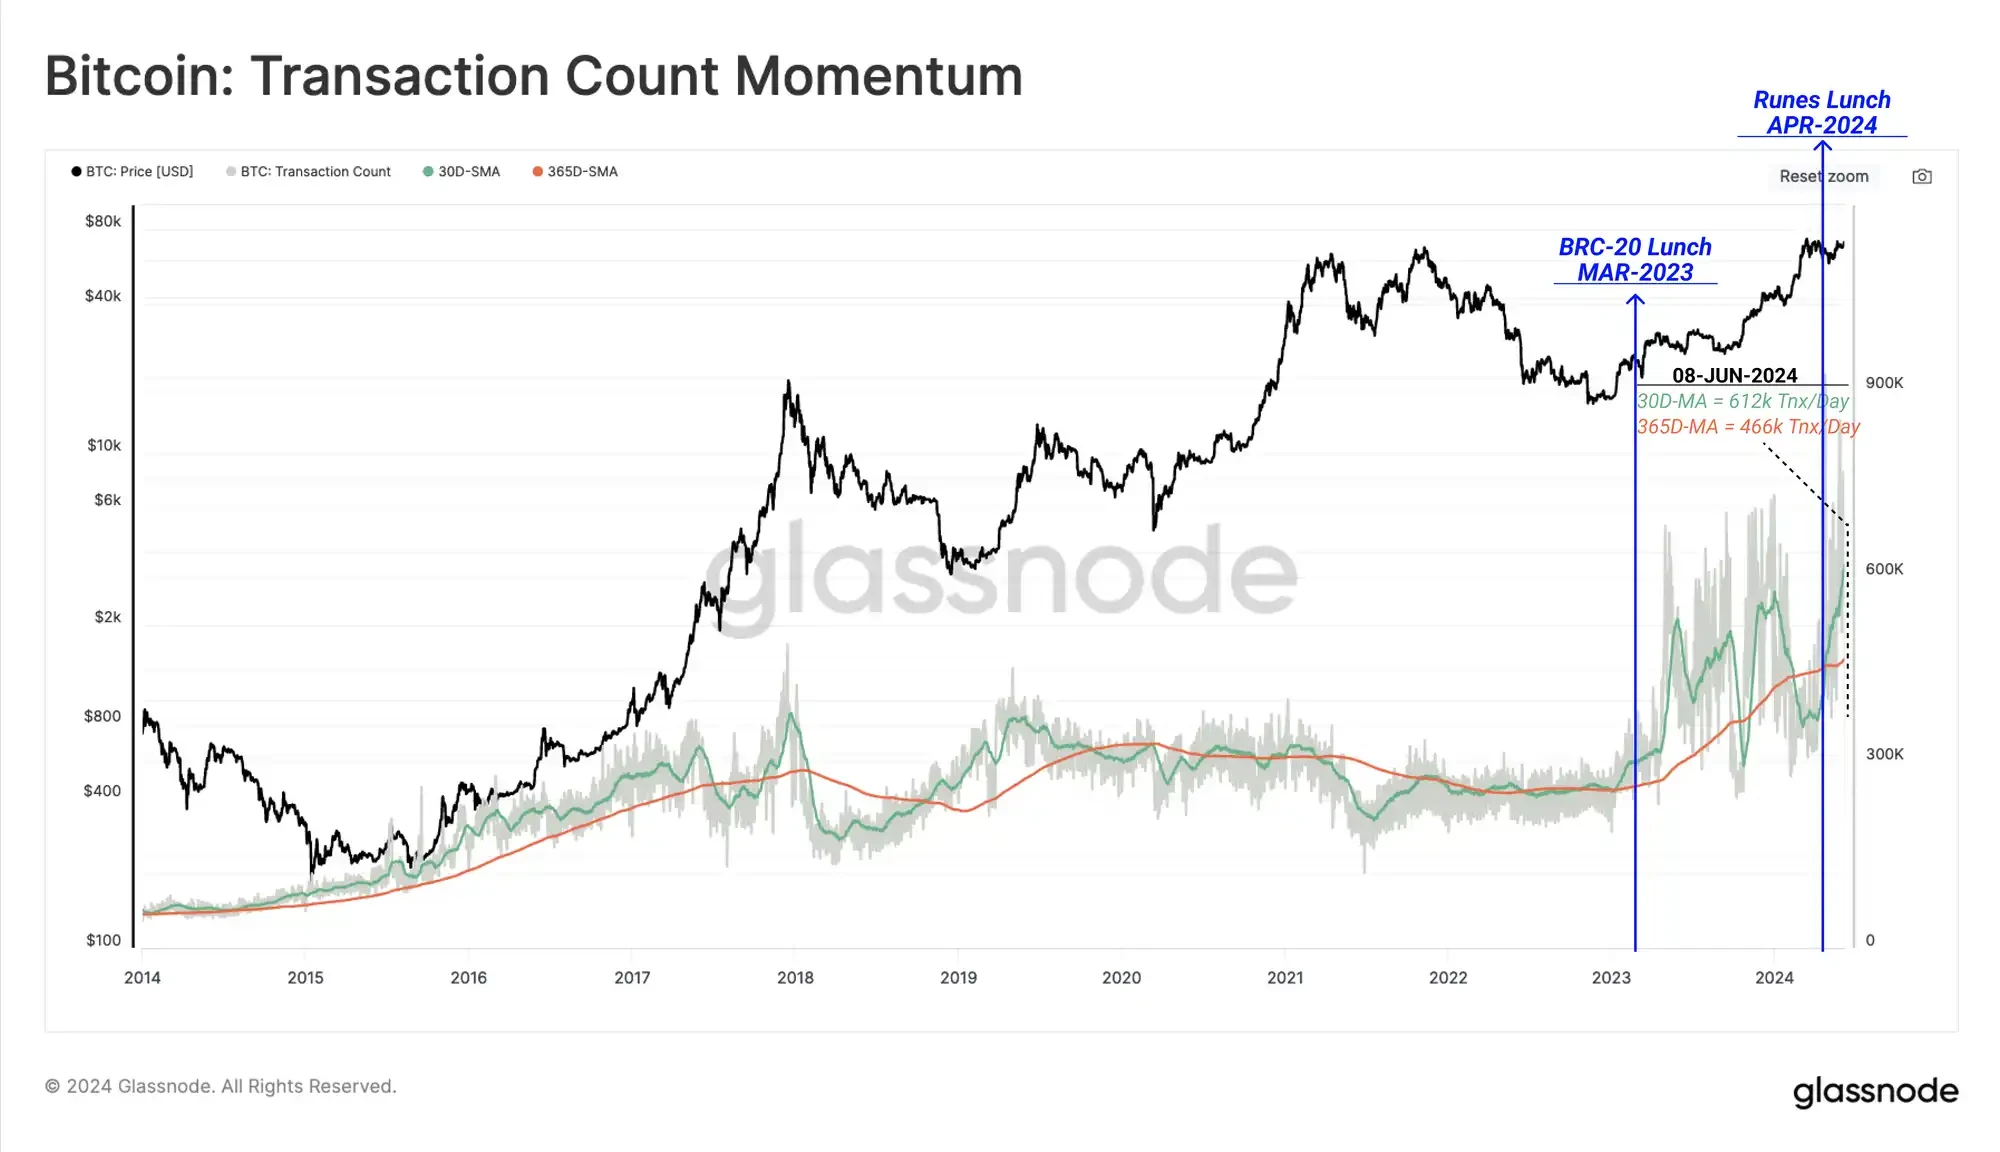
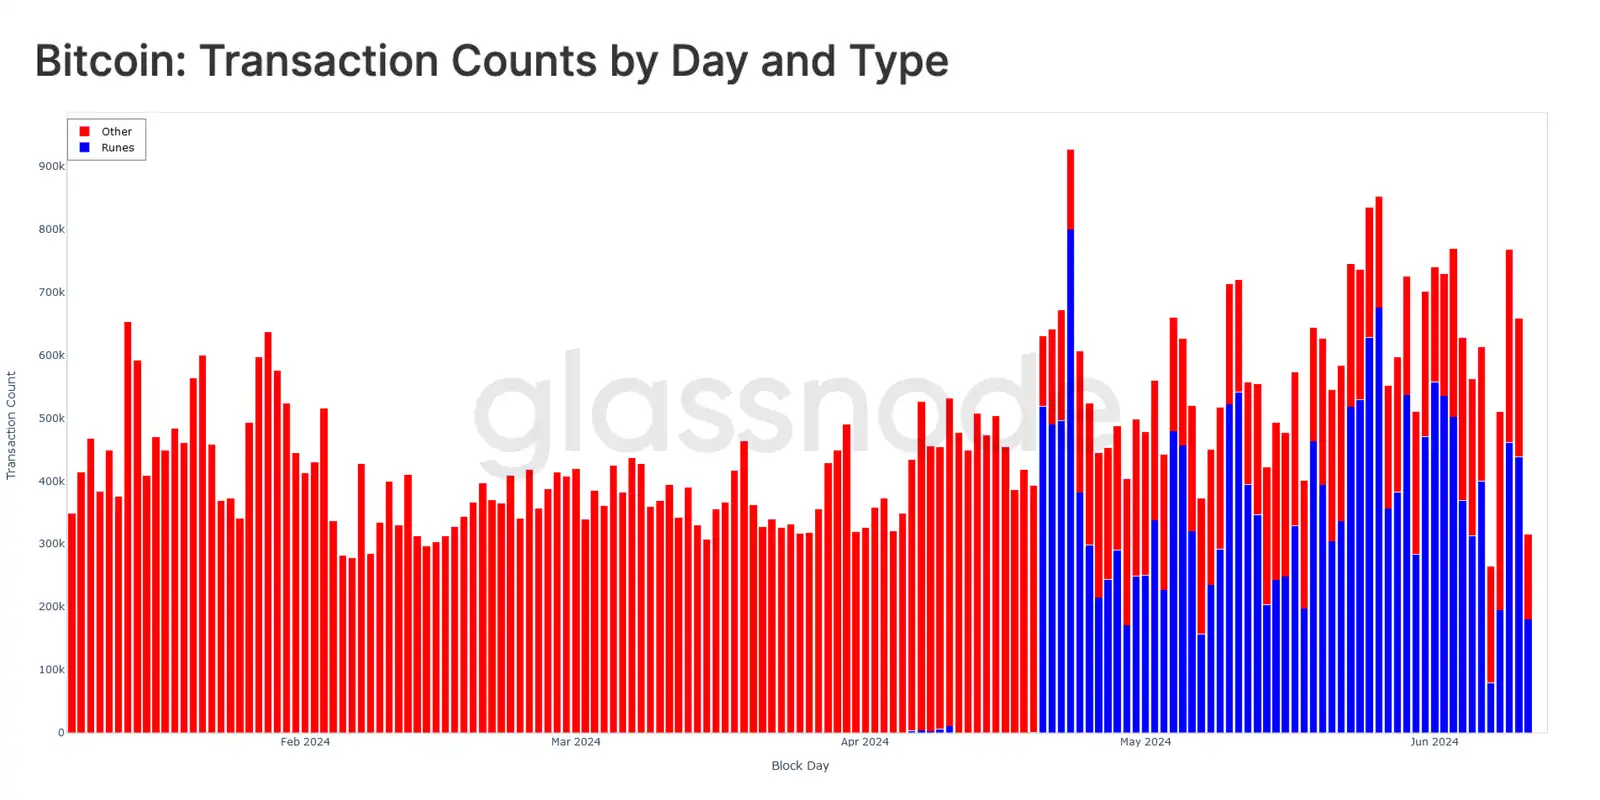
While active addresses appear to be declining, the number of transactions processed by the network is near record highs. The current monthly average of 617k transactions per day is 31% higher than the annual average, indicating a relatively high demand for Bitcoin block space.
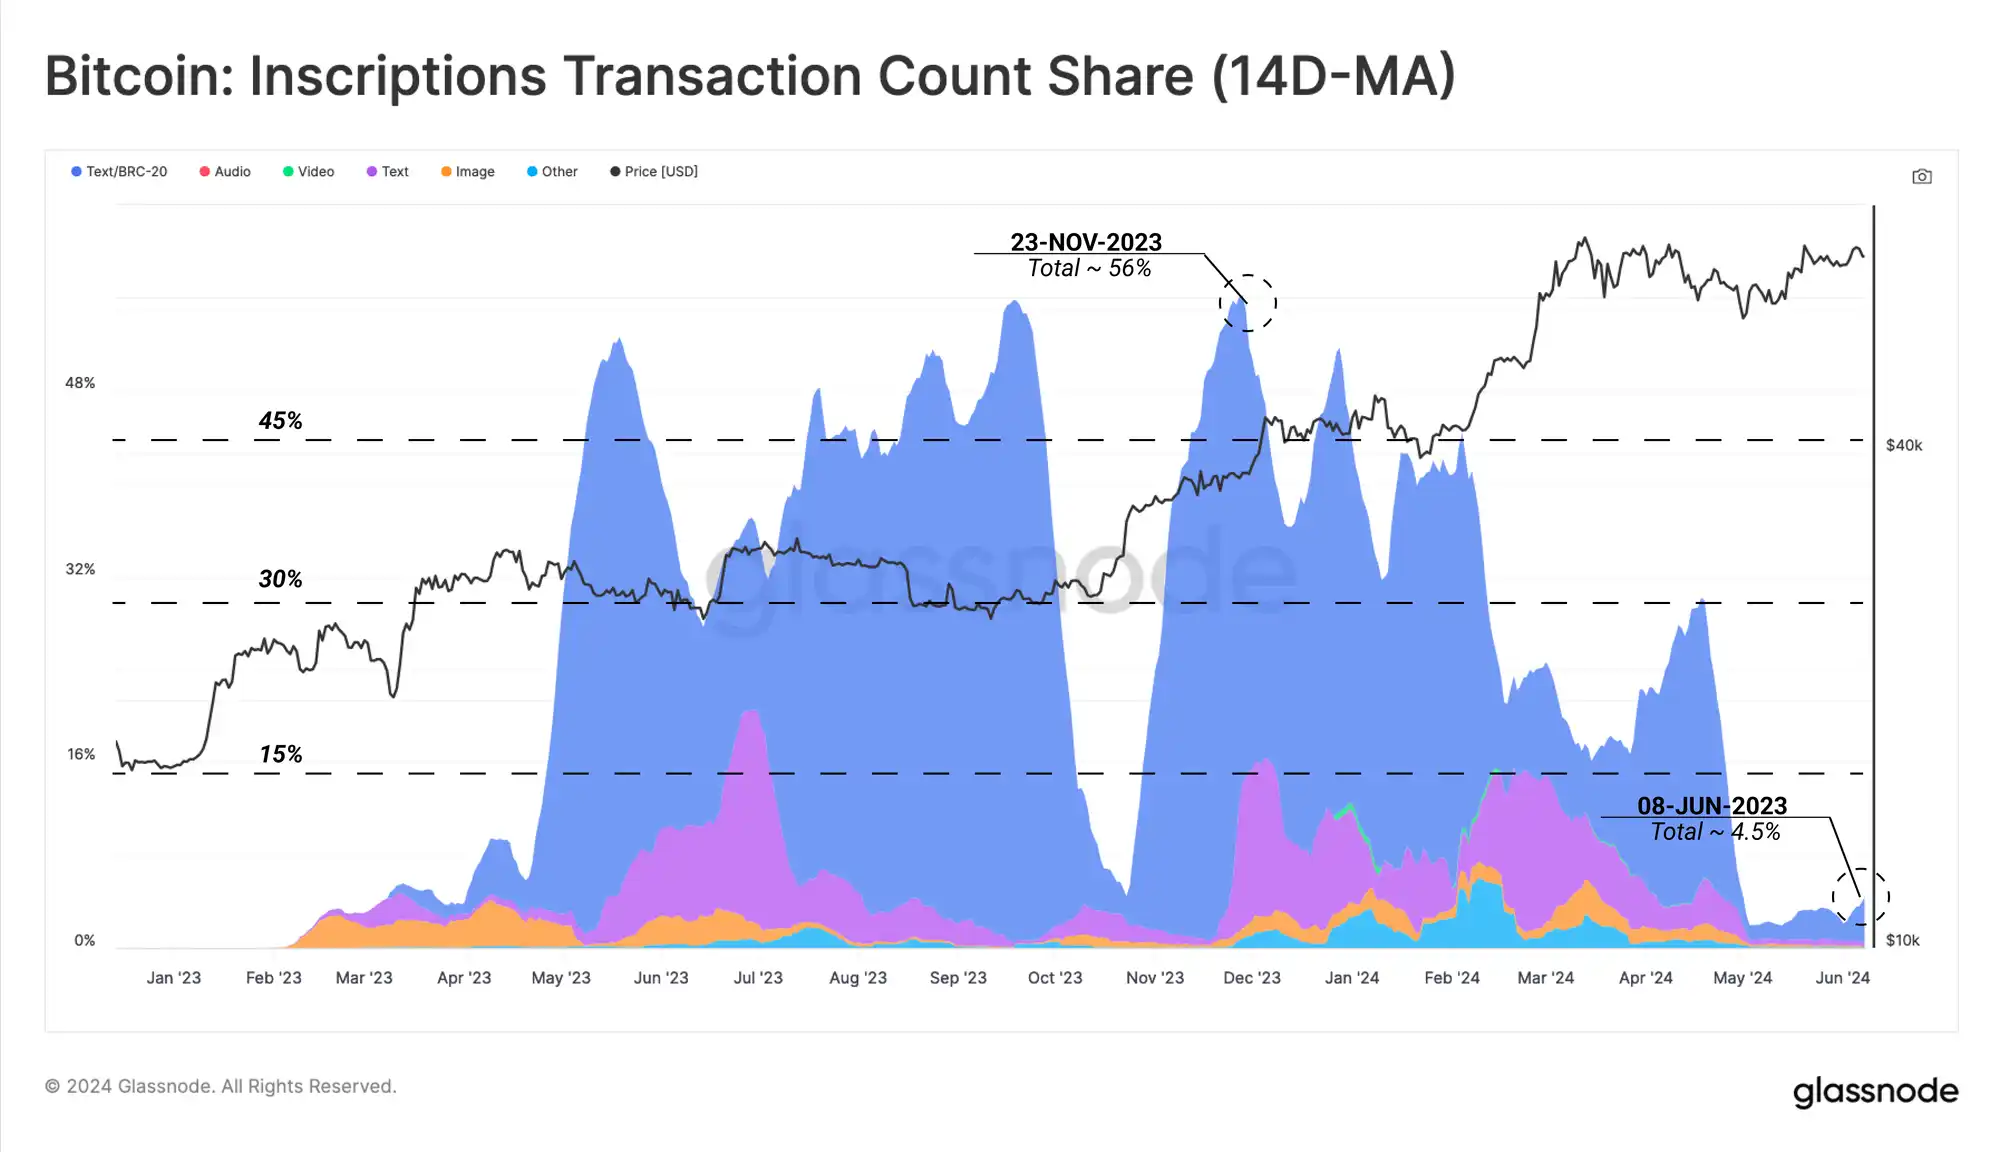
If we compare the recent drop in active addresses with inscriptions and the transaction share of BRC-20 tokens, we can observe a strong correlation. It is worth noting that the number of inscriptions has also dropped sharply since mid-April.
This suggests that the initial driver of the drop in address activity was primarily due to a decrease in the use of Inscriptions and Ordinals. It is important to note that many wallets and protocols within the industry reuse addresses and do not double count addresses if they are active more than once in a day. Therefore, if an address generates ten transactions in a day, it will appear as one active address, but actually has ten transactions.
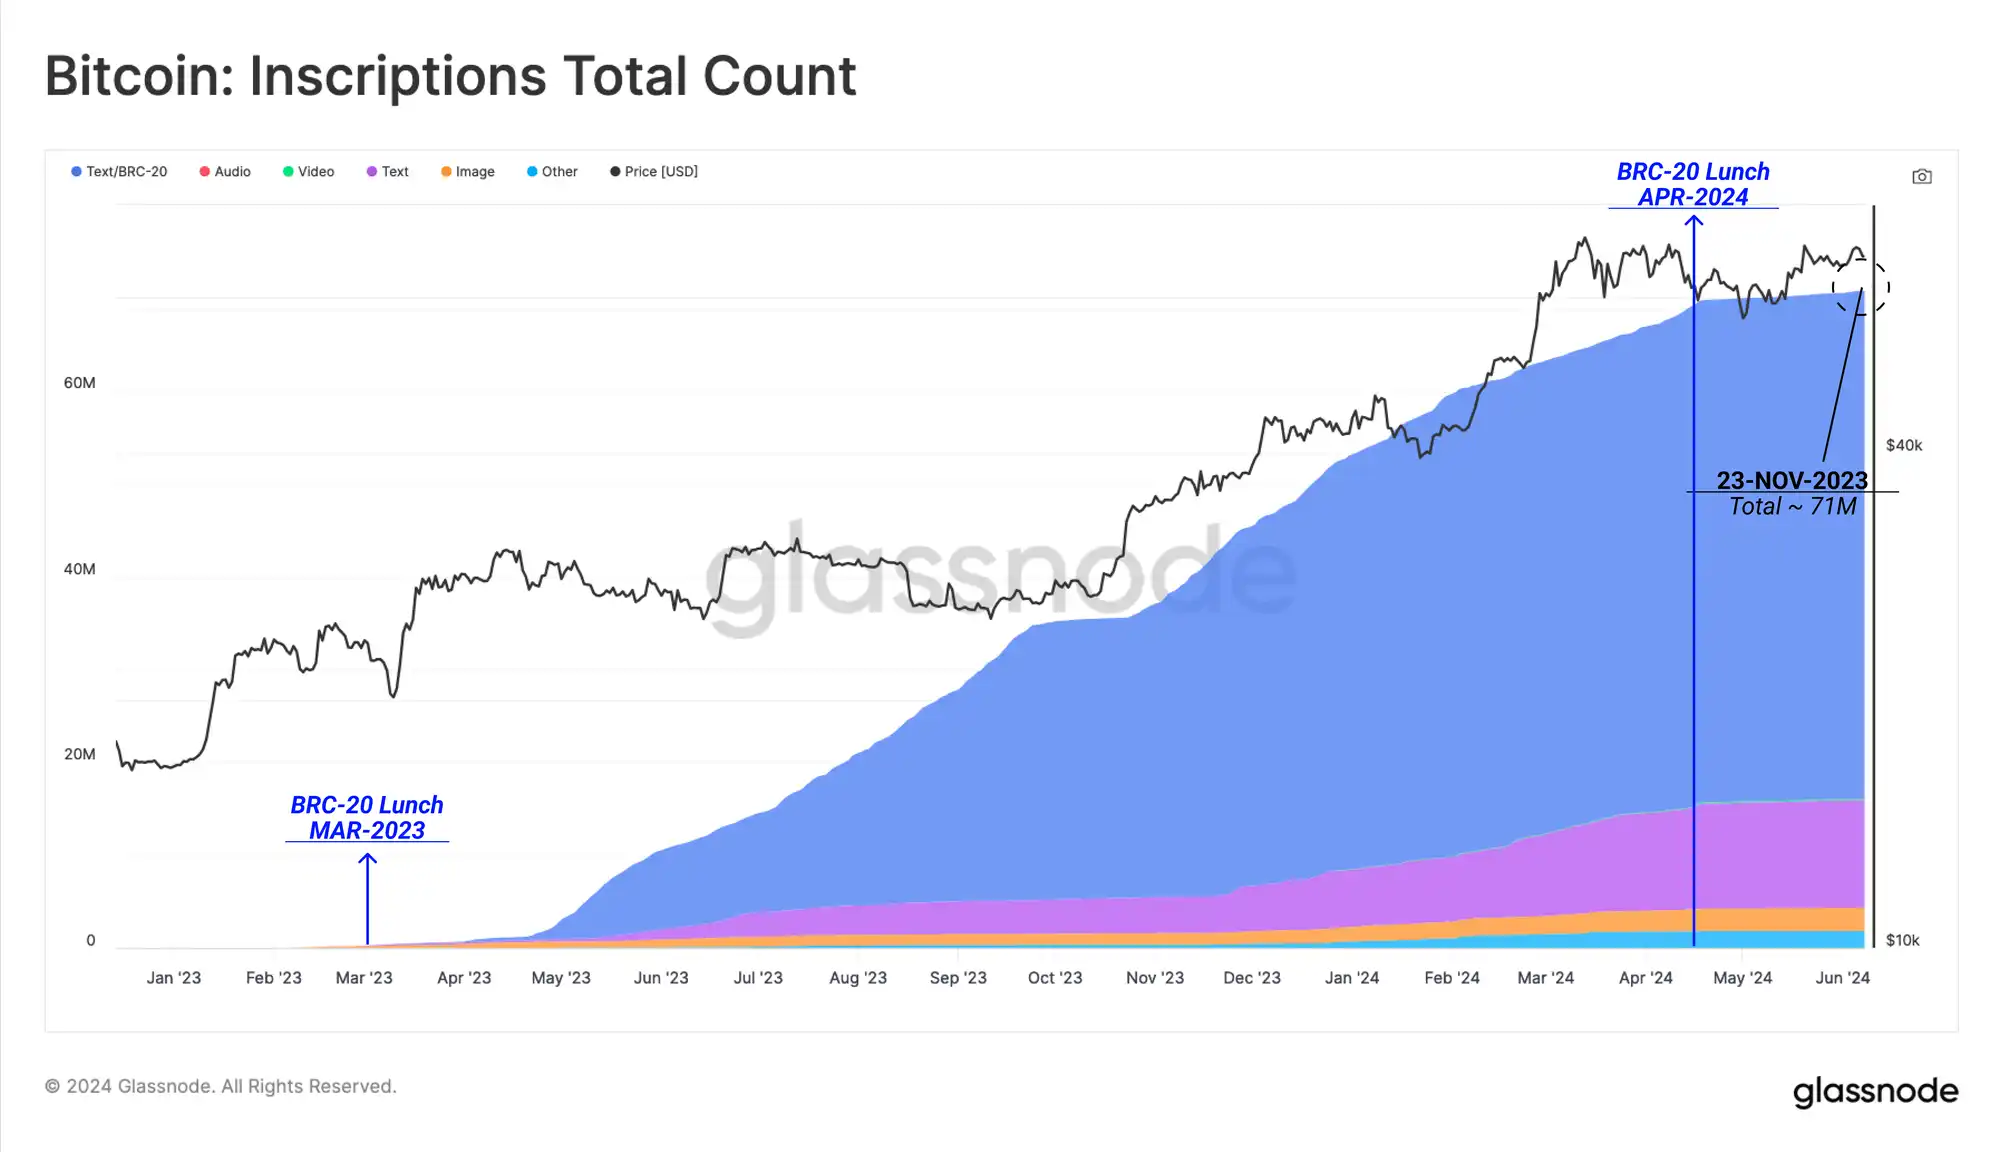
To illustrate how inscriptions have grown since the beginning of 2023, we can see how the total number of cumulative inscriptions has expanded. As of the time of writing, the number of inscriptions has reached 71 million, however, the popularity of the protocol has dropped significantly since mid-April of this year.
To explain the drop in inscription activity, we must highlight the emergence of the Runes protocol, which claims to be a more efficient way to introduce fungible tokens on Bitcoin. Runes went live on the halving block, which explains the drop in inscriptions in mid-April.
Runes follow a different mechanism than inscriptions and BRC-20 tokens, utilizing the OP_RETURN field (80 bytes). This allows the protocol to encode arbitrary data into the chain while requiring less block space.
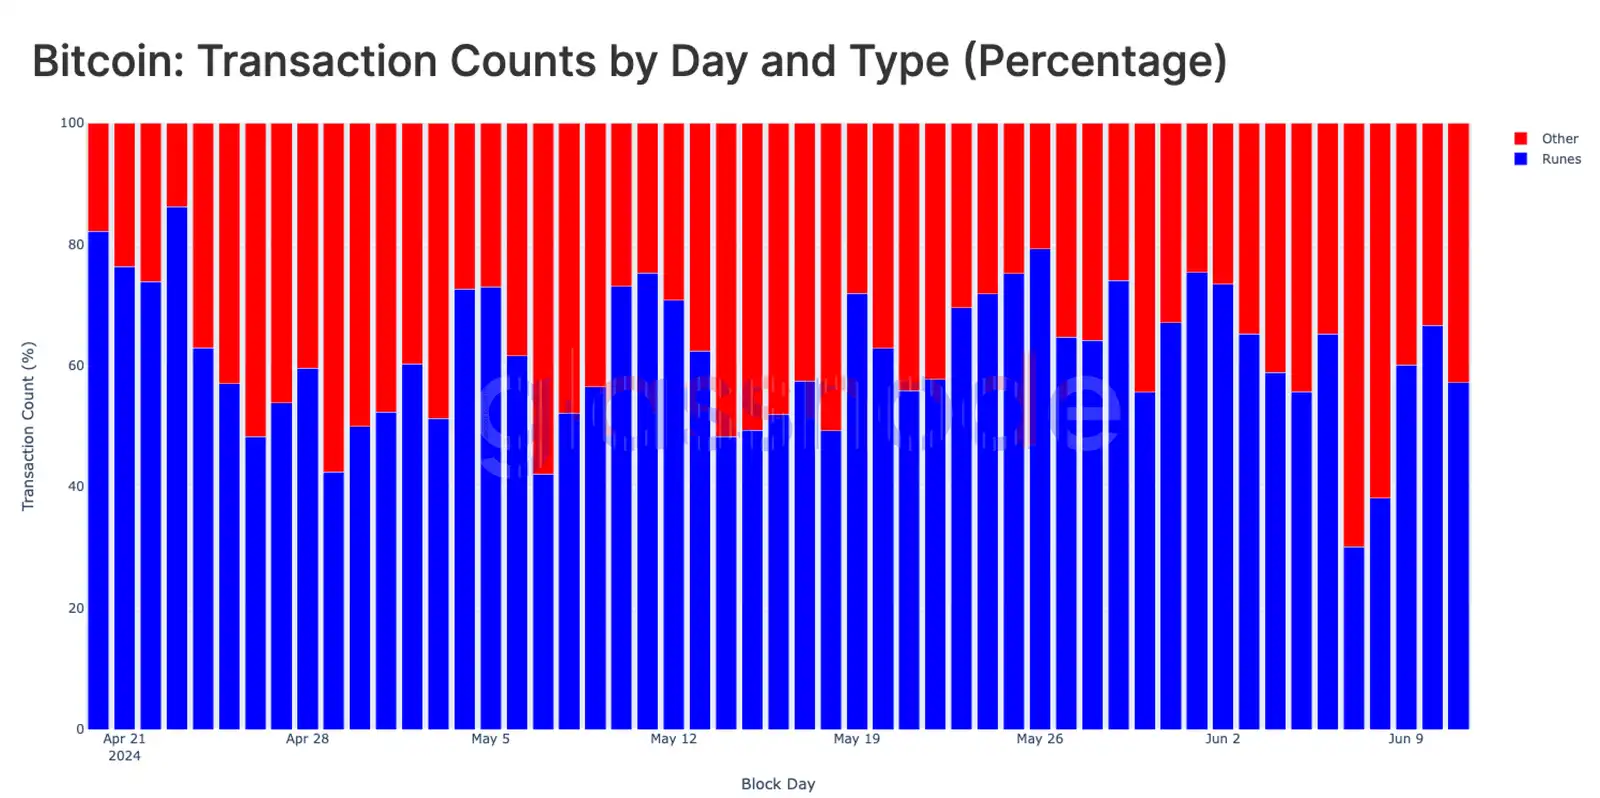
With the launch of the Runes protocol at the time of the halving (April 20, 2024), demand for Runes transactions surged to between 600,000 and 800,000 per day and has remained high since then.
Rune-related transactions have now largely replaced BRC-20 tokens as well as Ordinals and Inscriptions, accounting for 57.2% of daily transactions. This suggests that collectors’ speculation may have shifted from Inscriptions to the Rune market.
ETF demand diverges
Another divergence that has recently gained attention is that despite the staggering inflows into US spot ETFs, prices have stagnated and moved sideways. To identify and assess the demand side of ETFs, we can compare ETF balances (862k BTC) to other major entities.
US Spot ETF = 862k BTC
Mt. Gox Trustee = 141k BTC
US Government = 207k BTC
All exchanges = 2.3 million BTC
Miners (excluding Patoshi) = 706k BTC
The combined balance of all of these entities is estimated to be around 4.23 million, or 27% of the overall adjusted circulating supply (i.e., total supply minus tokens that have been idle for more than seven years).
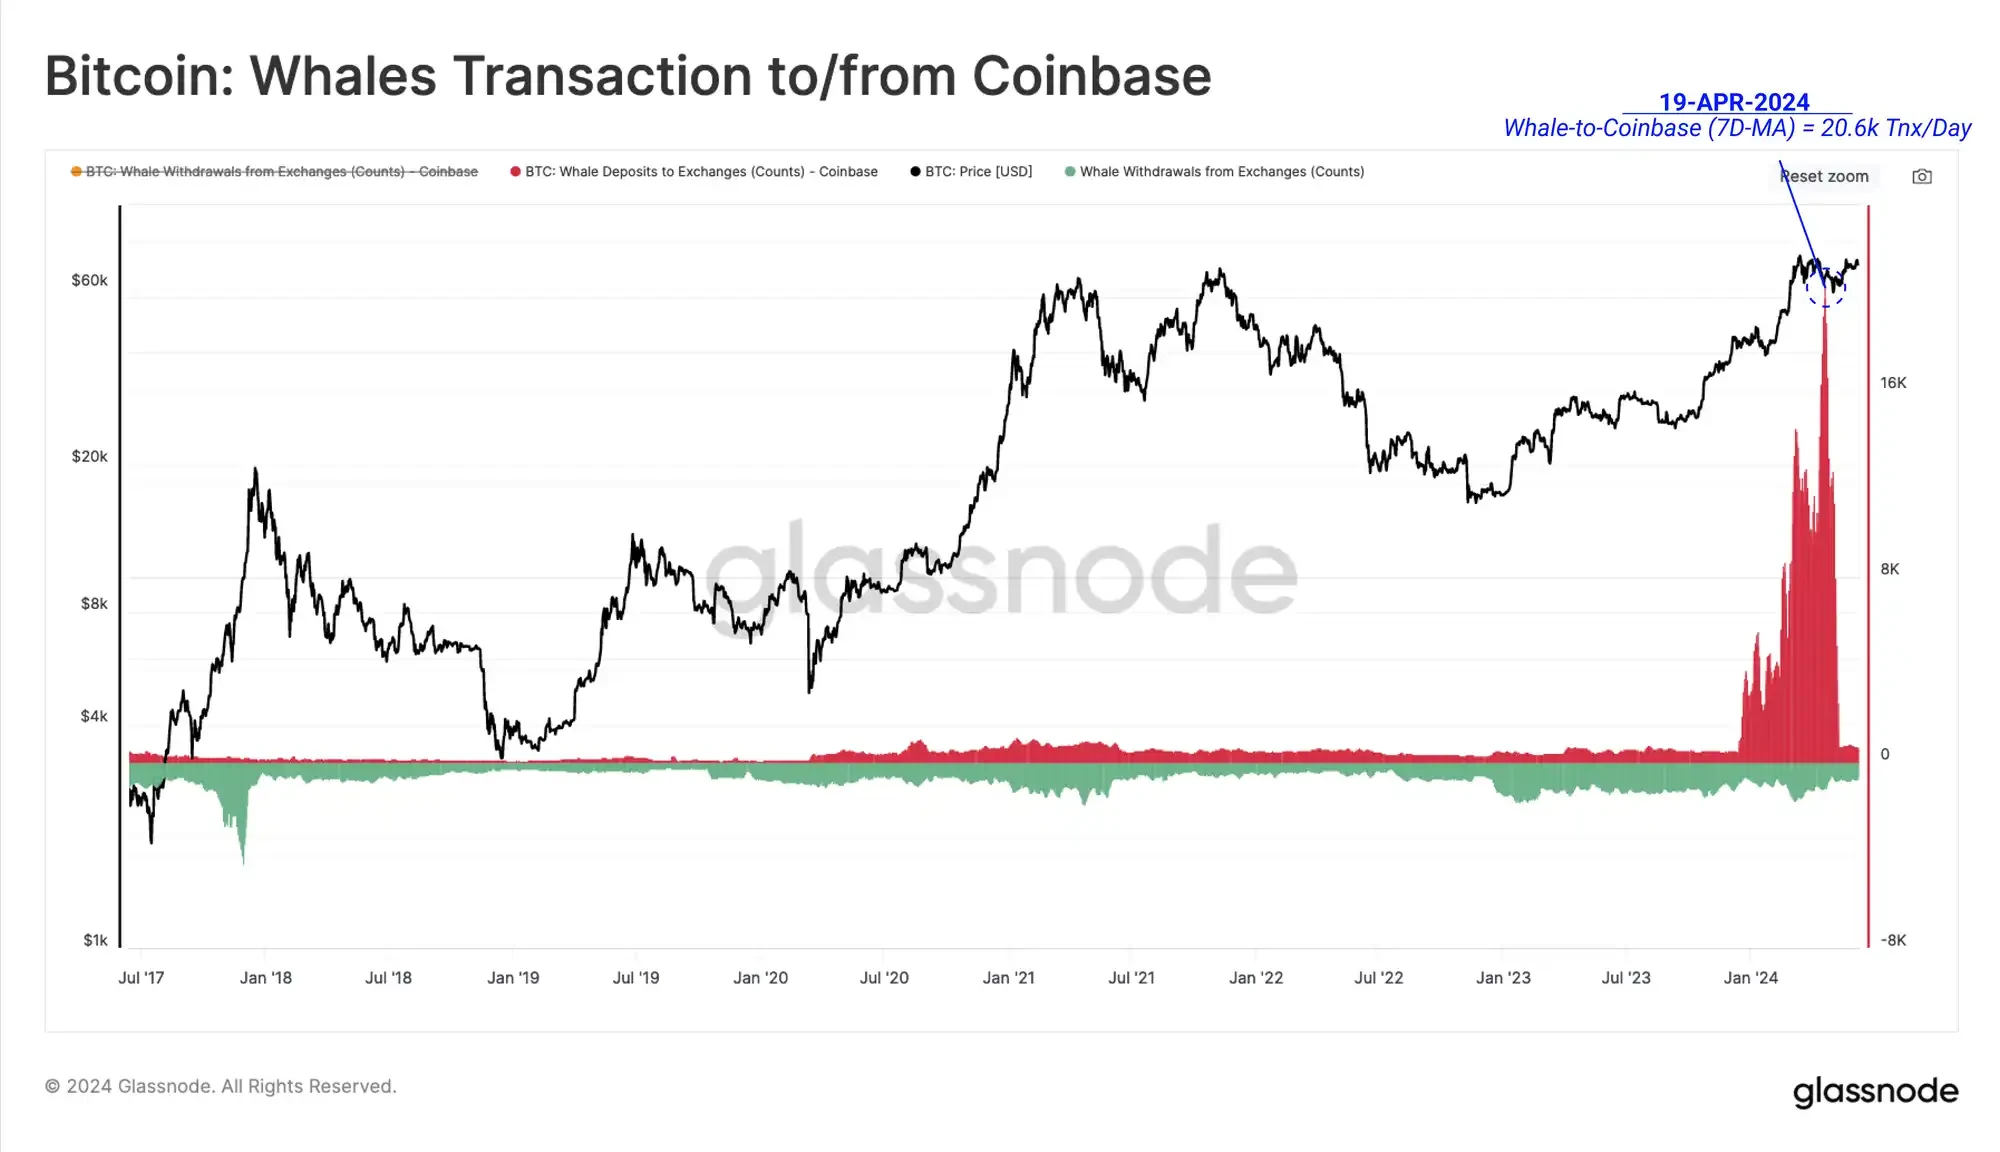
Coinbase as an entity holds a large portion of total exchange balances as well as US spot ETF balances through its custody service. The Coinbase exchange and Coinbase custody entity currently hold approximately 270,000 and 569,000 BTC respectively.
As Coinbase serves both ETF clients and traditional on-chain asset holders, the importance of exchanges in the market pricing process has become apparent. By evaluating the number of whales depositing to the Coinbase exchange wallet, we can see a significant increase in deposit volume after the launch of the ETF.
However, we note that a large portion of deposits are associated with outflows from the GBTC address cluster, which has been a long-standing supply overhead throughout the year.
In addition to the selling pressure on GBTC as the market rebounded to new highs, there is another factor that has recently led to weakening demand pressure for US spot ETFs.
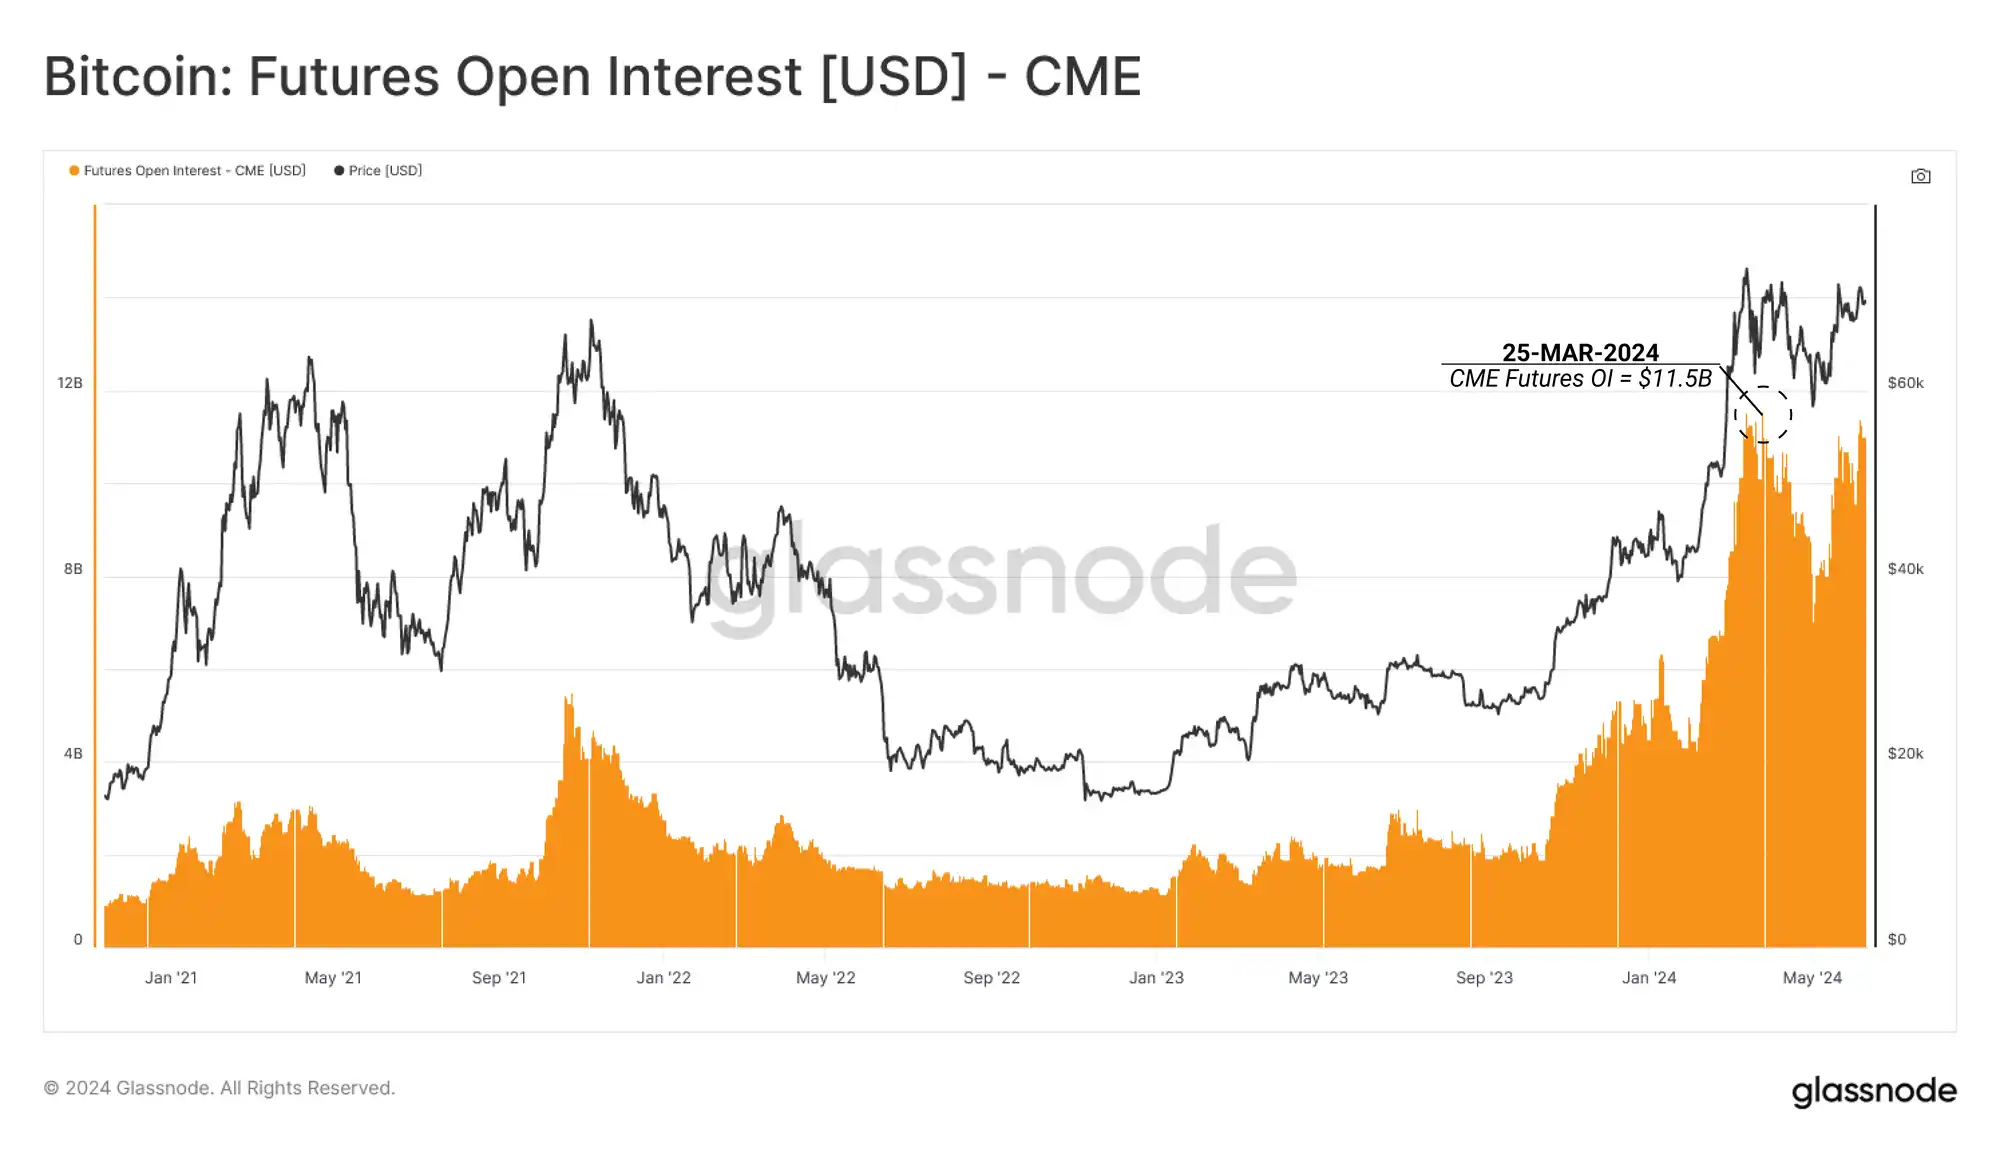
Looking at CME Group futures markets, open interest has stabilized above $8 billion, having previously hit an all-time high of $11.5 billion in March 2024. This could be a sign that more traditional market traders are adopting spot arbitrage strategies.
This type of arbitrage involves a market neutral position that combines the purchase of a long spot position with the sale (short) of a futures contract position on the same underlying asset that is trading at a premium.
We can see that entities classified as hedge funds are building larger and larger net short positions in Bitcoin.
This suggests that spot carry trade structures, where ETFs are vehicles for gaining long spot exposure, may be a significant source of demand for ETF inflows. CME Group has also seen a significant increase in open interest and overall market dominance since 2023, suggesting it is becoming a preferred venue for hedge funds to short futures through CME.
Currently, hedge funds have a net short position of $6.33 billion and $97 million in the CME Bitcoin and Micro CME Bitcoin markets, respectively.
Summarize
The huge discrepancy between activity metrics is accelerated by the extreme popularity of the Runes protocol, which exploits a large amount of address reuse, with a single address generating multiple transactions.
The emergence and size of spot arbitrage trades between long US cash ETF products and short futures through CME Group have largely dampened buy-side inflows into ETFs. This has had a relatively neutral impact on market prices, suggesting that organic buyers from non-arbitrage demand are needed to further stimulate positive price action.
This article is sourced from the internet: The inflow of US spot ETFs is astonishing, so why hasn’t BTC risen sharply?
Related: Ethereum (ETH) Remains Steadfast Toward a Rally to $4,000
In Brief Ethereum’s price is continuing its movement within the descending wedge, targeting a rally to $4,000. The net position change of ETH on exchange is synonymous with the initiation of rallies noted in the past. The MVRV Ratio dictates that ETH is in an ideal buying zone, which could help Ethereum escape the wedge. Ethereum (ETH) price witnessed a fate similar to the rest of the crypto market when the altcoin slipped below $3,000. This, however, has only further validated the bullish pattern ETH has been stuck in. Closing in on a potential breakout in the next few trading sessions, the altcoin is exhibiting the ideal conditions for accumulation. Ethereum Selling Slows Down Investors need to exhibit optimism for a substantial bounce back in Ethereum’s price, as seen in parts of…
