
在达到 $0.43 左右的支撑位后,XRP 价格出现了强劲反弹。至于瑞波币是否会继续上涨,很大程度上取决于市场情绪、更广泛的加密货币趋势以及瑞波币特有的任何基本面发展等因素。
虽然最近从支撑位反弹是一个积极信号,但监测 XRP 在未来几天的表现以及它是否能够维持上涨势头至关重要。
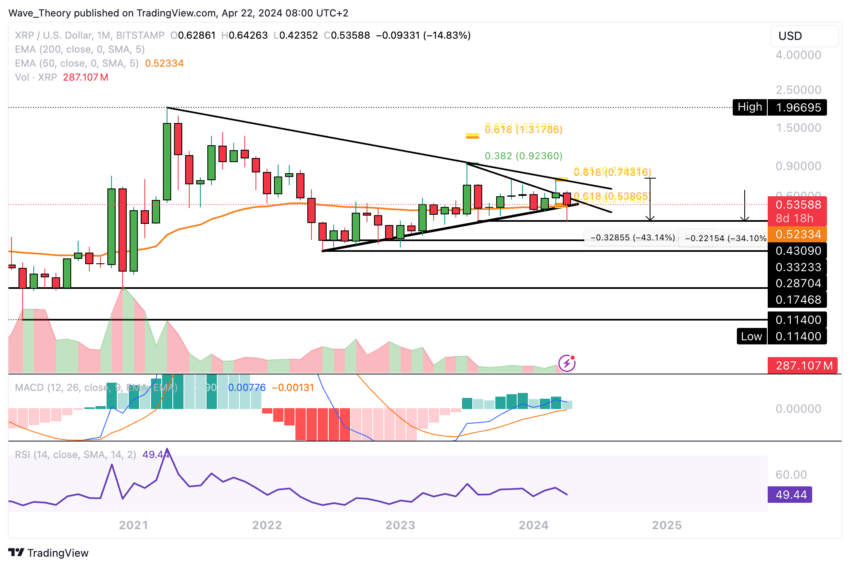
XRP 价格在近期调整中跌至 $0.43
瑞波币价格近期回调至 $0.43 左右的低点,并在此获得重要支撑,随后强势反弹。尽管瑞波币从近期高点下跌约 43%,但其仍表现出强劲的韧性,实现强劲反弹。
瑞波币已回升至黄金比率 $0.52 附近的 50 个月 EMA 上方,如果在月底前维持这一水平,则表明看涨趋势将继续。然而,值得注意的是,月线图上的移动平均收敛/发散指标 (MACD) 线仍呈看涨交叉,相对强弱指数 (RSI) 仍处于中性区域。
相反,MACD直方图本月已开始呈走低趋势,表明存在一些看跌压力。
阅读更多:现在最值得购买的加密货币:2024 年 4 月最值得关注的加密货币
总而言之,虽然最近从支撑位反弹令人鼓舞,但瑞波币的短期价格走势对于决定其是否能够维持上涨势头并恢复看涨轨迹至关重要。
每周 MACD 图上的看跌信号
在瑞波币的周线图中,我们观察到 MACD 线最近出现看跌交叉,并且 MACD 柱状图已连续数周呈看跌趋势下降。同时,RSI 目前处于中性区域。
瑞波币在 $0.545 和 $0.62 附近遭遇显著的斐波那契阻力位。突破 $0.62 黄金比率阻力位将标志着瑞波币修正阶段的结束,有可能恢复上升趋势。在这种情况下,瑞波币可能瞄准 $0.75 附近的进一步阻力位。
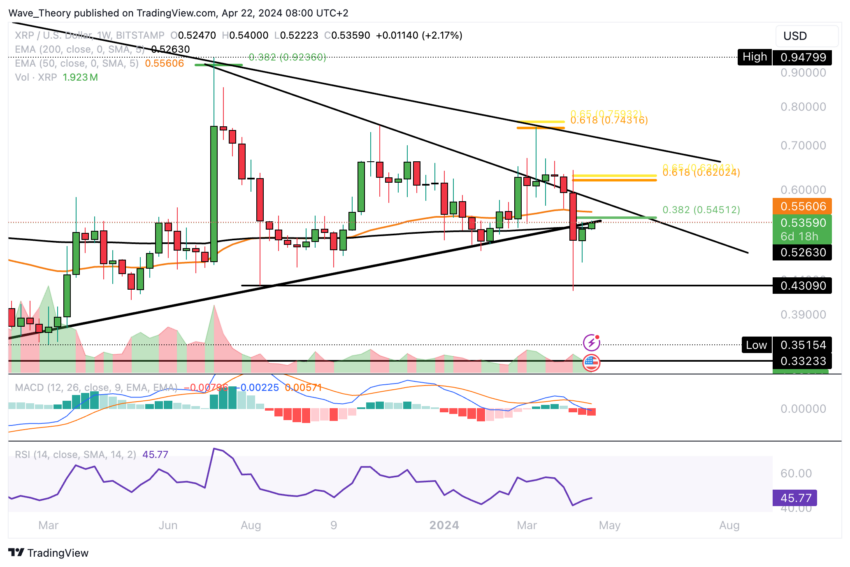
然而,修正走势可能会持续,直到这些阻力位被有效突破。交易员和投资者可能会密切关注瑞波币的价格走势,以评估它是否能克服这些障碍并恢复上升轨迹。
Ripple 的日线图分析中出现死亡交叉
在瑞波币的日线图中,EMA 中可能出现死亡交叉,预示着短期至中期看跌趋势。然而,如果当前的上涨势头持续下去,它可能会使死亡交叉失效,并可能导致黄金交叉。
尽管如此,当前斐波那契阻力位 $0.545 附近的看跌拒绝可能预示着进一步下跌。
从 MACD 来看,柱状图已连续几天走高,MACD 线接近看涨交叉,表明可能转向看涨势头。同时,RSI 保持中性,缺乏看涨或看跌情绪的明确信号。

交易者应密切关注阻力位附近的价格走势,以确认瑞波币价格是否进一步看涨或看跌。
Ripple 的 4 小时 EMA 图表确认了死亡交叉
在瑞波币的 4 小时图中,EMA 确实形成了死亡交叉,表明短期内看跌趋势。不过,值得注意的是 MACD 显示出看涨趋势。
MACD 线目前以看涨方式交叉,并且 MACD 直方图也以看涨方式走高。
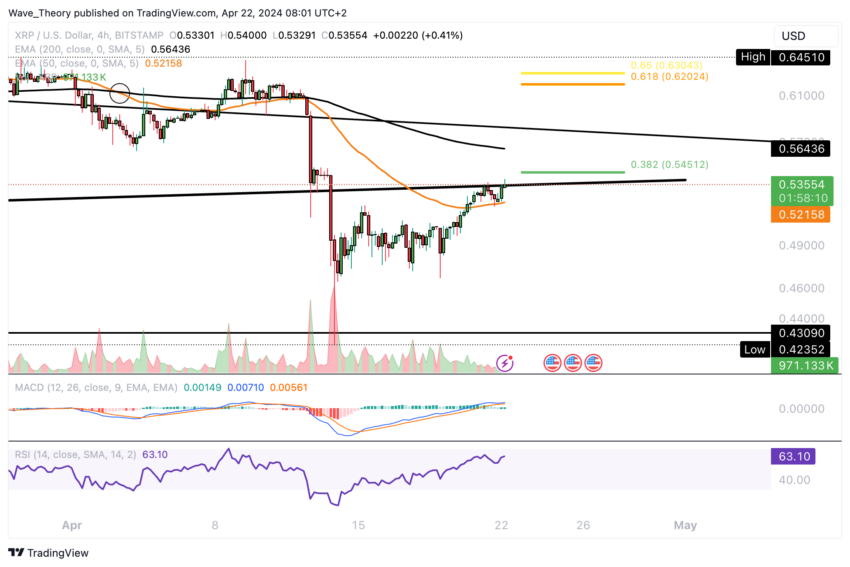
尽管 MACD 中存在这些看涨迹象,但 RSI 仍保持中性,缺乏看涨或看跌情绪的明确信号。交易者可能需要密切关注价格走势,以进一步确认瑞波币价格的当前趋势。
XRP 兑比特币价格持续下跌
瑞波币的价格确实一直在经历相对于比特币的明显下跌趋势。瑞波币相对于比特币的关键支撑区域在 0.0000062 BTC 左右。
此外,技术指标也有一些积极迹象。MACD 柱状图显示看涨势头,MACD 线可能出现看涨交叉。此外,RSI 目前处于超卖区域,并显示看涨背离,表明下行趋势可能出现逆转。
了解更多:Ripple (XRP) 价格预测 2024/2025/2030
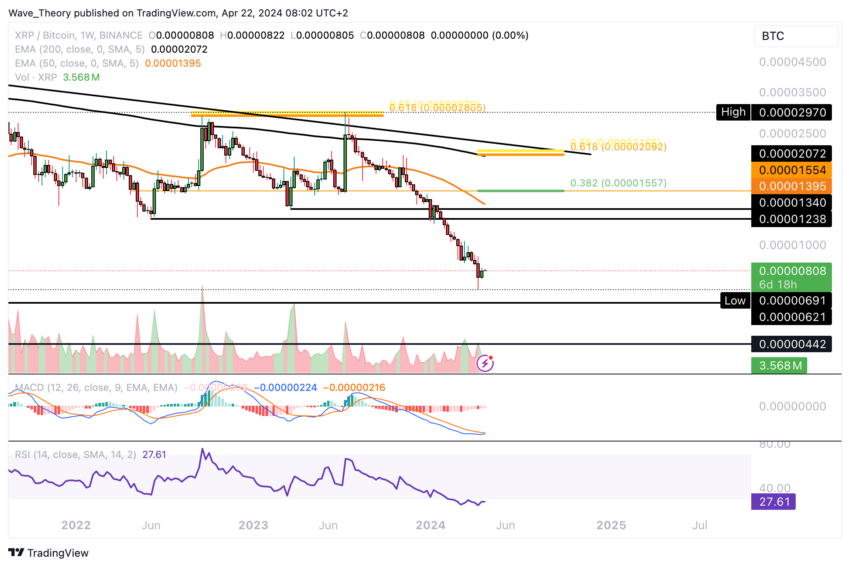
然而,从上行方面来看,瑞波币在 50 周 EMA 约 0.00001395 BTC 处面临巨大阻力,进一步阻力位于约 0.00001238 BTC 和 0.0000134 BTC 之间。交易者应仔细监控这些水平,以寻找潜在的突破或逆转机会。