Key indicators (November 11, 4 p.m. – November 18, 4 p.m. Hong Kong time)
-
BTC/USD price increased by 13.0% (81.2k-91.75k USD), ETH/USD price decreased by 0.3% (3.14k-3.13k USD)
-
BTC/USD ATM volatility at the end of December increased by 5.2 points (51.8->57.0), and the skewness on December 25th increased by 2.7 points (3.2->5.9)
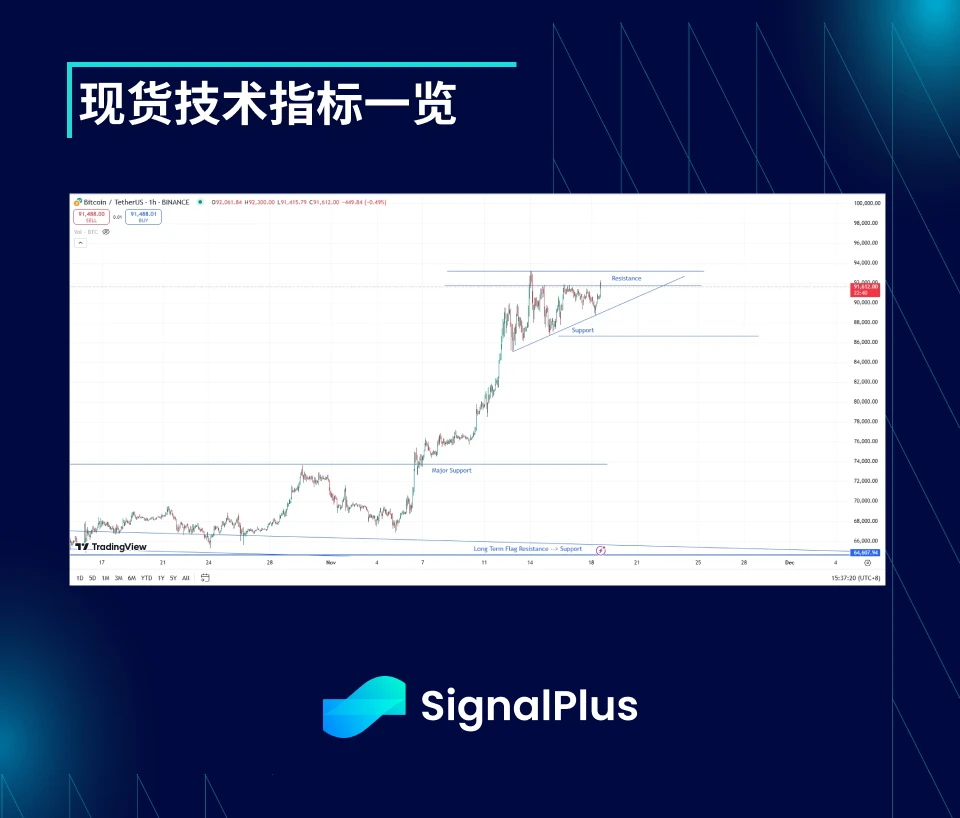
Spot technical indicators at a glance

The market started to accelerate upwards this past week, and any initial signs of overbought were eventually replaced by strong momentum. The market should have accumulated a lot of Gamma around 90k, because the market was initially blocked at this point many times, and then tried to break through upwards and finally reached 93.25k. At present, 91.75k-93.5k will be our top resistance level.
Referring to the chart above, the first support level is a diagonal support slightly below the current price level, which will continue to exert pressure to 指导 the market to test the price high. If the price completely breaks down this support level, we will find good support around $85k-86.25k again. But further down we expect to see a wave of violent position liquidation.
The daily and hourly ranges have already started to show signs of contraction. If the price fails to break above $93.5k, we would expect to see realized volatility adjust downwards. We remain bullish in the long term and reasonably expect a target of $105k-115k in Q1 of next year. But in the meantime, we expect the market to stabilize and take a short break over the next 6 months. If we see stronger evidence of a contraction in the range (at least in the short term) in the next week or two, this view will be confirmed and begin to put pressure on Gammashi positions.
市场 Theme
The “Trump trade” continued in full force this week. The USD continued to rise against other fiat currencies, while US Treasury yields continued to climb. Cryptocurrencies once again showed no correlation with the USD. Bitcoin surged to over $90k, while other small coins also saw amazing gains. US stocks had a good week and saw a sharp drop in the VIX index, before taking a break over the weekend. But this was just a small correction in this bull trend.
The focus has now turned to Trumps cabinet picks, with 加密货币 eyes focused on the upcoming announcement of the Secretary of the Treasury. Scott Bessant initially looked like the most likely candidate, but Elon Musk endorsed Howard Lutnick over the weekend. Both could be considered crypto-friendly, though Lutnick is more so. However, it looks like the final pick is still a ways off, as Kevin Walsh and Mark Rowan have been added to the list in the past 24 hours.
It looks like there is continued demand after MSTR announced it bought over 27,000 BTC around the election, as the company’s shares are still trading at their highest point, with a 2.5x net asset premium to the spot price of Bitcoin. BTC/USD has been well supported on every pullback, and even with ETF outflows from ARKB and BITB on Thursday and Friday, the price still managed to re-enter $90k over the weekend.
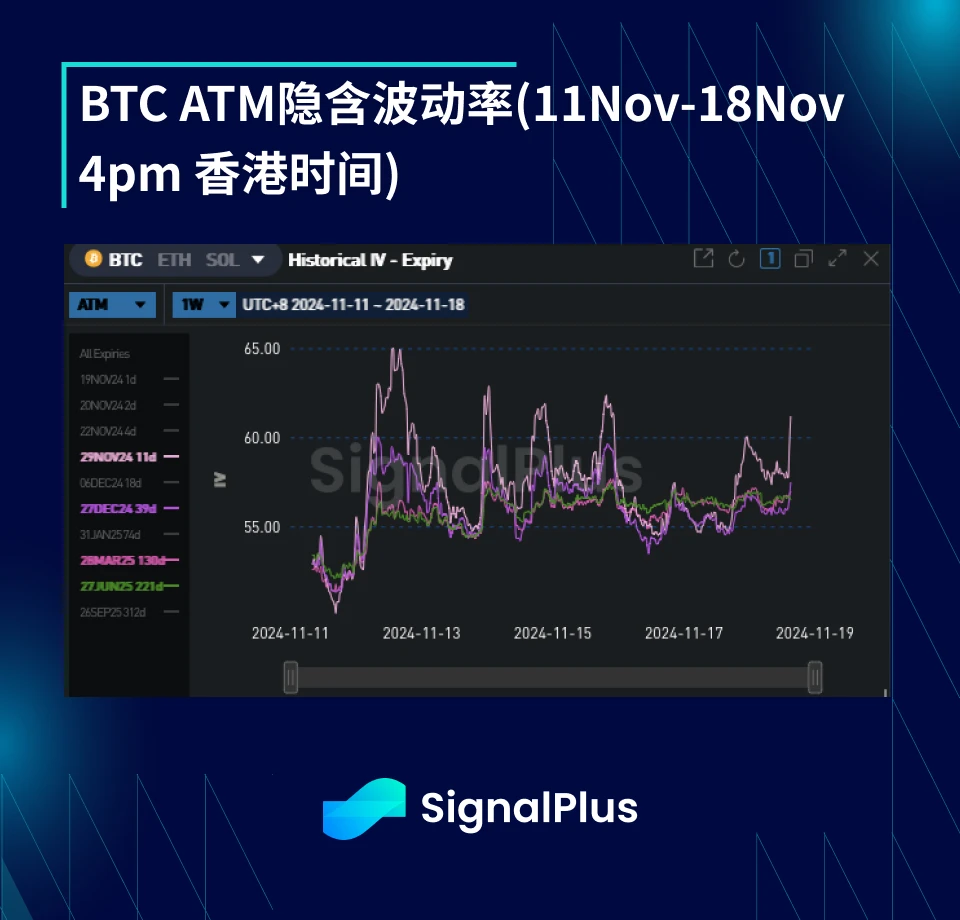
ATM 隐含波动率

-
After the price of the coin broke through the resistance level of 80k-82k USD on Monday night, it continued to rise, and the implied volatility level rose sharply. As the market reached the level of 93k USD, the high-frequency actual volatility was pushed to the 60s, and then the price of the coin returned to the range of 87k-93k USD with a rather violent oscillation level.
-
The volatility of the currency price came earlier than the market expected, and at the same time, the rapid increase in actual volatility caused the volatility term structure to invert rapidly. The ATM implied volatility on 29 Nov rose from a low of 47-48 10 days ago to a high of 65. The volatility levels farther out on the curve were also dragged up in a time-weighted manner.
-
There is a structural argument that volatility will gradually weaken in the new situation. If Trump succeeds in pushing for regulation of cryptocurrencies, a large amount of funds will flow in and eventually provide support for the price of the currency, further reducing volatility. Moreover, the current price level has already taken this into account to a large extent. Although the price of the currency is still fluctuating sharply, the actual volatility is still not above the 60s, and the implied volatility of the same-day expiration continues to range from the lowest 50s to the highest 60s (the average level this year is 45-50). But for now, bullish momentum has stimulated demand for the 100k-150k price range from the end of the year to the end of January next year, while providing support for implied volatility.
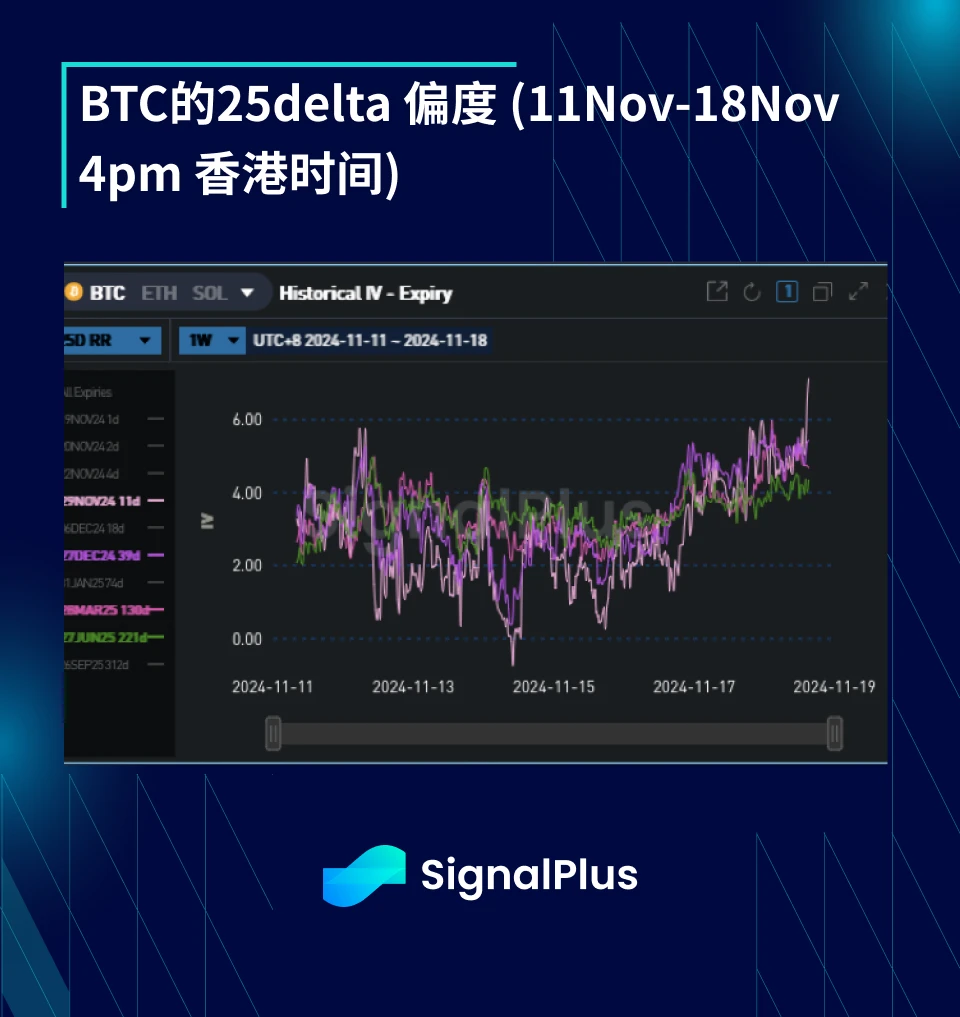
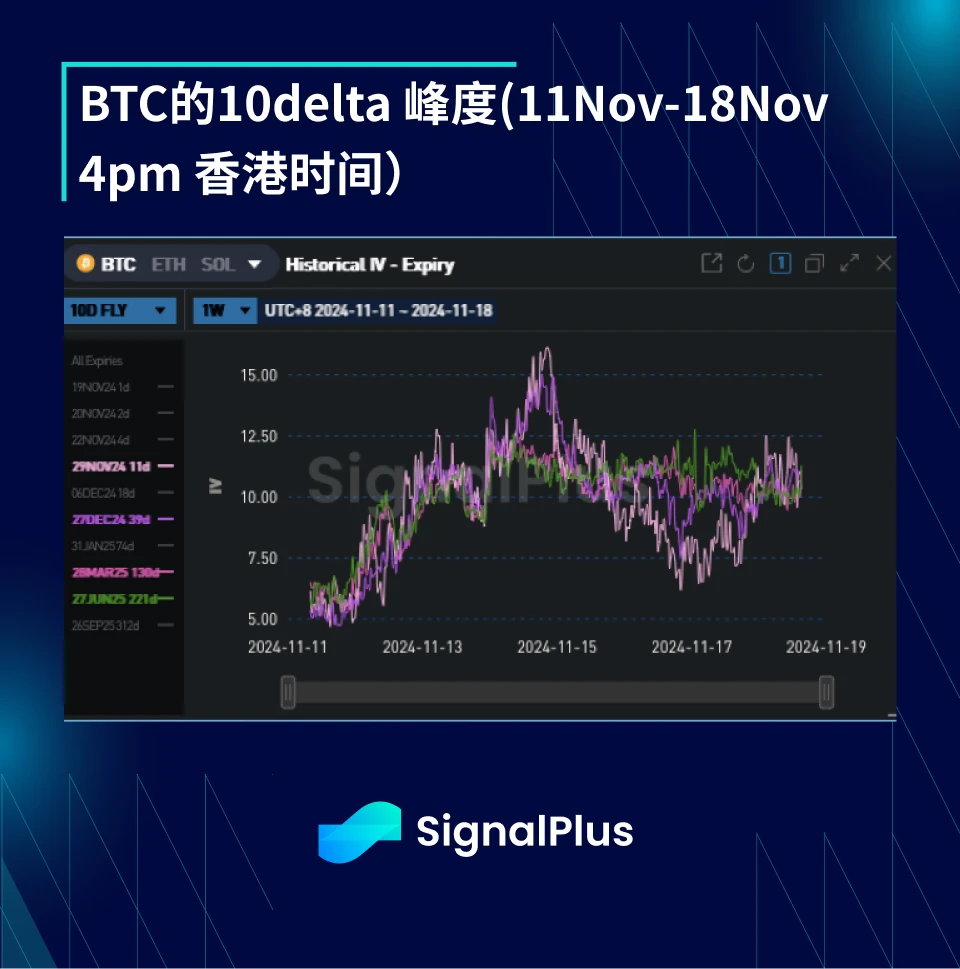
Skewness/Kurtosis


-
Skewness continued to rise this week (mostly on the bullish side), mainly because the market is eagerly waiting for the price to break further upward. Implied volatility continues to show a positive correlation with the price. When the price fell to the 87-88k range, the implied volatility was suppressed across the curve, but sellers quickly withdrew whenever the price tried to break through the 91.5k-93.5k USD range again. In addition, the closing of in-the-money call spreads and rolling positions also drove the skewness up.
-
As realized volatility moves faster, the kurtosis also increases significantly. This week we observed an increase in demand for upside wings, especially above $100k. We also saw some demand for downside wings in the shorter term, mainly for spot or margin protection.
祝大家在接下来的一周里好运!

您可以使用 SignalPlus 交易风向标功能 t.signalplus.com 获取更多实时加密资讯,如想第一时间收到我们的更新,请关注我们的推特账号@SignalPlusCN,或加入我们的微信群(添加助手微信号:SignalPlus 123)、Telegram群、Discord社群,与更多朋友交流互动。
SignalPlus 官方网站: https://www.signalplus.com
This article is sourced from the internet: BTC Volatility Weekly Review (November 11-November 18)
相关:Matrixport 市场观察:BTC 受阻探底 $70,000 压力位,以及美国大选的不确定性
近一周,BTC终于突破前期压力位,进入$67000-$69000区间,21日突破$69000,最高触及$69519,虽然当天受阻回落至$66571,但随着市场逢低建仓,BTC重新回到$67000上方。截至本文发稿,BTC价格在$67185附近震荡(以上数据来源于币安现货,10月22日15:00)。目前BTC在$70000附近有较强阻力,短期价格走势较为温和。但随着美国大选临近,特朗普效应逐渐显现以及市场提前布局,BTC若成功突破阻力位,则有望挑战……


