
本报告所提及的关于市场、项目、货币等的信息、观点和判断仅供参考,不构成任何投资建议。
In 2024, global macro-finance will reach a turning point amid turmoil.
With the 50 basis point drop in September, the US dollar entered a rate cut cycle. However, with the US presidential election and global geopolitical conflicts, US economic employment data began to be distorted, which increased the differences among traders on the future market. The US dollar, US stocks, and US bonds all experienced sharp fluctuations, making short-term trading increasingly difficult.
The differences and concerns were reflected in the U.S. stock market as the three major indexes all fluctuated violently without direction. On the contrary, BTC, which lagged behind in the rise, caught up in October, soaring 10.89%, and made a major breakthrough in technology, taking down multiple important technical indicators in one fell swoop and approaching the upper edge of the new high consolidation zone again, once reaching $73,000.
BTCs internal structure remains perfect and is ready for a complete breakthrough, but it is still suppressed by the U.S. stock market, which is trapped by the uncertain prospects of the election. But the election is just an episode and will not change the cycle. We believe that after the November election, after the necessary conflicts and choices, the U.S. stock market will resume its rise. If so, BTC will break through the historical high and start the second half of the 加密货币 asset bull market.
Macro Finance: US Dollar, US Stocks, US Bonds and Gold
In October, after falling for three consecutive months, the US dollar index unexpectedly rebounded sharply by 3.12%, rising from 100.7497 to 103.8990, returning to the level of January last year. The reason behind this rebound was Trumps victory. Traders believed that Trumps election would intensify the decoupling between China and the United States, push up inflation, and make it difficult to smoothly implement interest rate cuts. We believe that this rebound has exceeded expectations and priced in the expectation of slowing interest rate cuts, so the rebound of the US dollar index is unsustainable.
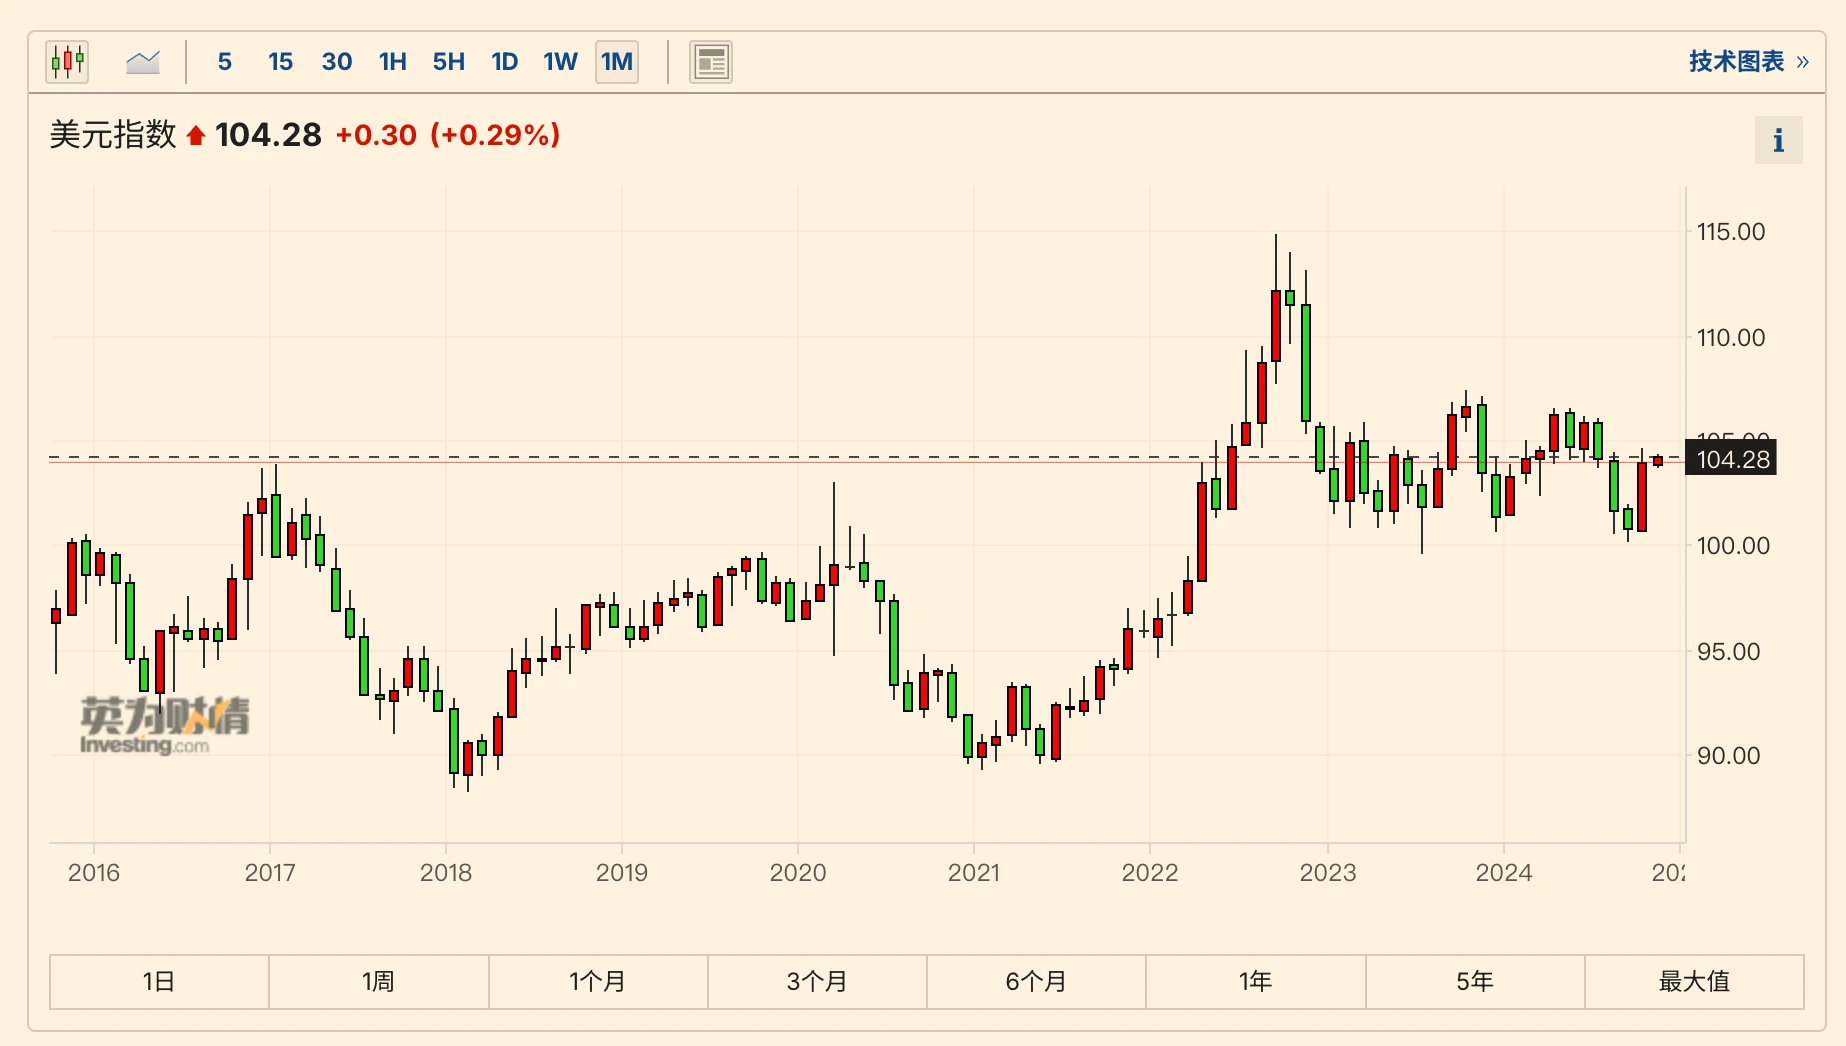
Monthly trend of US dollar index
The expectation of tax cuts and decoupling between China and the United States in Trumps economic policy will inevitably lead to a further increase in the size of US debt. As the probability of Trumps victory increases, the yield of 2-year US Treasury bonds has risen by 14.48% after falling for 5 consecutive months, and the yield of 10-year bonds has risen by 13.36%. The selling of US debt is very serious.
At present, U.S. stocks are traded around two main lines: whether Trump or Harris will be elected, the divergence in asset trends that may be caused by their economic policies, and whether the U.S. economy will have a soft landing, a hard landing, or no landing.
The low CPI and unemployment rates in October have made people more and more confident that the economy is heading for a soft landing, which has kept the US stock market near its historical highs. However, the ultra-low non-farm payrolls data and the fact that the pricing was completed in advance and the election was undecided have caused traders to lose their trading direction. The Q3 financial reports of the Big 7 have been released one after another, with mixed results. Against this backdrop, the Nasdaq fell after hitting a new high in the middle of the month, down 0.52% on the month, and the Dow Jones fell 1.34% on the month. Considering the sharp rebound in the US dollar index, this is a good result.
Only gold has received support from safe-haven funds, with London gold rising 4.15% to $2,789.95 per ounce. The current strength of gold comes not only from safe-haven funds, but also from the continued increase in holdings by central banks of many countries (replacing part of the US dollar as a value reserve for their own currencies).
Crypto assets: Effective breakthrough of two major technical indicators
In October, BTC opened at $63,305.52 and closed at $70,191.83, up 10.89% on a monthly basis, with an amplitude of 23.32% and a moderate increase in volume. This is the first time that the price has risen for two consecutive months since the adjustment in March.
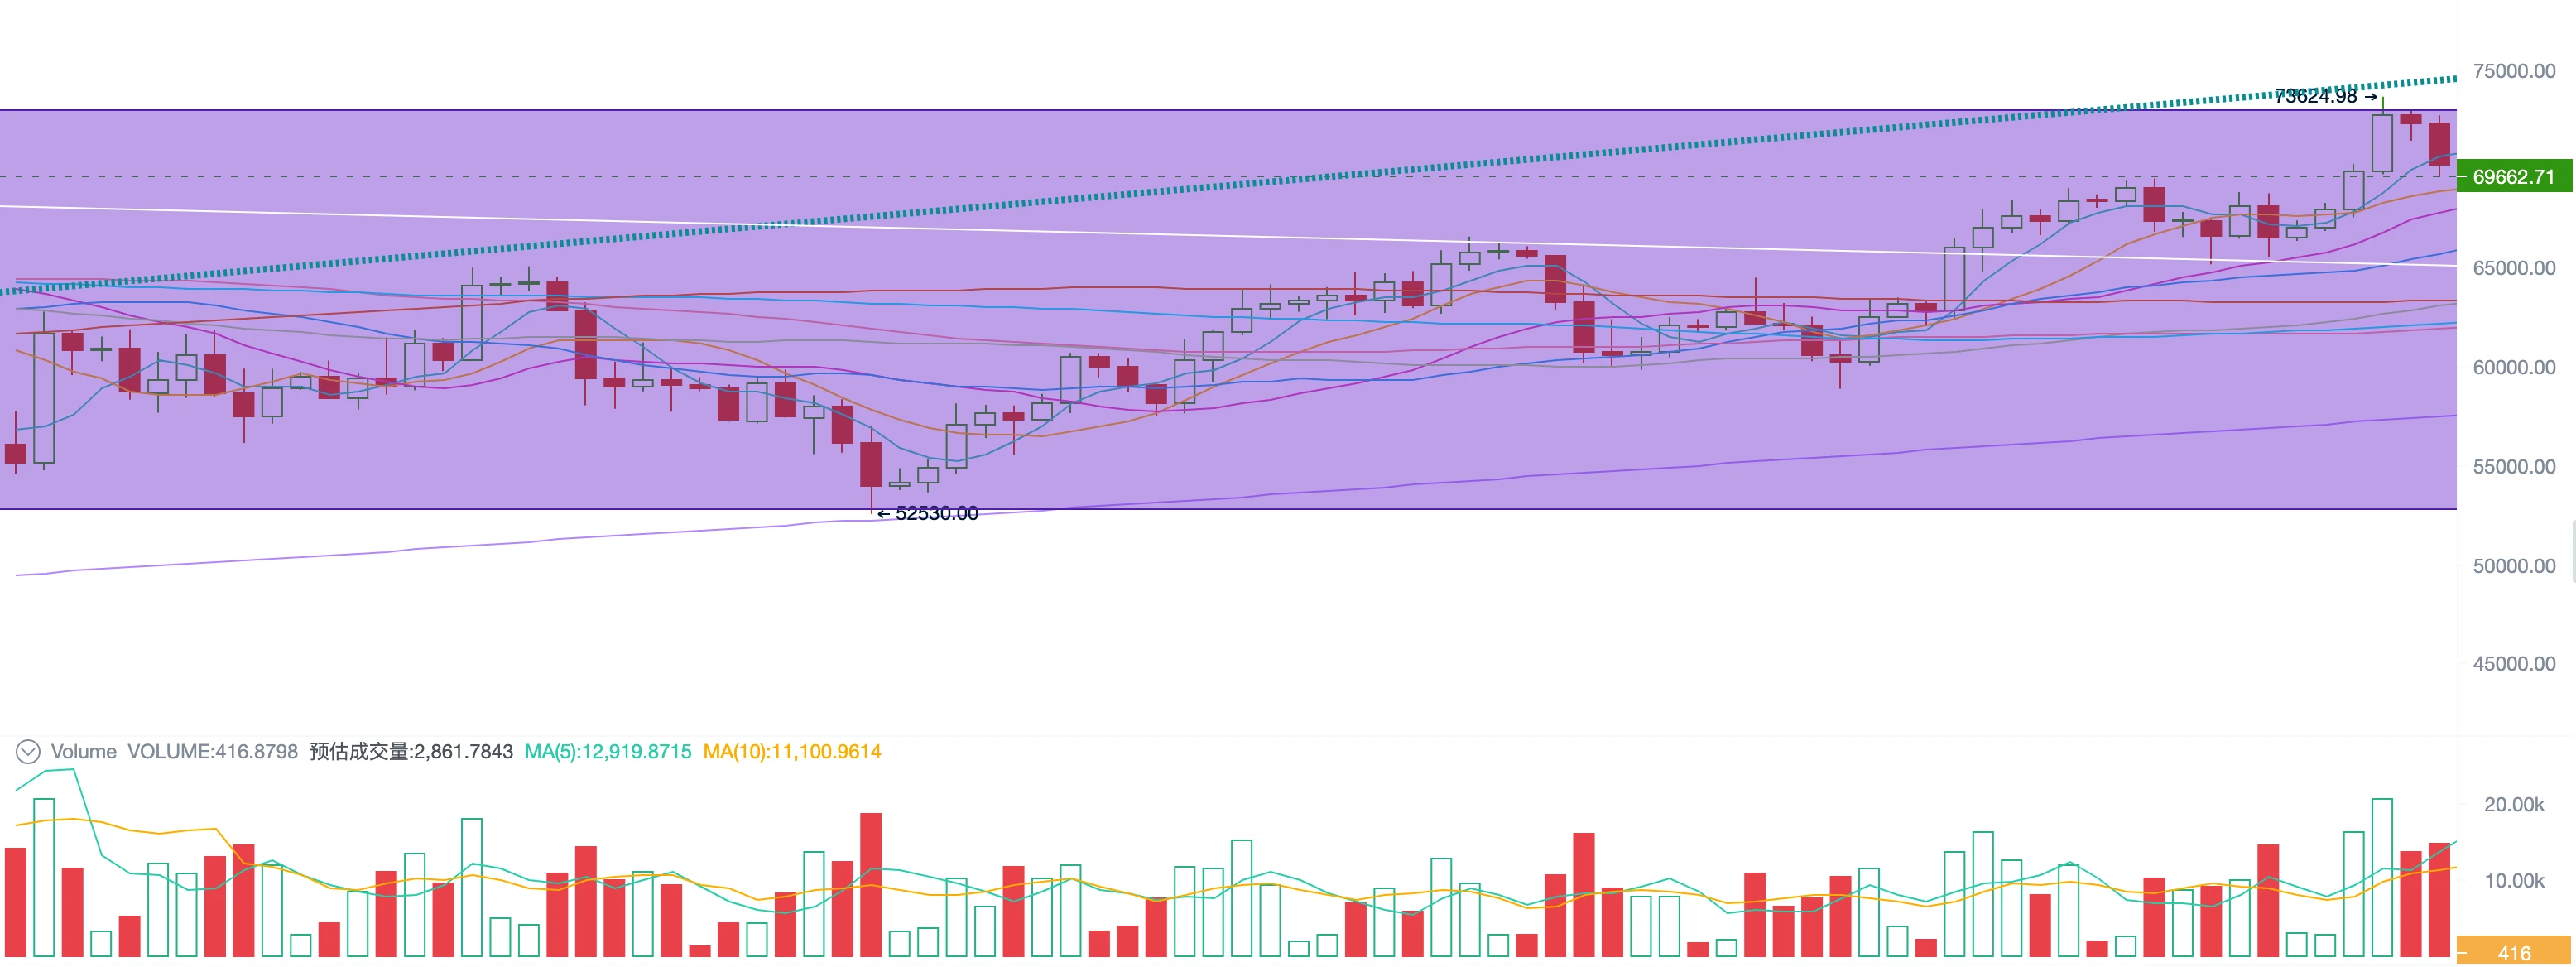
BTC每日走势
In terms of technical indicators, BTC has achieved several major breakthroughs this month; it has effectively broken through the 200-day moving average and the downward trend line since March (white line in the above figure). The breakthrough of these two major technical indicators means an improvement in the long-term trend, which can temporarily eliminate the doubts about the crypto market turning bearish.
At present, the market is in the stage of retreating after testing the upper edge of the new high consolidation zone. Next, we focus on two technical indicators, one is the upper edge of the new high consolidation zone (US$73,000) and the rising trend line (currently about US$75,000). In previous reports, we emphasized that an effective breakthrough of the new high consolidation zone means the end of the long consolidation of 8 months, and re-entering the rising trend line means the arrival of a new market (the second wave of the bull market, i.e. the main rising wave).
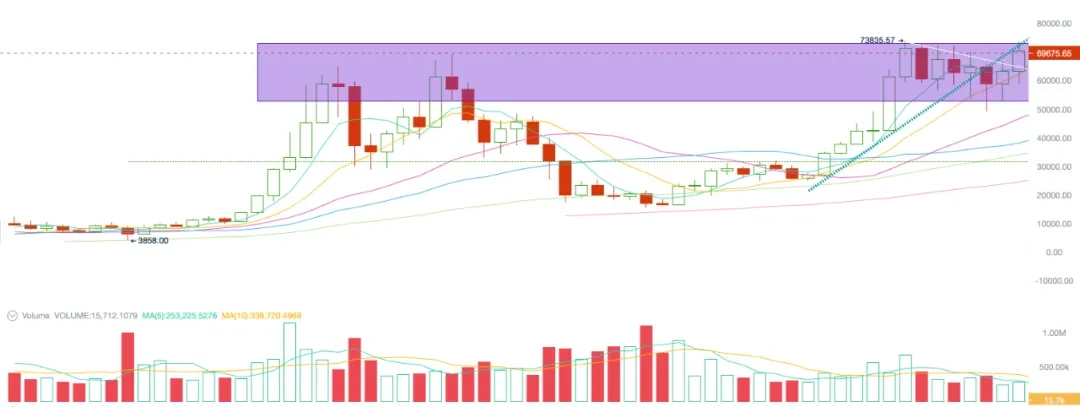
BTC月度趋势
On the monthly chart, we can see that the low price of BTC has continued to rise since August. This turning point is based on two points: the continuous improvement of global liquidity since the interest rate cuts by the Federal Reserve, the European Union and China, and the internal adjustment of crypto assets, that is, the conclusion of the short to long structure of holding coins.
Long-short game: Increased liquidity may trigger the start of a second wave of selling
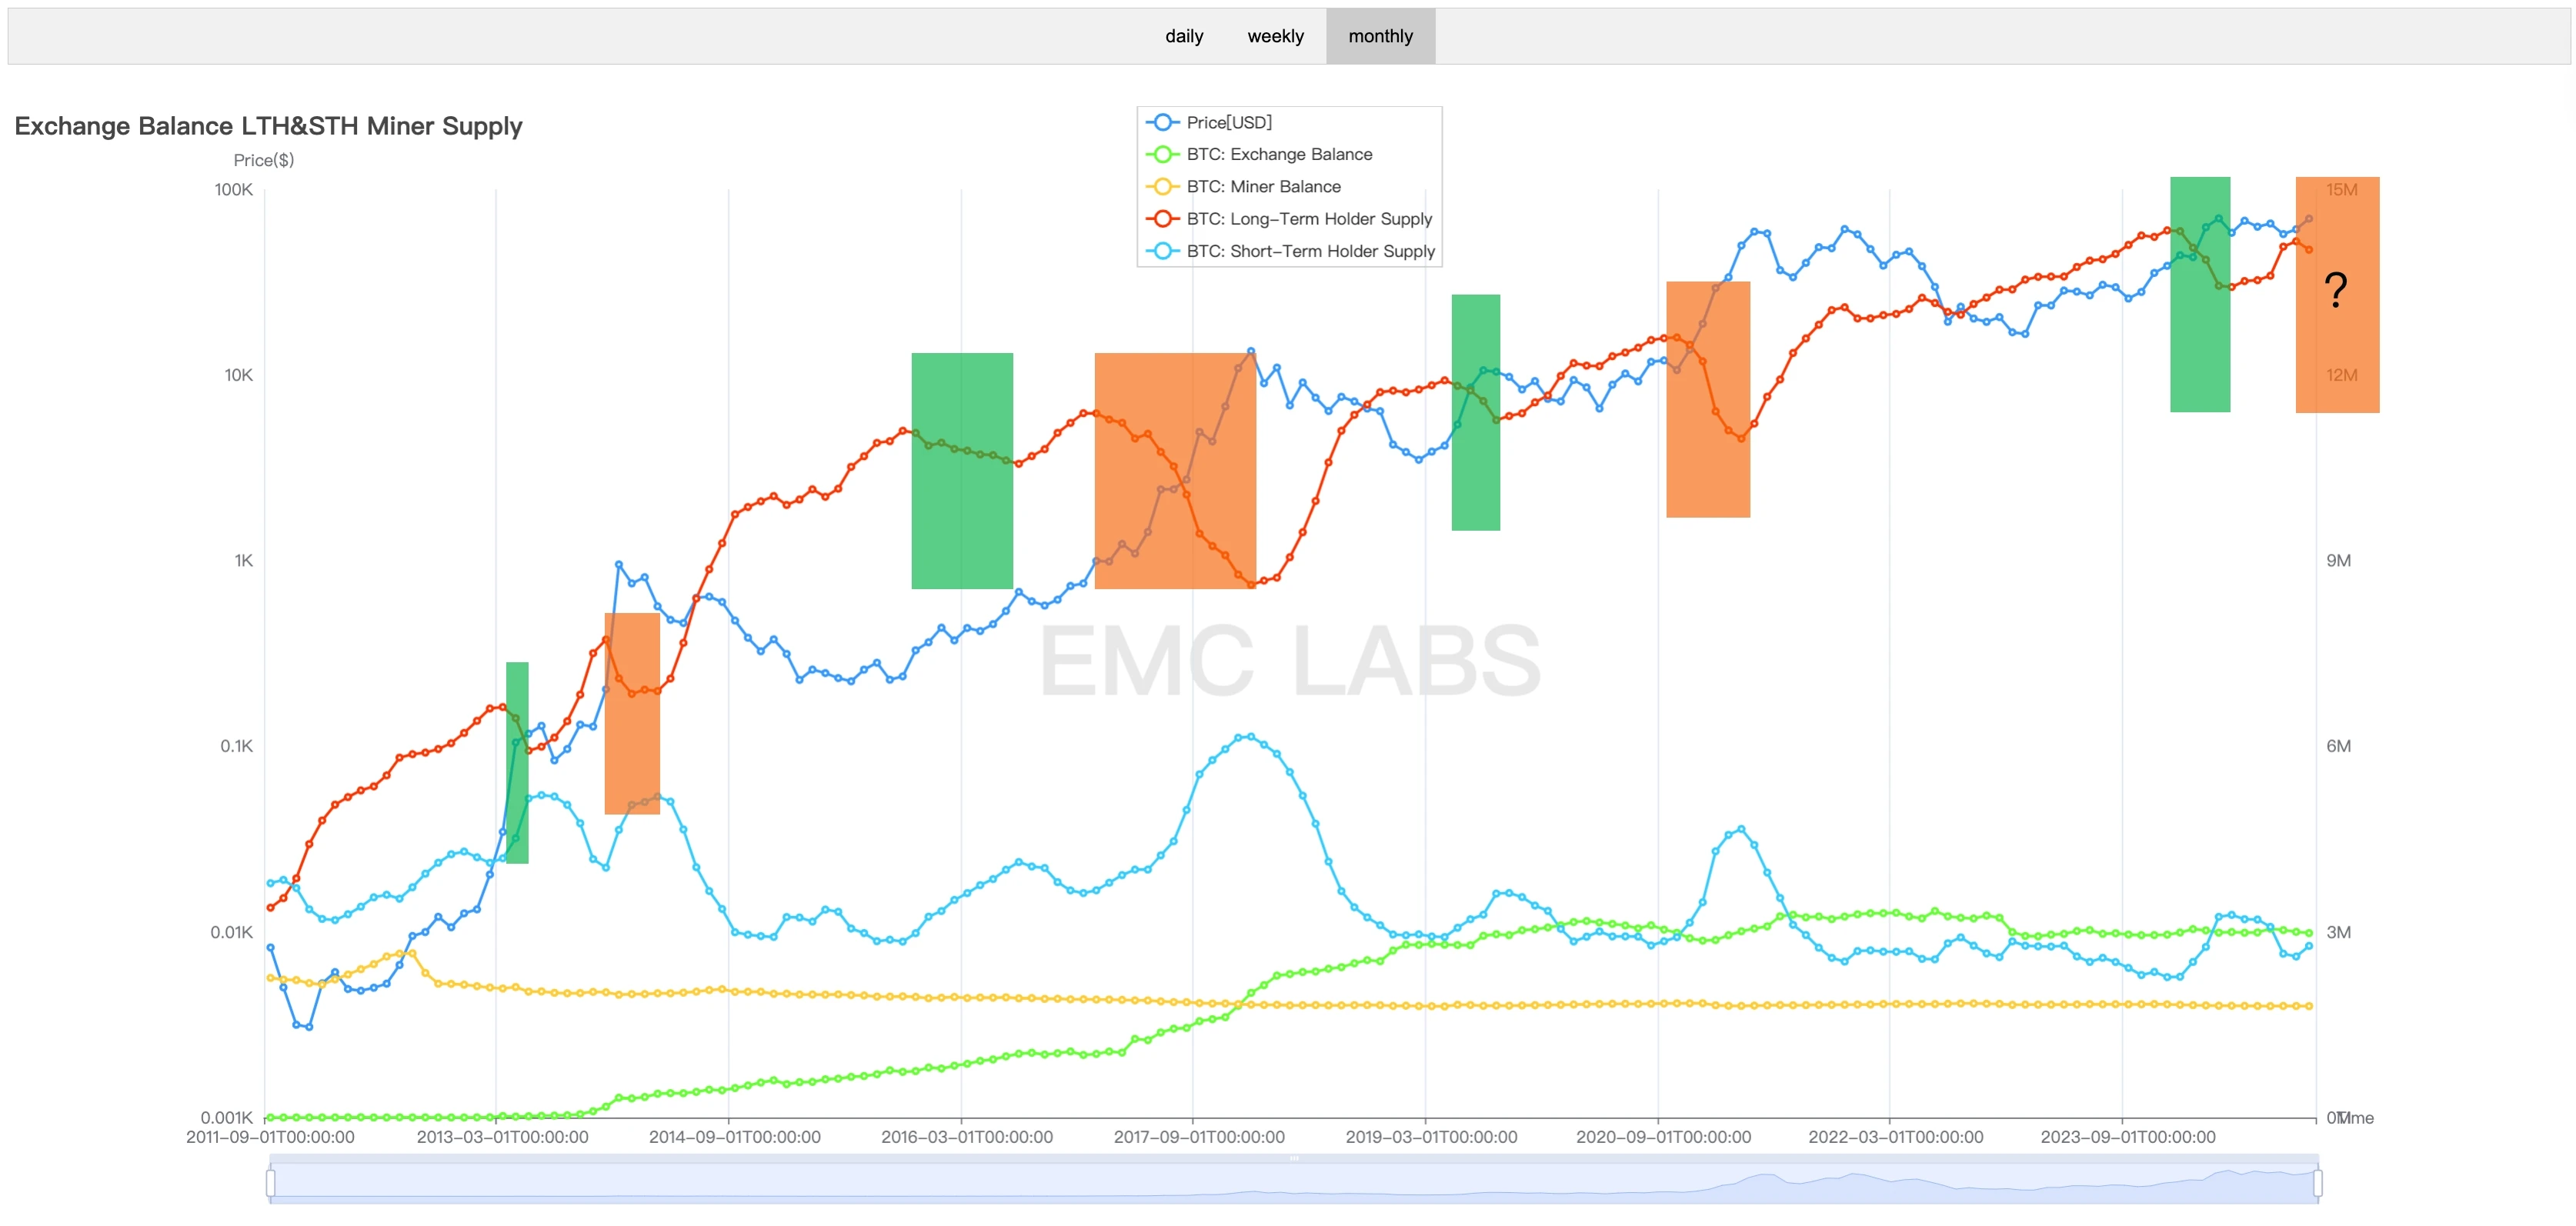
Long, short, CEX and Miner BTC holdings distribution (monthly)
In a previous report, EMC Labs pointed out that as the bull market of crypto assets unfolds and adjusts, long holders will experience two rounds of selling and throw the chips accumulated during the market downturn back into the market.
In this cycle, the first wave of long-term selling started in January and ended in May, and then turned to re-accumulation until October. The Fed cut interest rates for the first time in September, and the liquidity of the crypto market improved. Long-term holders began to sell again, pushing the holding structure from long to short. The scale of selling this month is close to 140,000 coins.
This is the result of the Feds interest rate cuts to improve liquidity, and it is also a necessary stage in the cycle. Of course, we need more time to confirm the sustainability of this sell-off. Overall, we tend to think that the second wave of sell-offs has begun. Unless the Feds interest rate cuts change direction, this process will continue in the medium and long term.
This is accompanied by the continued strengthening of market liquidity.
Liquidity Enhancement: Buying Power Comes from BTC ETF Channel
For the crypto market, the start of the interest rate cut cycle is of great significance. To some extent, the upward momentum of BTC last year came from the expectation of interest rate cuts and the early pricing of the opening of the BTC ETF channel. The adjustment since March can also be understood as a market correction before the start of the interest rate cut.

Monthly statistics of capital inflow and outflow in the crypto asset market (Stablecoins + BTC ETF)
This judgment is based on our statistics on the inflow and outflow of funds in the BTC ETF channel. From the above chart, we can see that after March, the funds in this channel showed signs of slowing down inflow or even outflow. This downward trend improved in October.
EMC Labs monitors that in October, 11 BTC ETFs in the United States recorded a total of $5.394 billion in inflows, the second largest inflow month on record, second only to $6.039 billion in February this year. This large inflow provides fundamental impetus for BTC prices to challenge previous highs.
Stablecoin channel funds performed very weakly in October, with only US$47 million in inflows for the entire month, recording the worst monthly performance so far this year.
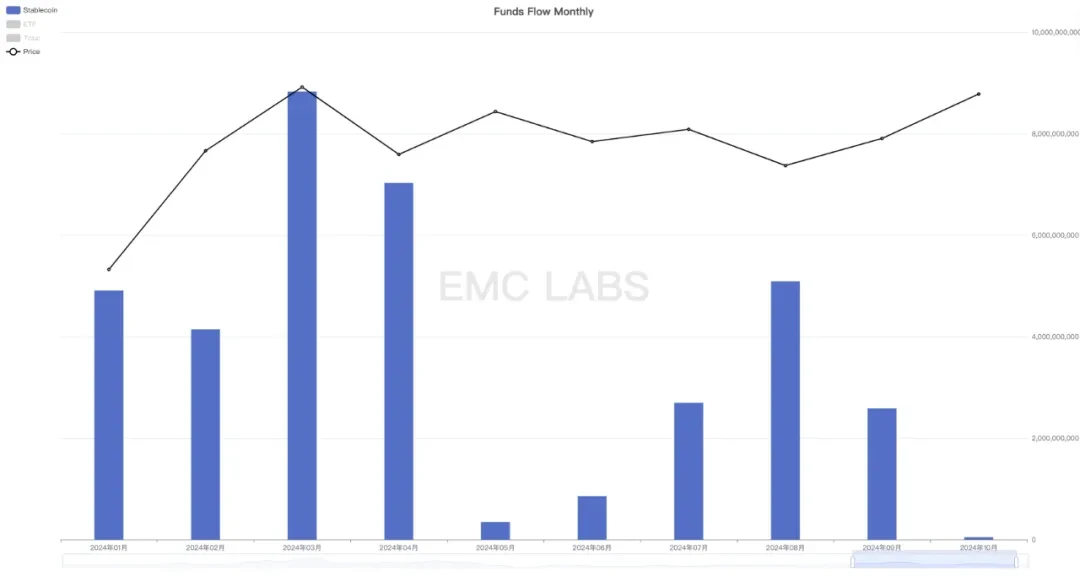
Stablecoins monthly inflow and outflow statistics
The weak stablecoin channel funds can be used to explain why Altcoins performed very poorly despite BTC challenging its previous high. The funds from the BTC ETF channel cannot benefit Altcoins, which is one of the huge changes in the structure of the crypto asset market and deserves close attention.
Among them, the sharp increase in funds in the BTC ETF channel includes the Trump transaction component. Because of Trumps pursuit of Crypto, people speculate and buy in the hope of short-term profit. This is worth paying attention to. With the US presidential election on November 4, the US time, the market may fluctuate violently in the short term.
结论
According to the 13 F report submitted by US institutional investors, there were 1,015 institutions holding BTC ETFs in Q1 2024, with a holding scale of US$11.72 billion; in Q2, there were more than 1,900 institutions holding BTC ETFs, with a holding scale of US$13.3 billion, and 44% of institutions chose to increase their holdings. Currently, the scale of BTC managed by BTC ETFs has exceeded 5% of the total supply, which is a noteworthy breakthrough.
The BTC ETF channel has already taken control of the medium- and long-term pricing power of BTC. In the long run, funds are expected to continue to flow into the BTC ETF channel during the interest rate cut cycle, providing material support for the long-term trend of BTC prices. However, there are still many uncertainties in the medium and short term.
Taking into account the structure of the market and macro-financial trends, EMC Labs maintains its previous judgment that BTC is likely to break through the previous high in Q4 and start the second half of the bull market. In the Crypto market, the start of the second half of the Altcoin bull market is based on the recovery of stablecoin channel capital inflows.
The biggest risk comes from the results of the US election, whether the interest rate cut can be carried out smoothly in line with the expectations of all market parties, and the stability of the US financial system.
EMC Labs 由加密资产投资者与数据科学家于2023年4月创立,专注于区块链行业研究与加密二级市场投资,以行业前瞻、洞察与数据挖掘为核心竞争力,致力于通过研究与投资参与蓬勃发展的区块链行业,推动区块链与加密资产为人类带来福祉。
更多信息请访问: https://www.emc.fund
This article is sourced from the internet: EMC Labs October report: Monthly increase of 10.89%, BTC may hit a new high after the chaos of the US election
Related: In-depth analysis of the impact of the EU Crypto-Asset 市场 Regulation Act on the market structure
Original author: insights 4.vc Original translation: TechFlow The cryptoasset market has experienced exponential growth over the past decade, leading to increased participation from both retail and institutional investors. However, this growth has also highlighted significant regulatory challenges, particularly in the EU, where a fragmented regulatory approach has led to legal uncertainty and inconsistency across member states. The lack of a unified framework has hampered market development, created barriers to market entry, and raised concerns about consumer protection and market integrity. Objectives of the Regulation MiCA aims to address these challenges by: Establishing a single regulatory framework: creating a comprehensive set of rules that applies to all EU member states and the European Economic Area (EEA). Strengthening consumer and investor protection: Implementing measures to protect investors and mitigate the risks associated…


