Task
Ranking
已登录
Bee登录
Twitter 授权
TG 授权
Discord 授权
去签到
下一页
关闭
获取登录状态
My XP
0
登录
原文作者:1912212.eth,远见新闻
虽然市场并不像大多数人想象的那么乐观,但也并不像一些人想象的那么悲观。没有人预料到 加密货币 今年3月开始的行情,持续半年之久,一度有股民忍不住破口大骂,抱怨一切,抱怨交易所;一度有老OG预言,要做好18个月持久战的准备;一度有鲸鱼发推放弃币圈,呼吁更多人全押A股。
是否还会有又一个模仿季?每次当市场充满怀疑的时候,恰恰是市场触底的时候,历史的答案总是回答:还会有。
历史总是惊人的相似,2023年也是在年中开始沉寂,去年10月开始腾飞,今年亦是如此。有意思的是,部分基金似乎很聪明,仿佛嗅到了味道,迅速提前布局。得益于此,9月底,市场提前迎来大涨,在10月初短暂回调后,十月大涨的自我预言再次得以实现。市场从短期的$52000再次攀升至$68000,距离历史高点仅剩$6000左右,而一些曾经被看不起的山寨币也从底部获得了不菲的涨幅,甚至翻了两三倍。
等了半年,牛市来了?
比特币现货ETF的数据代表的是场外真实买入的资金量,它和我们个人交易不一样,它代表的是一些人愿意支付手续费让别人代买BTC。从历史走势图来看,净流入量大的时候,买入量就大,比特币的价格往往上涨。净流出量大的时候,价格就下跌。
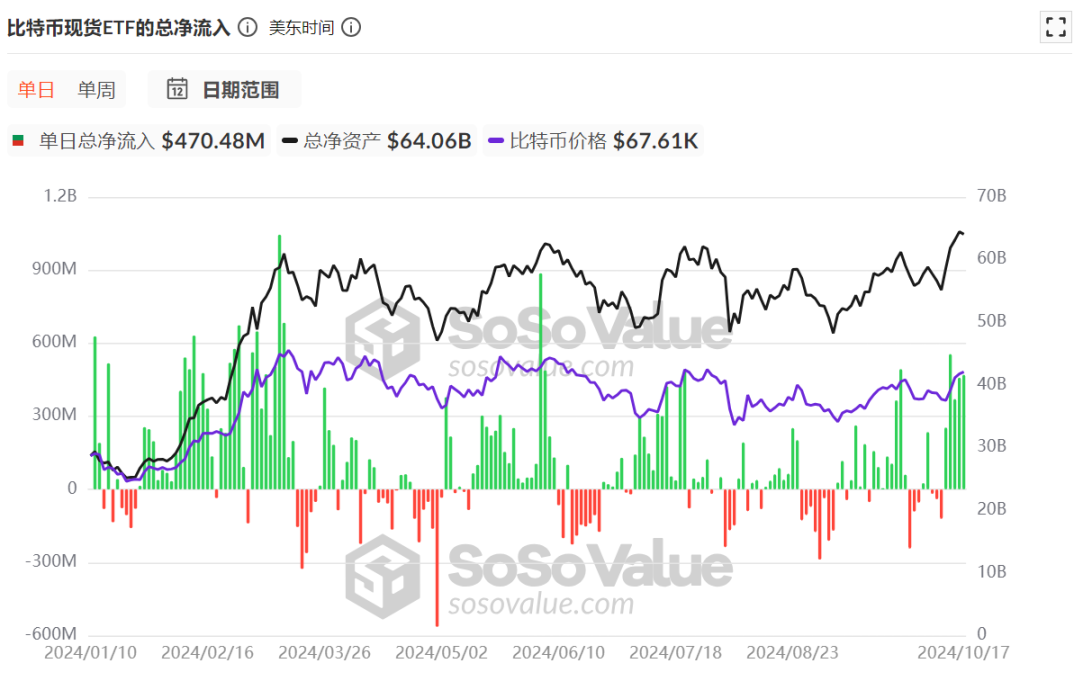
现货ETF正式推出以来,累计净流入金额高达206.6亿美元。值得注意的是,10月1日至今,有6天净流出,但也有7天净流入,且净流入金额并不大。10月14日净流入超5.55亿美元,10月16、17日净流入超4.5亿美元,10月15日净流入超3.7亿美元。
虽然净流入和净流出从天数上看大致相当,但净流出较少,而净流入往往是净流出的几倍。
即便是并不热门的以太坊现货ETF,自10月份以来也罕见地出现了$4841万的单日净流入量。
场外基金的购买力仍然相当强劲。
稳定币总市值的变化代表着资金的流入量,虽然这几年市场有起有落,资金有进有出,但站在更广阔的视角来看,很难悲观。
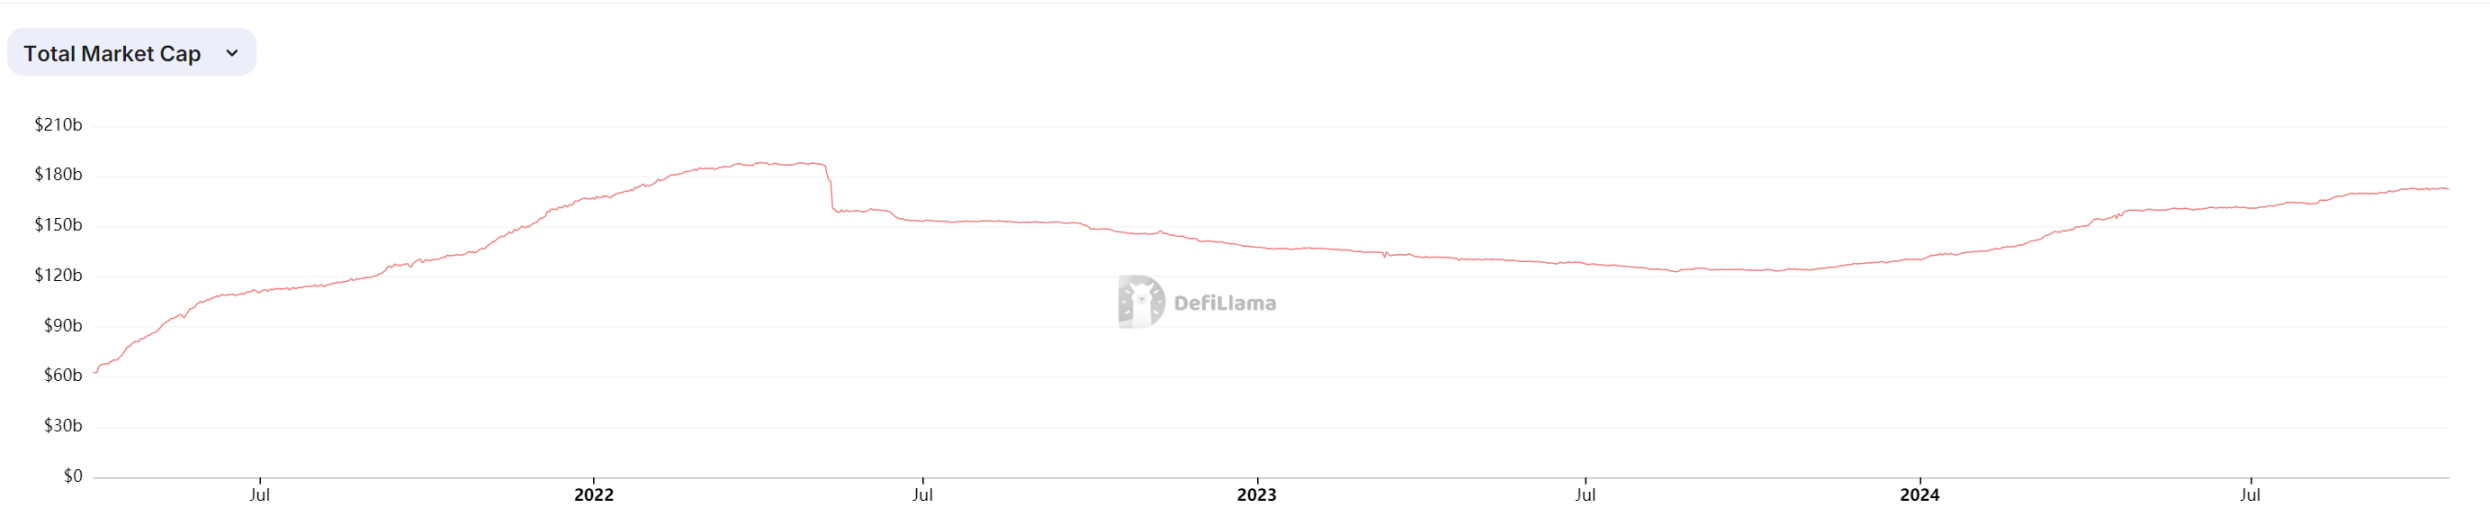
稳定币总市值在2022年中旬创下$1863亿的历史新高,随后持续下滑,但总体维持在$1200亿以上。快进至2023年10月,资金流入持续加速,稳定币总市值目前已突破$1723亿。
历史最高点即将到来。
比特币未实现净盈亏,这个指标主要用来衡量比特币链上玩家的盈利/亏损情况。我们可以看到行的颜色从上到下依次为红色、橙色、浅黄色、灰色和浅蓝色。底部的蓝色代表大多数人都在亏损,而顶部的红色代表大多数玩家都在盈利。
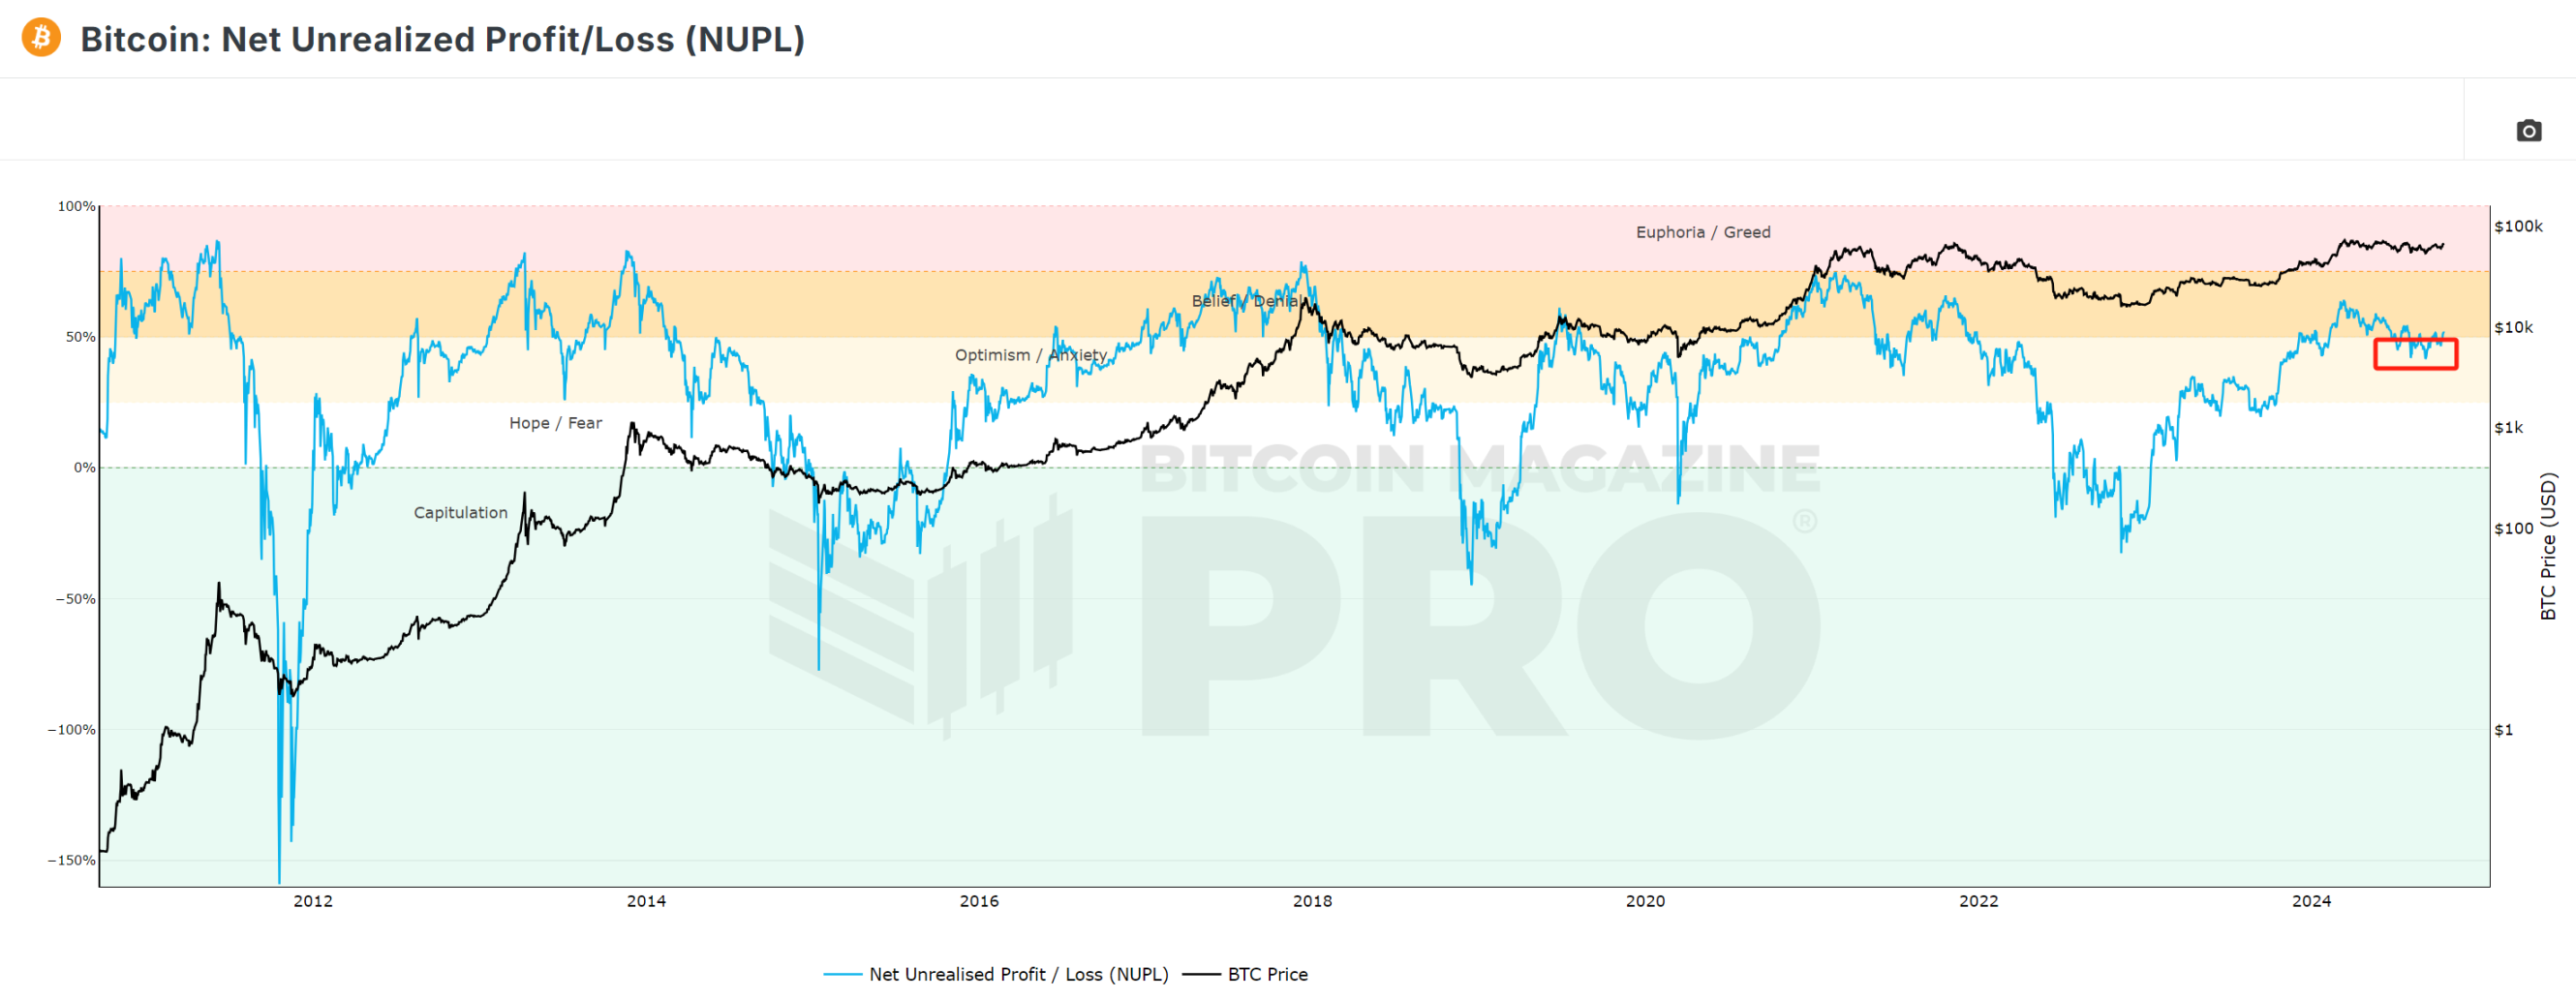
当折线图处于浅蓝色区域时,往往是BTC价格的底部区间,因为止损的人不断离场筑底。当折线图处于黄色或红色区域时,往往是BTC价格的顶部区间,在多数人获利后,相当一部分获利了结的订单会选择止盈离场,从而形成周期的顶部,周而复始。
从折线图来看,市场已由浅色区域回升至黄色区域,据IntoTheBlock披露的数据,BTC地址中已有95%实现盈利,市场情绪明显回暖。
从历史上看,这样的水平往往预示着强劲的看涨势头,但也可能代表着潜在的过度扩张。
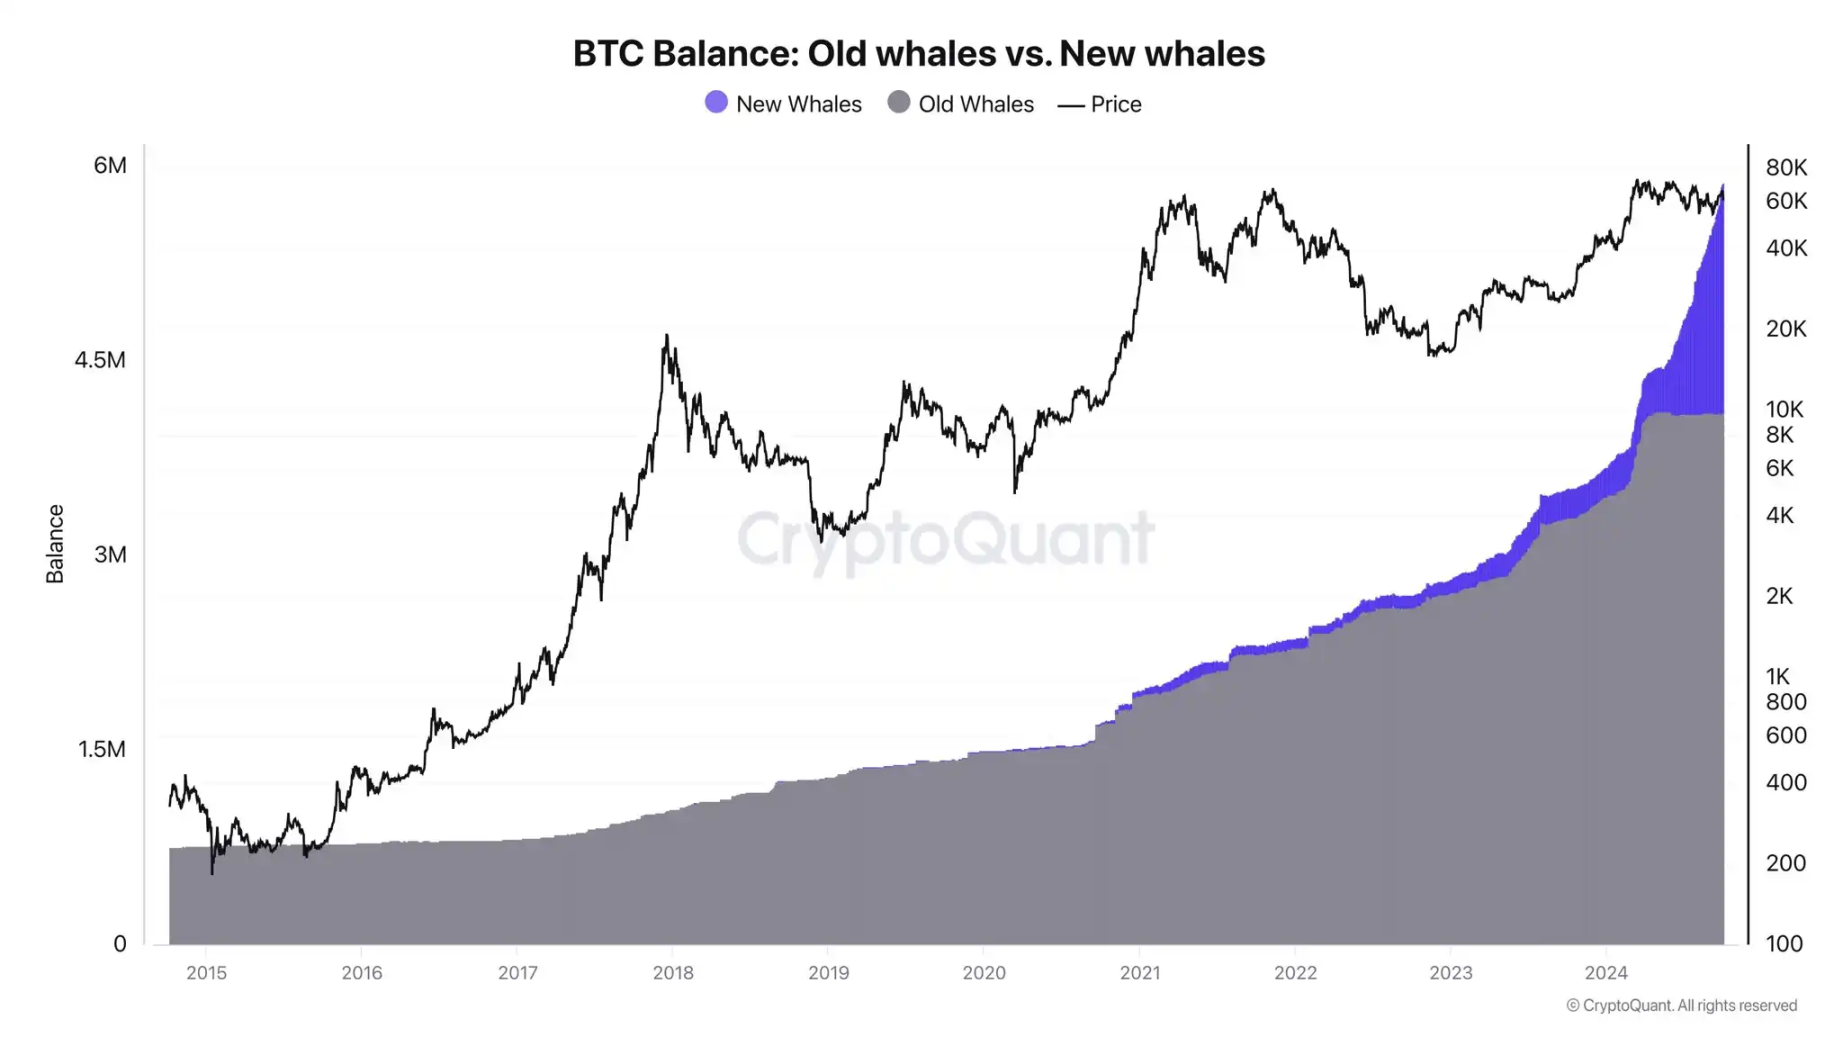
长期持币量主要体现的是长期持币者持有的BTC总量,这里的长期持币者具体是指持有BTC超过155天的地址。
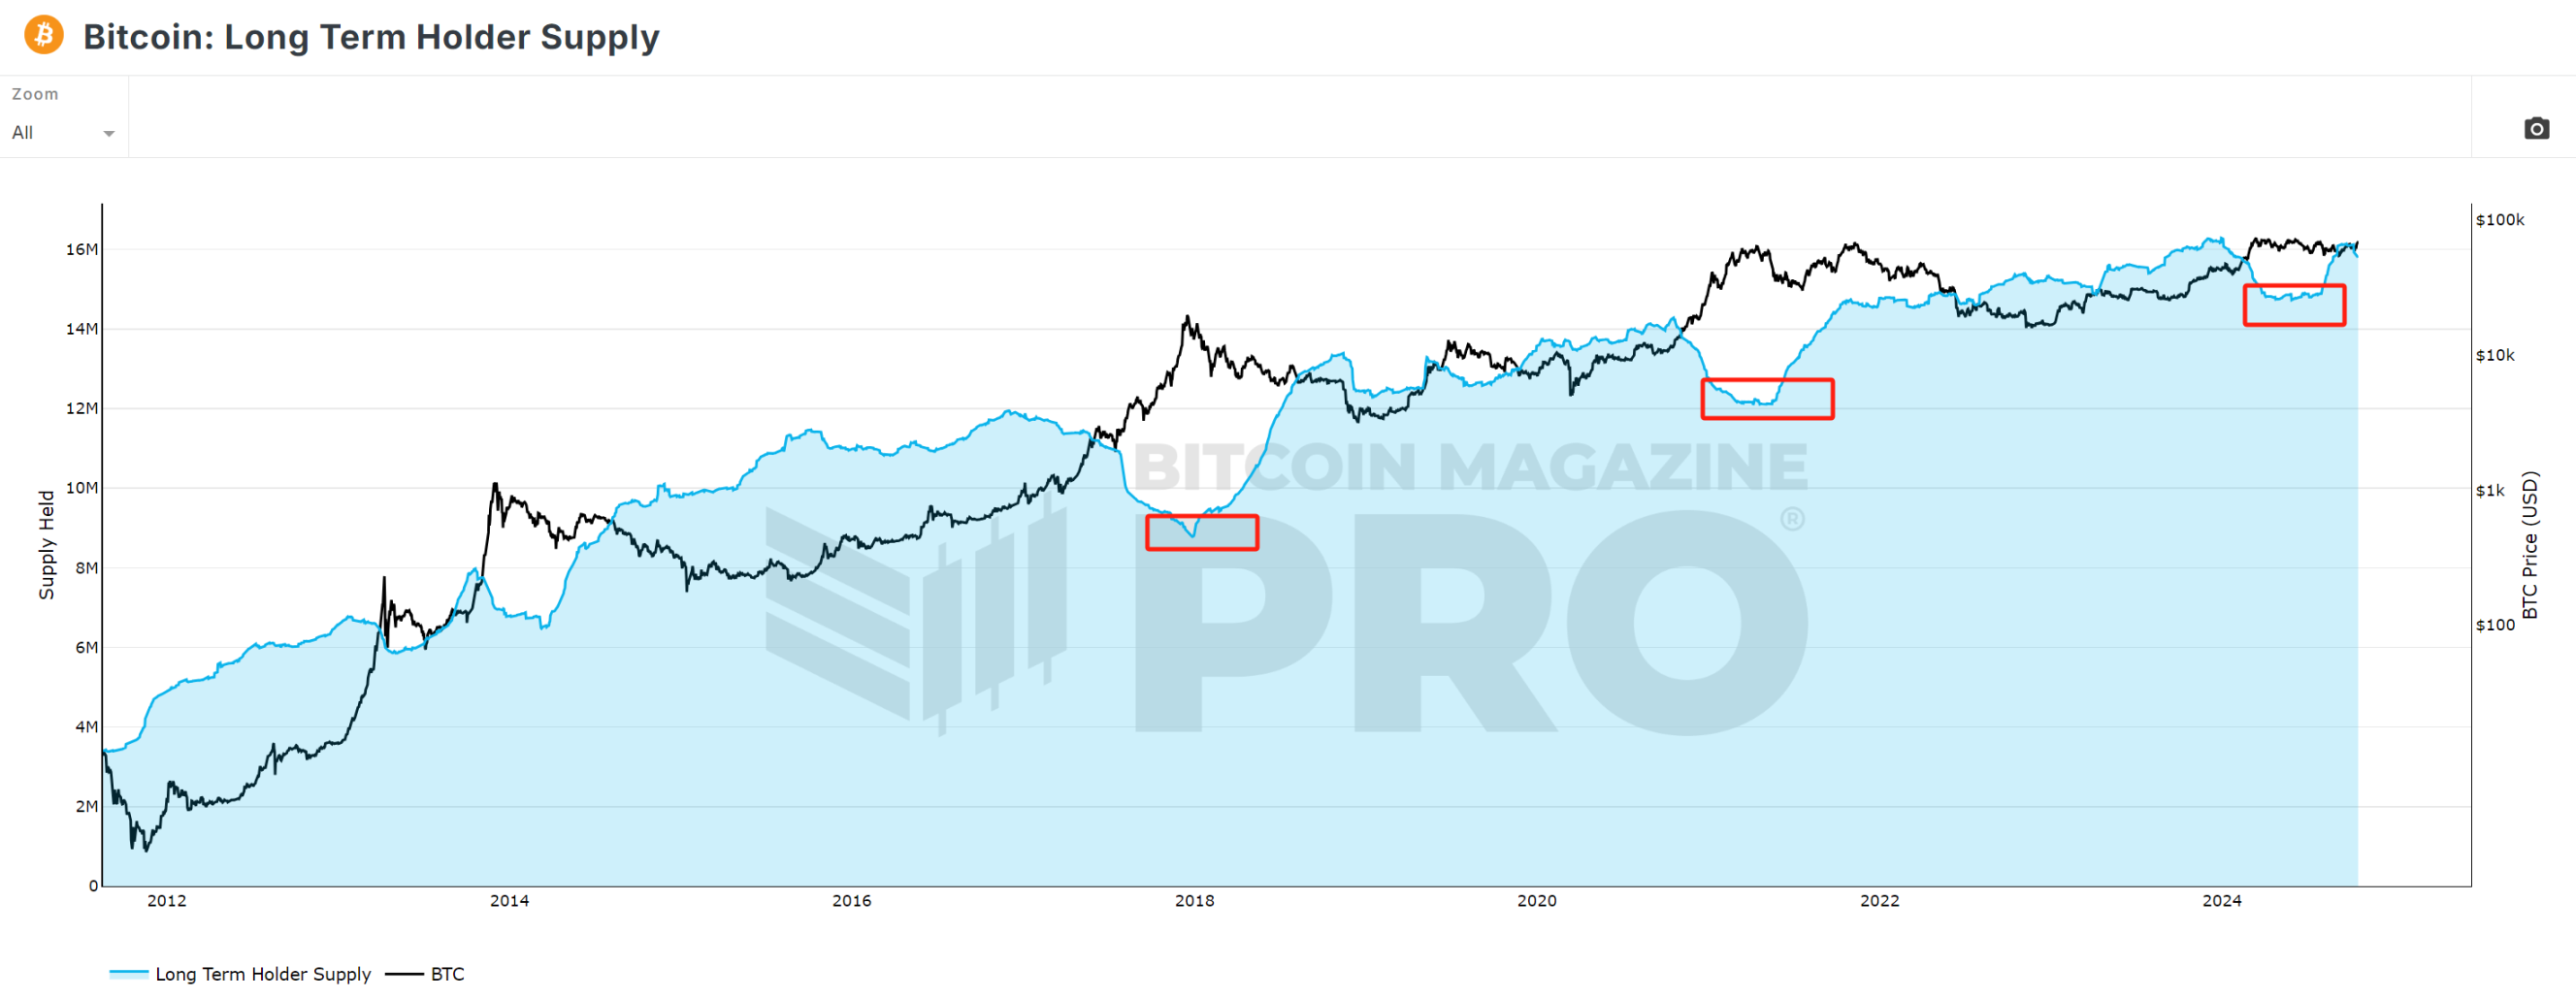
上图显示,每当BTC价格达到峰值时,长期持有比特币的地址数量就会减少。这是因为聪明钱总是选择在价格达到峰值时获利退出市场。价格下跌后,他们又继续再次积累BTC,在价格达到高点时再次卖出,如此循环往复。
图表显示,从今年7月底开始,这些长期持有者又开始买入,而且右边的折线图相当陡峭,显然这些聪明的基金对未来的市场前景持乐观态度。
值得一提的是,根据 CryptoQuant 的数据,新鲸地址正在近乎疯狂地囤积 BTC。创始人 Ki Young Ju 表示,BTC 市场从未出现过如此囤积行为。有人认为新鲸主要是由 ETF 流入引起的,但近期的囤积行为表明,这些新鲸地址与 ETF 的关联性不大。
今日,据Coinglass数据显示,全网比特币合约总未平仓量升至US$39.7亿以上,创下历史新高。
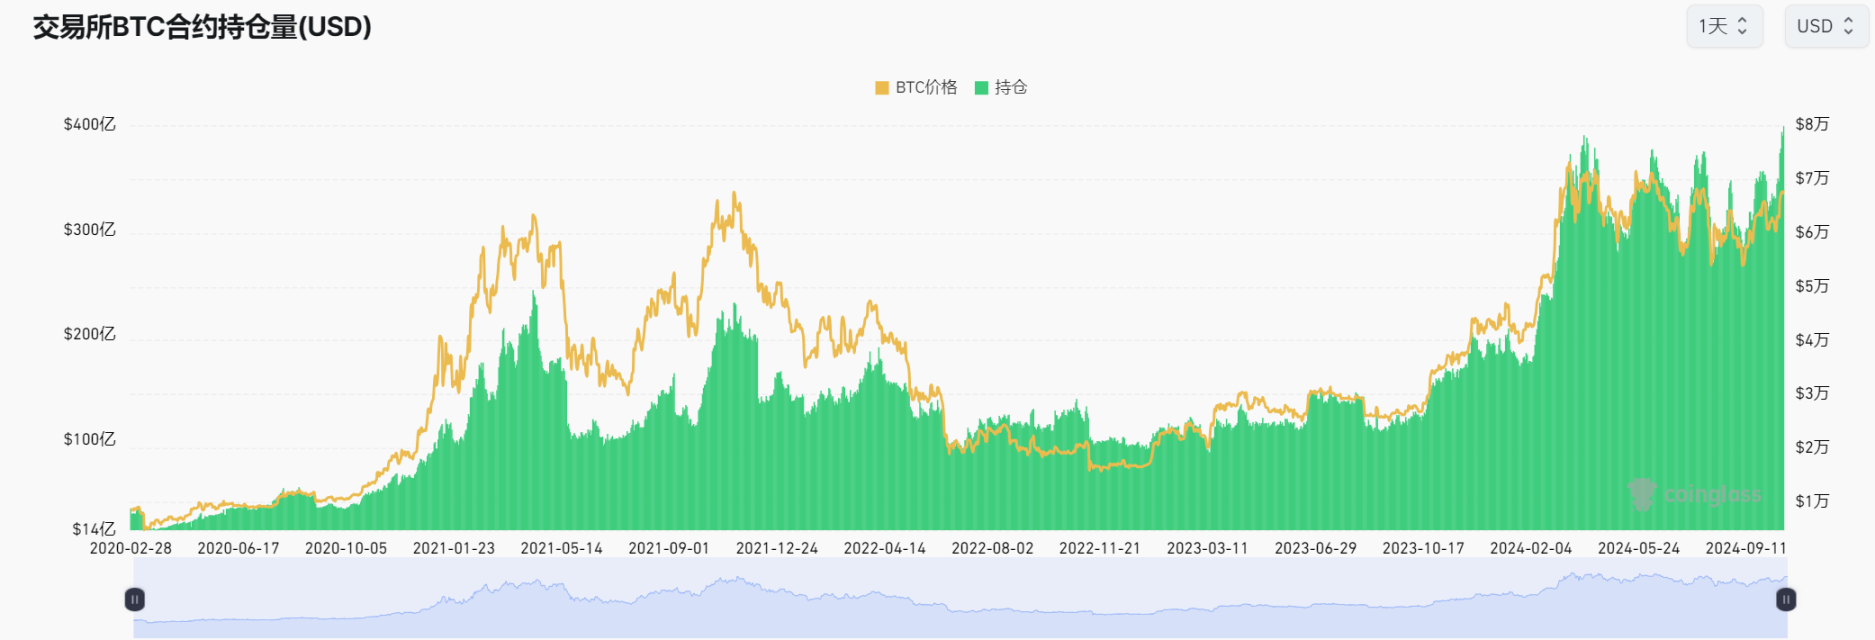
合约数据往往代表着市场资金对于未来市场走势的看法,往往落后于比特币现货价格的表现,也正因如此,当市场往往对未来短期走势极度乐观时,也容易迎来回调,清理筹码和杠杆。
值得注意的是,近半年来,比特币合约持仓量一直维持在较高水平,这一数据创下历史新高,首次突破今年年初超380亿美元的数据。 市场 乐观情绪明显上升。
宏观层面,美联储11月、12月降息,全球部分流动性资金持续注入风险资产,加密市场流动性更加充裕,一系列链上指标显示市场正在复苏,资金不断流入。
市场总是在绝望中诞生,在半信半疑中成长,在期待中成熟,在希望中破灭。
或许,在等待了近半年之后,加密市场的新一轮牛市已经蓄势待发。
本文来源网络:五大数据解读当前市场:苦等半年,牛市要来了?
相关:币安RWA报告解读:传统机构积极入市,资产收益或将下降
原文作者:TechFlow RWA 板块在这场非典型牛市中默默赚得盆满钵满。当所有人的情绪都很容易被 meme 所驱动时,如果仔细看数据就会发现,今年到目前为止,RWA 赛道的代币表现很可能优于大多数其他赛道的代币。当美国国债成为最大的 RWA 时,该赛道受宏观经济影响的趋势将更加明显。近日,币安研究院发布了一份长篇报告《RWA:链上收益的避风港?》,对 RWA 赛道格局、项目和收益表现进行了详细分析。TechFlow 对报告进行了解读和提炼,重点内容如下。Key Takeaways 总…