撰文:Shang2046
本报告所提及的关于市场、项目、货币等的信息、观点和判断仅供参考,不构成任何投资建议。
市场周刊
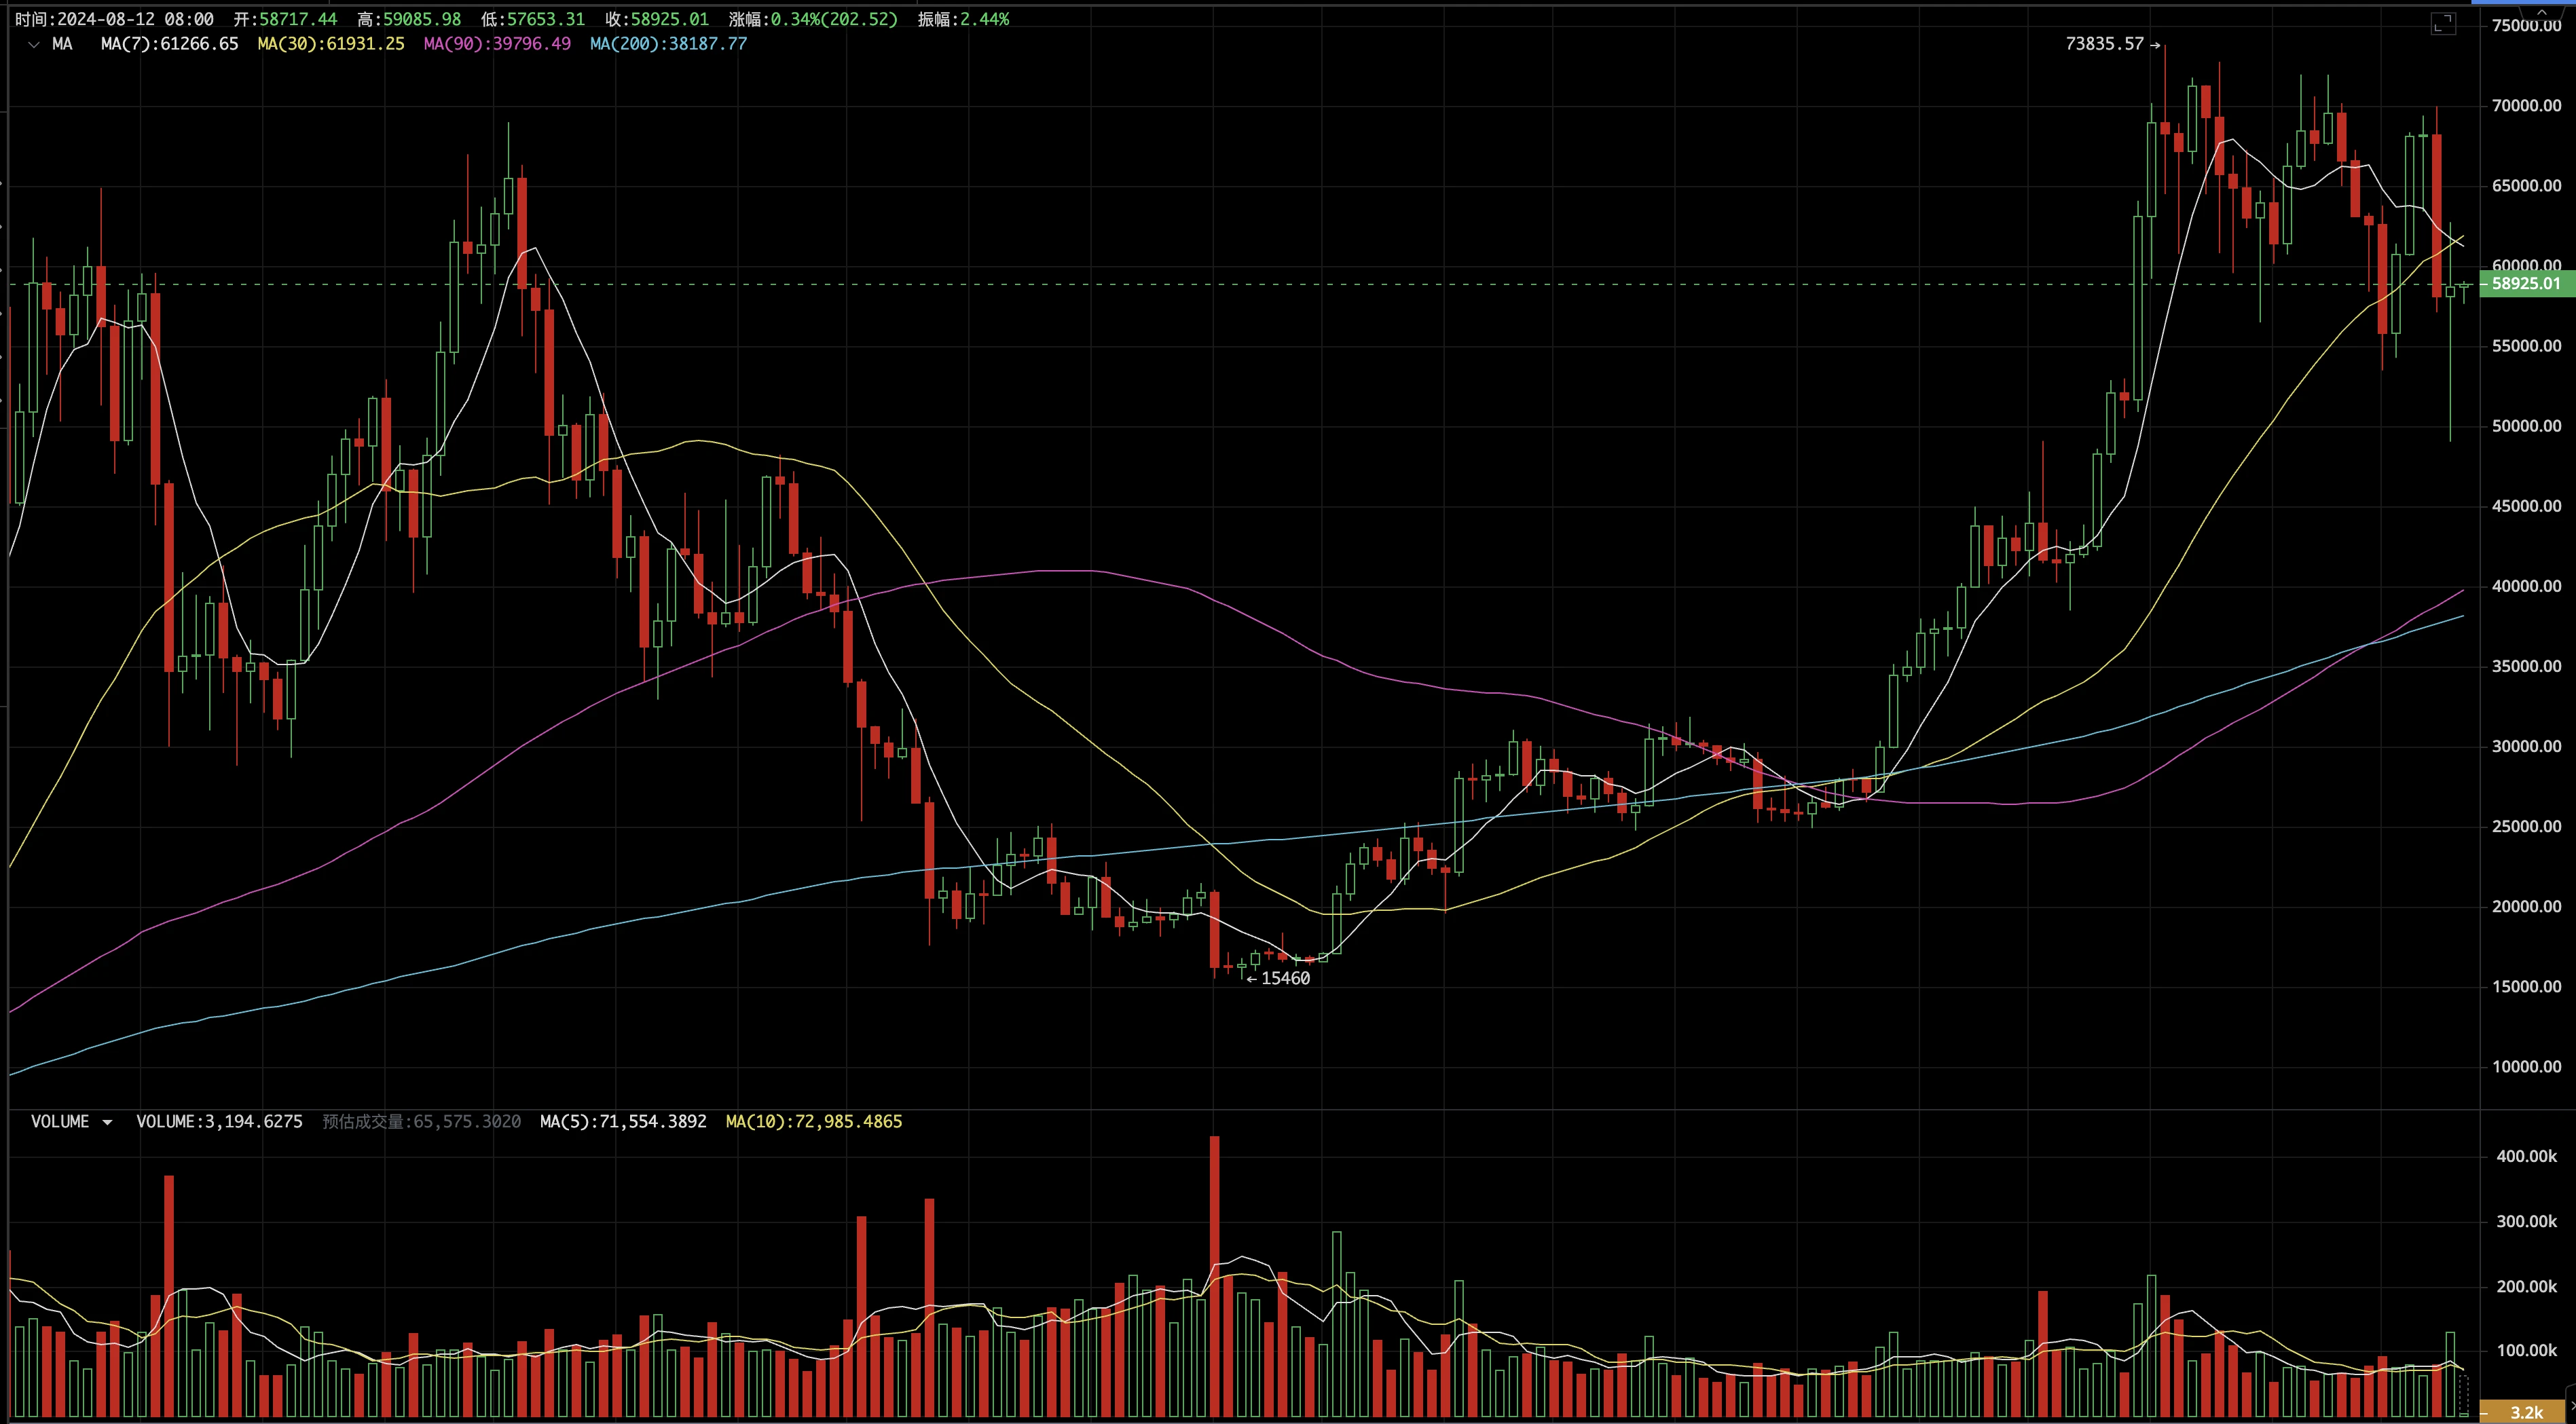
上周BTC开盘报$58161,收盘报$58712,8月5日一度跌至$49000,振幅23.63%,为今年以来第二大振幅周。今年最大振幅周也并不遥远——2月底,BTC单周从$50000涨至$10000,并在第二周创下新高。
BTC经过半年的高位盘整以及30%附近两次深度回调,目前已经突破上升趋势线以及200日线,但仍处于新高盘整区域。
正如我们上周提到的,本轮下跌的原因是日元加息引发的套利交易者蜂拥而至以及对美国经济衰退的担忧。好在这两个最大的利空因素在上周后期得到了修正。BTC价格也迅速反弹,最高触及$62700。
快速下跌并没有摧毁市场的信心。我们注意到,上周录得了近 4 个月来最大的单周资金流入。考虑到 Jump Crypto 等做市商可以轻松撤出数亿美元的 USDC,这并不容易。
当然,危险的局面还未结束:短线投资者陷入茫然,市场在200日均线附近徘徊,9月降息的影响也逐渐被消化,修复仍需较长时间。
时间也是投资者的朋友,第四次减半已经持续了115天,虽然减半前创下了历史新高,但创下新高之后的走势并没有偏离历史的惯常轨迹,我们乐观地预测,所有的波动都在为明年更好的走势创造空间。
距离达到历史最高点还有很长的路要走,历史最高点通常在 500 天左右,这是新投资者进入的最佳时机。
美联储和经济数据
在不断吹哨扭转市场对经济衰退的预期后,美联储进一步希望市场不要对9月降息幅度那么乐观,降息25个基点而非50个基点。美联储观察目前的数据:9月降息25个基点的概率为51.5%,降息50个基点的概率为48.5%。今年累计降息75个基点的概率为49.4%。
资金
上周稳定币流入量较大,达$23.36亿,其中USDT、USDC分别实现$10.31亿、$13.04亿的正流入,成为本轮跌至新低后反弹的决定性力量。
BTC ETF通道,5个交易日仅2个交易日为正流入,全周净流出1.69亿,8月以来已连续两周净流出。
芯片供应
本周市场延续由空转多走势,持仓5个月以上长线投资者增持5.45万枚,持仓5个月以下投资者减持5.26万枚。市场的剧烈变动加剧了短线减仓,短线已连续7周减持。
短线投资者在短暂获利后,再次进入亏损区间,最高平均亏损达14%。
8月5日,快速下跌的一天,有超过8.5万BTC被充入交易所,但全周交易所净增BTC只有500BTC,这或许意味着大部分抛售压力已被有效吸收。
矿工持仓增加100枚,实现连续三周增持。本周俄罗斯通过国家立法,允许企业(经批准)和个人(一定规模以下)合法挖矿。
BTC 链上数据
BTC新增地址数、活跃地址数维持温和回升,30日均线较上周延续缓慢上行,交易量与上周持平,Gas收益维持低迷。
生态分析
以太坊生态恢复良好,新增地址数、活跃地址数、总转账数重回扩展区。
Solana的新增地址、活跃地址、总转账数都有一定程度的下降,但仍然保持较高水平。
EMC BTC 周期指标
EMC BTC 周期指标指标为 0.125,等待进一步复苏中断的看涨信号。
结尾
EMC Labs 由加密资产投资者与数据科学家于2023年4月创立,专注于区块链行业研究与加密二级市场投资,以行业前瞻、洞察与数据挖掘为核心竞争力,致力于通过研究与投资参与蓬勃发展的区块链行业,推动区块链与加密资产为人类带来福祉。
如需了解更多信息,请访问:https://www.emc.fund
本文来源:EMC实验室比特币周观察(8.5~8.11):深度调整吸引逢低吸纳资金,BTC守住高位震荡区
原文:Odaily星球日报 作者:Azuma 具有高FDV、低流通量典型特征的所谓VC代币,成为了二级市场最危险的标签。6月24日,数据分析平台DY胃R联合创始人hitesh.eth在X上发布了一组数据,盘点了市场上十大典型VC代币。数据显示,即使在市场连续下跌的情况下,各大VC对这些代币的投资,依然有数十倍甚至数百倍的浮盈。hitesh.eth特意标注了这些代币的投资人份额解锁时间,以便市场监测潜在的解锁抛售压力。下图是Odaily星球日报根据…制作的二级地图