
The most volatile week of 2019
Although U.S. stocks were basically flat for the week, the market was a real roller coaster.
Panic selling on Monday, retaliatory rebound on Tuesday, technical selling on Wednesday caused the market to fall again, and the decline in the number of first-time unemployment claims on Thursday, which had a general influence, triggered the markets impulse to buy the bottom, although this data is not worth being overly excited about because the trend of increasing unemployment claims is obvious. The market continued to rebound on Friday, but the amplitude slowed down.
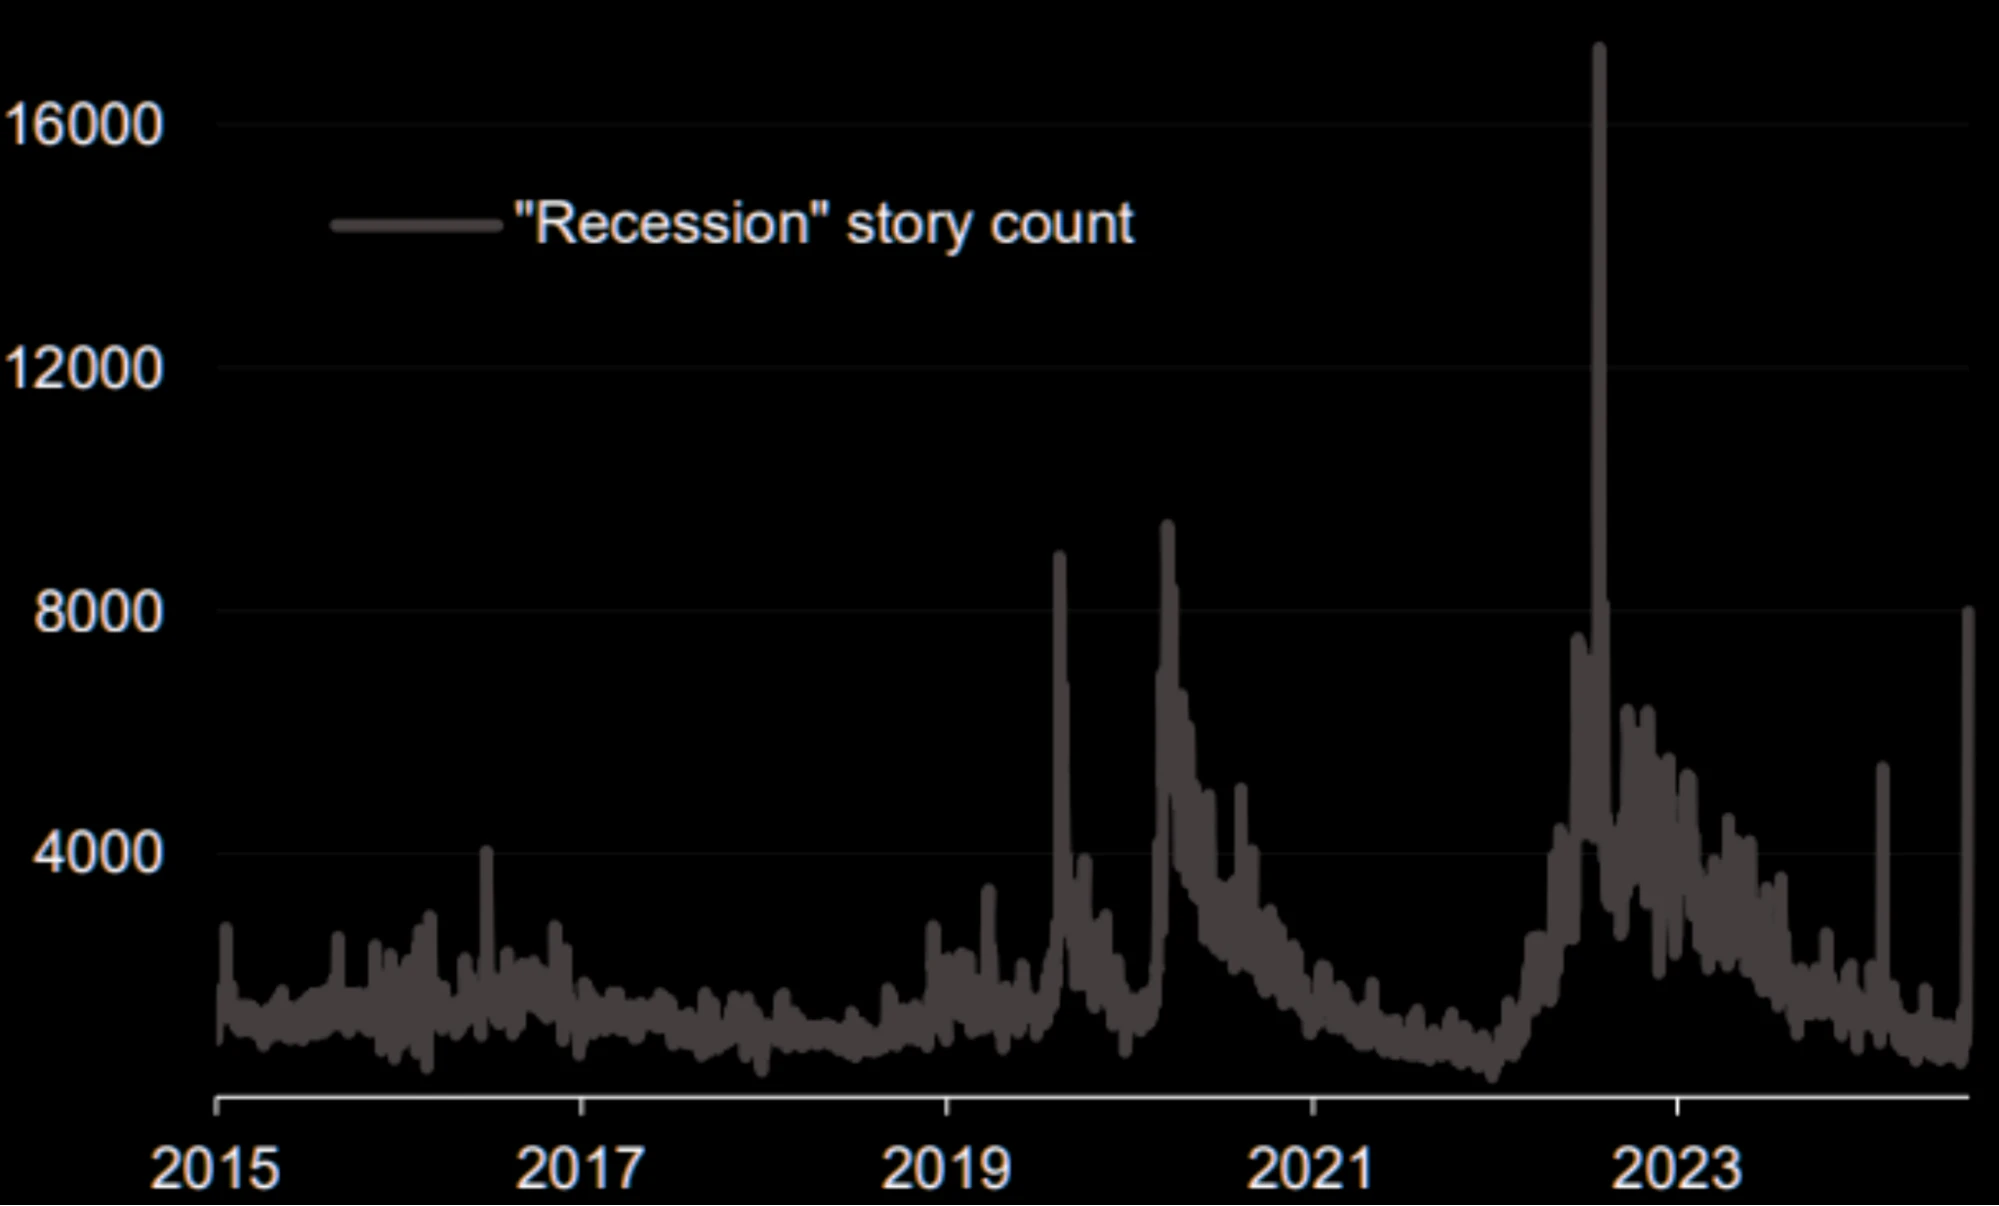
Over the past week, the stock market and the crypto market have been very closely linked. In the media, the two core themes were the U.S. recession and the unwinding of the yen carry trade, but I personally think these are two false propositions. In fact, the real panic was very short-lived, and the usual situation of selling everything, including bonds and gold, when a crisis breaks out did not occur.

After the sell-off on Monday, the US stock market experienced a peak-to-trough fluctuation of about 4.5%, which was the most volatile week since the COVID panic in 2019. Volatility means risk and opportunity. I quickly recorded a video during the trading session on Monday to explain why the sell-off except for the yen was excessive panic. For mainstream cryptocurrencies and stocks, this is a golden pit, and for bonds, this is a short-term high. In summary, it is mainly:
-
Most of the current US economic data is good and the trend is also good. Only a few data support a recession, and these data types have been proven to be unreliable in this recovery cycle.
-
Corporate profit growth is good, except that the extent of exceeding expectations has not expanded.
-
Secondly, it is impossible for Japan to continue raising interest rates because the huge debt cannot be absorbed by economic growth.

-
The short-term panic caused by the unexpected rate hike triggered the unwinding of the previously over-leveraged positions. According to the data, such a stampede was digested on Monday.
-
The trends in fixed income and USD FX markets dominated by large players do not fit the picture of panic trading or liquidity scarcity.
Therefore, it can be judged that there is a higher possibility that Monday was an accidental killing.
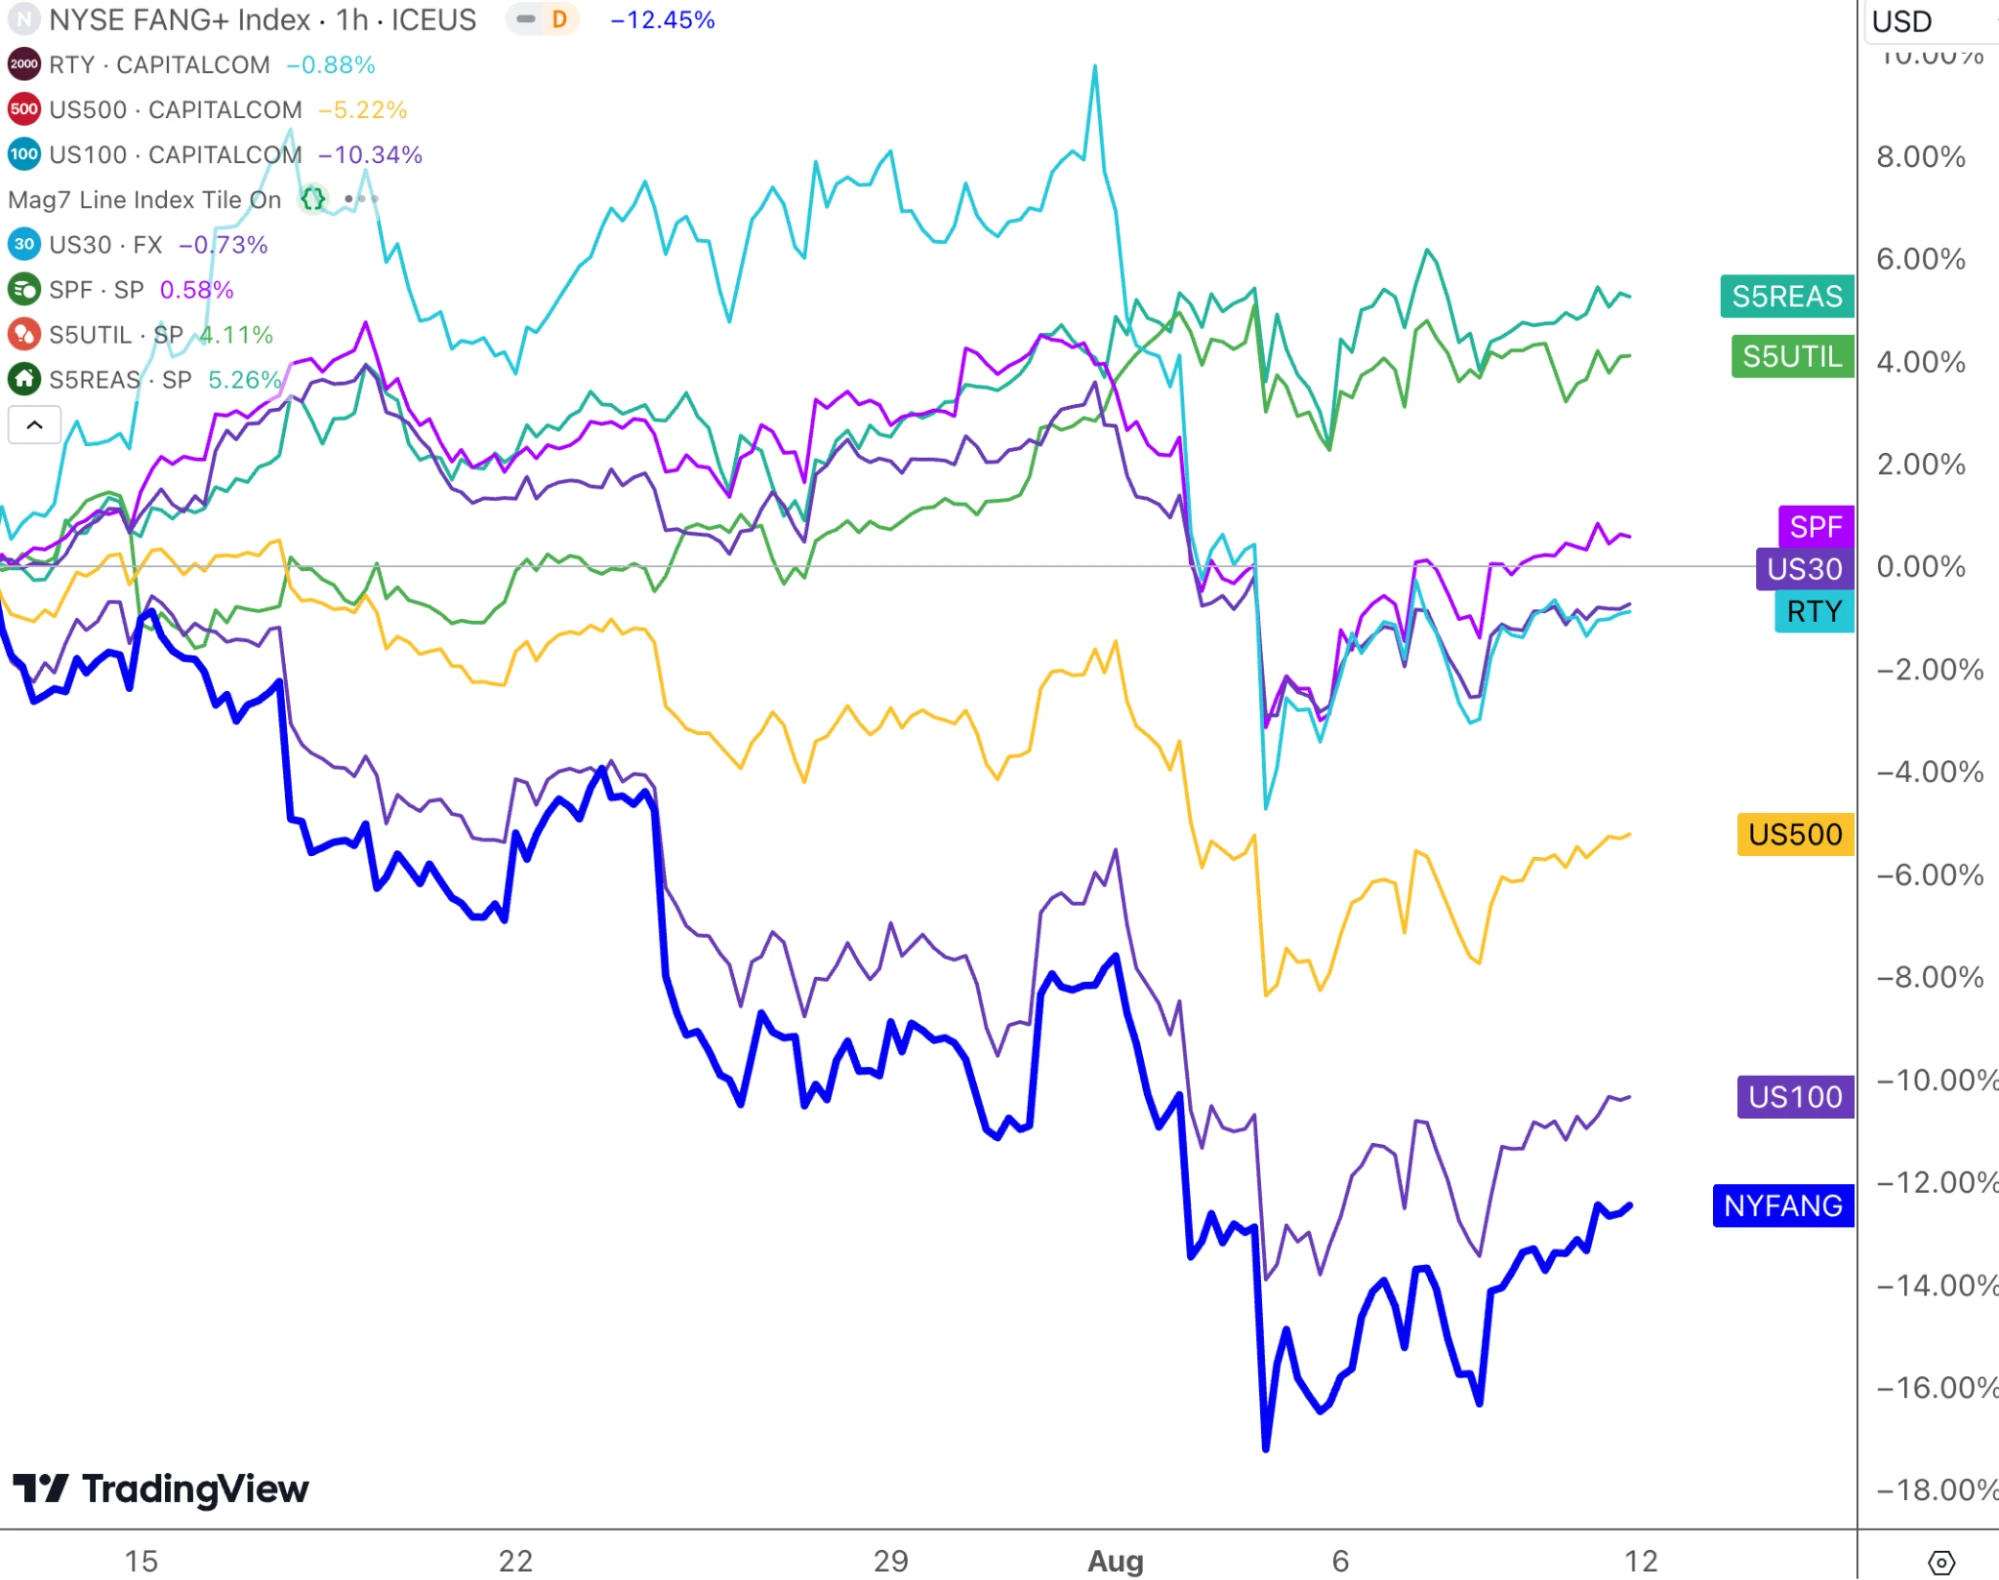
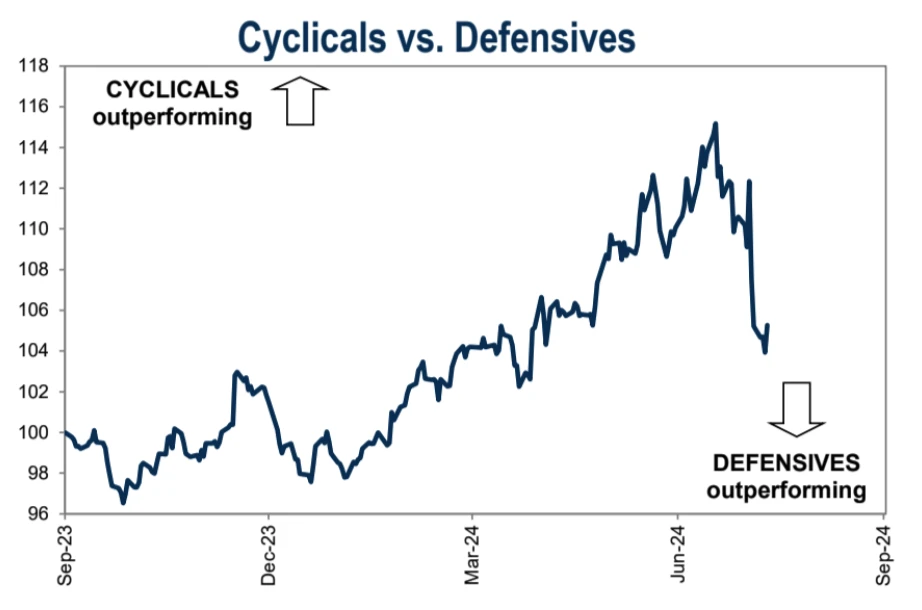
However, we need to further observe the data changes. Now we can say that everything is getting better. It is too early to return to the previous state. After all, from the perspective of capital preference, aggressiveness and defense have not changed so far, and the disappointment with big technology has escalated to the level of killing narrative (killing performance, killing valuation, killing narrative, three stages of decline, getting more and more serious). Unless NVs financial report can once again crush all doubts and mobilize industry sentiment, US 30 and US 500 may be better than US 100 in the next few months. But from the trading level, Cyclical has lagged behind defensive recently, and the possibility of a larger rebound in the short term cannot be ruled out.
Goldman Sachs clients bought technology stocks at the bottom last week, with the largest volume in 5 months:

On the other hand, rising bond prices and falling interest rates have provided a buffer for the stock markets decline. In the past month, US 10 Y has dropped from 4.5% to 3.7%, and the 80 bp change has greatly exceeded the decline caused by the change in the expectation of interest rate cuts. Unless we really see a recession, such pricing is obviously an opportunity, just like the market in the fourth quarter of last year when everyone was enthusiastic about interest rate cuts (5% fell to 3.8%). Personally, intuitively, the market in recent years seems to be more animalistic than before, and pricing is no longer so rational.
The recent correction in the stock market started from a record high, with the largest amplitude being 8%. The current level is still 12% higher than the beginning of the year, and because bonds have risen, investors with a higher degree of diversification will not be affected only by the overall decline in the stock index, so the chain sell-off situation is not worth worrying about in the US stock market. In the past few decades, on average, we have experienced about 3 adjustments of more than 5% and one adjustment of 10% per year.
Stock market declines and corrections, if not accompanied by a recession in the economy or corporate earnings, are often temporary and will be followed by a good rally:
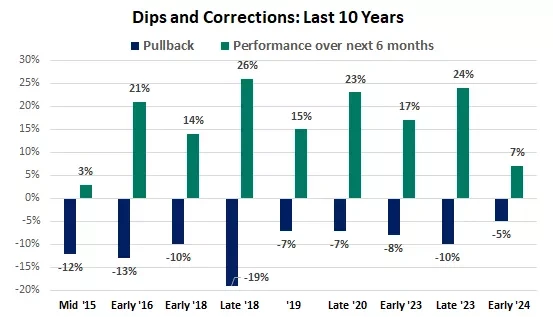
However, considering that the pessimistic sentiment of the technology narrative is unlikely to be reversed quickly, and the sharp short-term fluctuations have caused great damage to many investment portfolios, such medium- and long-term funds still need to adjust their positions. The short-term fluctuations may not be completely over, but the market is unlikely to start a larger and deeper decline. The strong rebound in the second half of last week is a positive signal.
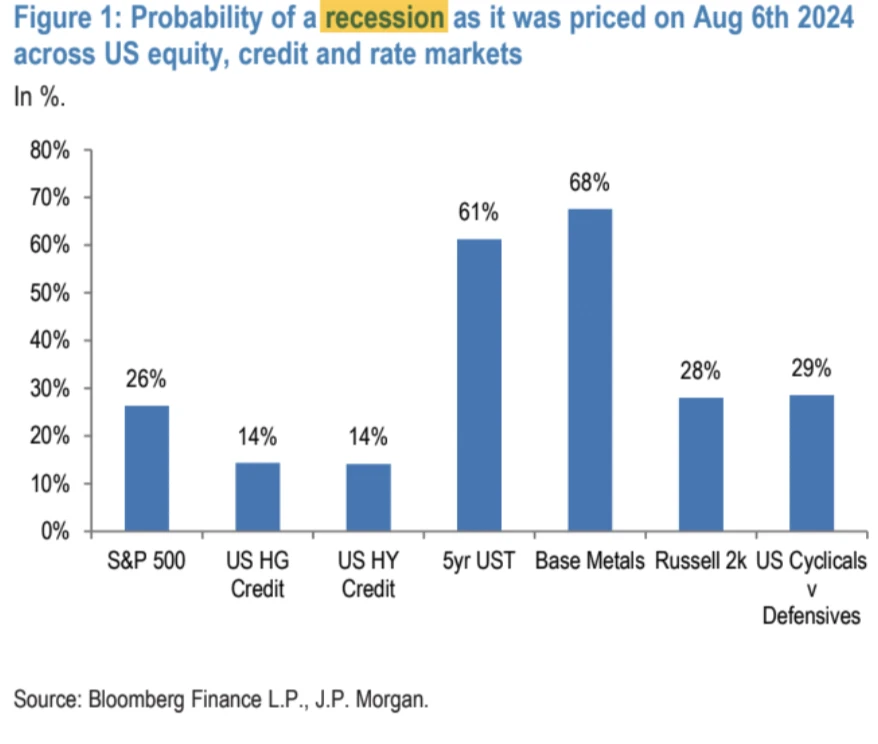
According to JPM statistics, judging from the extent of each assets adjustment relative to its own history, metals fell more, government bonds rose more, and stocks fell less, so the recession expectations reflected by the government bond and commodity markets are actually greater than those reflected by the stock market and corporate bond market.
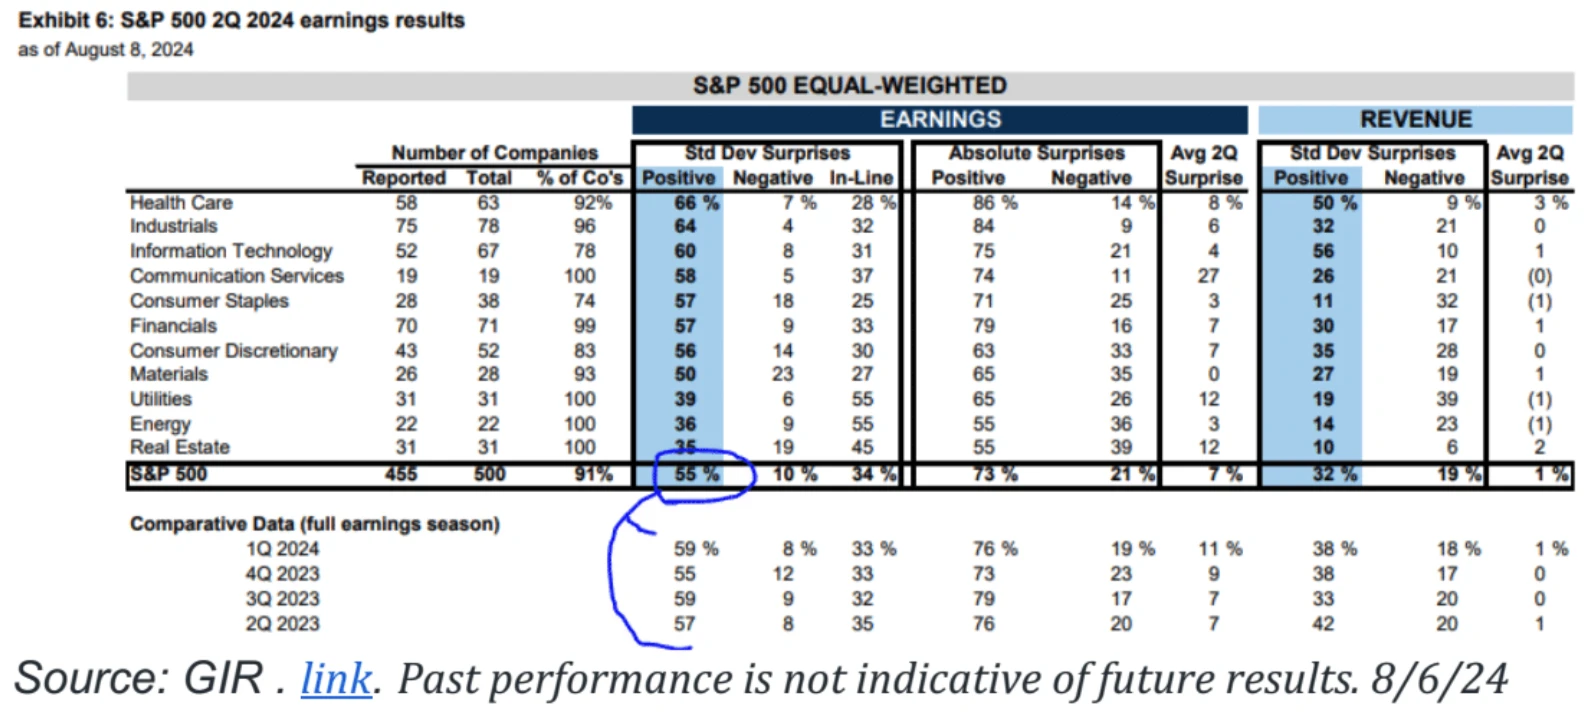
91% of SP 500 companies have released Q2 earnings, and 55% of them have exceeded revenue expectations. Although this ratio is lower than the average of the past four quarters, it is still above 50%, indicating that most companies have performed well in terms of revenue.
As can be seen from the chart, there are large differences in the performance of various industries. For example, the performance of the Health Care, Industrials and Information Technology industries is relatively good, with a higher proportion of companies exceeding expectations, while the performance of the Energy and Real Estate industries is relatively poor.
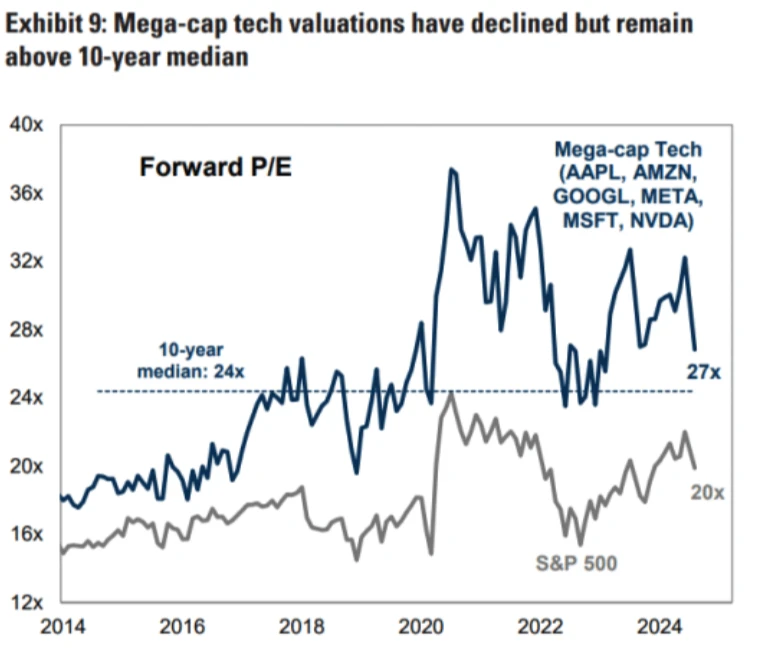
NVIDIAs valuation has corrected:
Its 24-month forward PE is currently 25 times, close to the lowest point in the past 5 years (about 20 times), and the PE premium endorsement to SPX has increased from 1.8 times to 1.4 times, which shows that NVIDIAs valuation is gradually becoming reasonable.

The financial reports of large technology companies this quarter are solid. In fact, there is no performance reduction. The valuation reduction is mainly caused by increased investment in AI:
Palantir raised its guidance, emphasizing AI boosts performance, and its stock price surged 37%, sparking some AI narrative discussion on the street.
Regarding the expectation of a rate cut in September
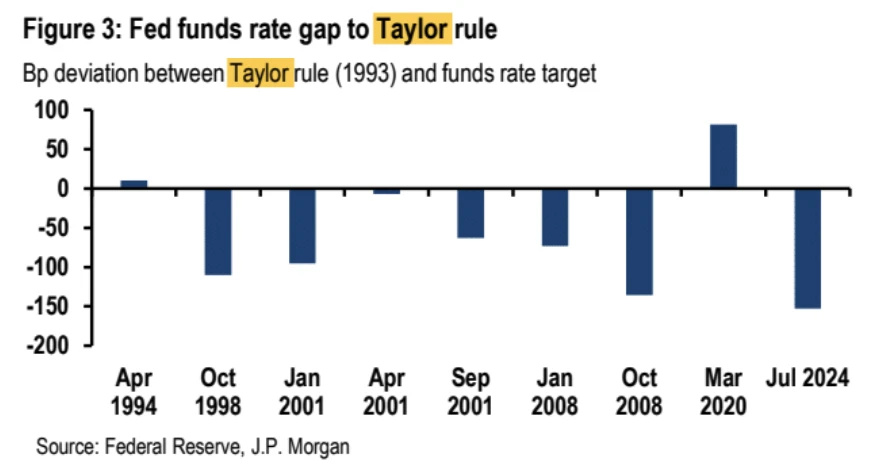
JPM Research calculated that the Feds target federal funds rate should be around 4%, 150 basis points lower than the current rate, based on the Taylor Rule. The Fed has reason to quickly adjust its policy to make it more consistent with current economic conditions.
In terms of market pricing, the normal rate cut at the September FOMC meeting will be 25 basis points, but the market expects it to be more than 25 basis points. During Mondays trading session, the rate was once priced at 63 bp due to panic, and finally closed at 38 bp this week. In addition, the current market has digested the Feds expectation of a 100 basis point rate cut this year, which is four times.
The expectations of exceeding 25 bp for the first time and more than three times this year require continued deterioration in data, especially data on the job market to support it. Otherwise, the pricing may be excessive. If the data supports it, the market will gradually price in the possibility of a 50 bp rate cut in September or even a 125 bp rate cut this year.
From a trading strategy perspective, in the short term of 2 weeks, the U.S. interest rate market is mainly in a correction mode if it rises. The period of more than 1 month is in a buy-sell mode because the interest rate cut cycle is destined to begin. It will take time for the market to reach a consensus on whether the rising unemployment rate indicates an economic slowdown and potential recession. During this period, there will be repeated emotions.
Fed officials’ speeches last week were slightly dovish but generally noncommittal, as expected.
加密市场
After experiencing the sharpest correction since the FTX crisis, Bitcoin price fell by more than 15% and then rebounded. Since the trigger of this correction was not an internal event in the cryptocurrency market, but an external shock from the adjustment of the traditional market. The technical side is also severely oversold, and the degree is almost the same as last year on August 16, when Bitcoin fell 从 20,000 到 20,000 , and then experienced two months of shock consolidation.
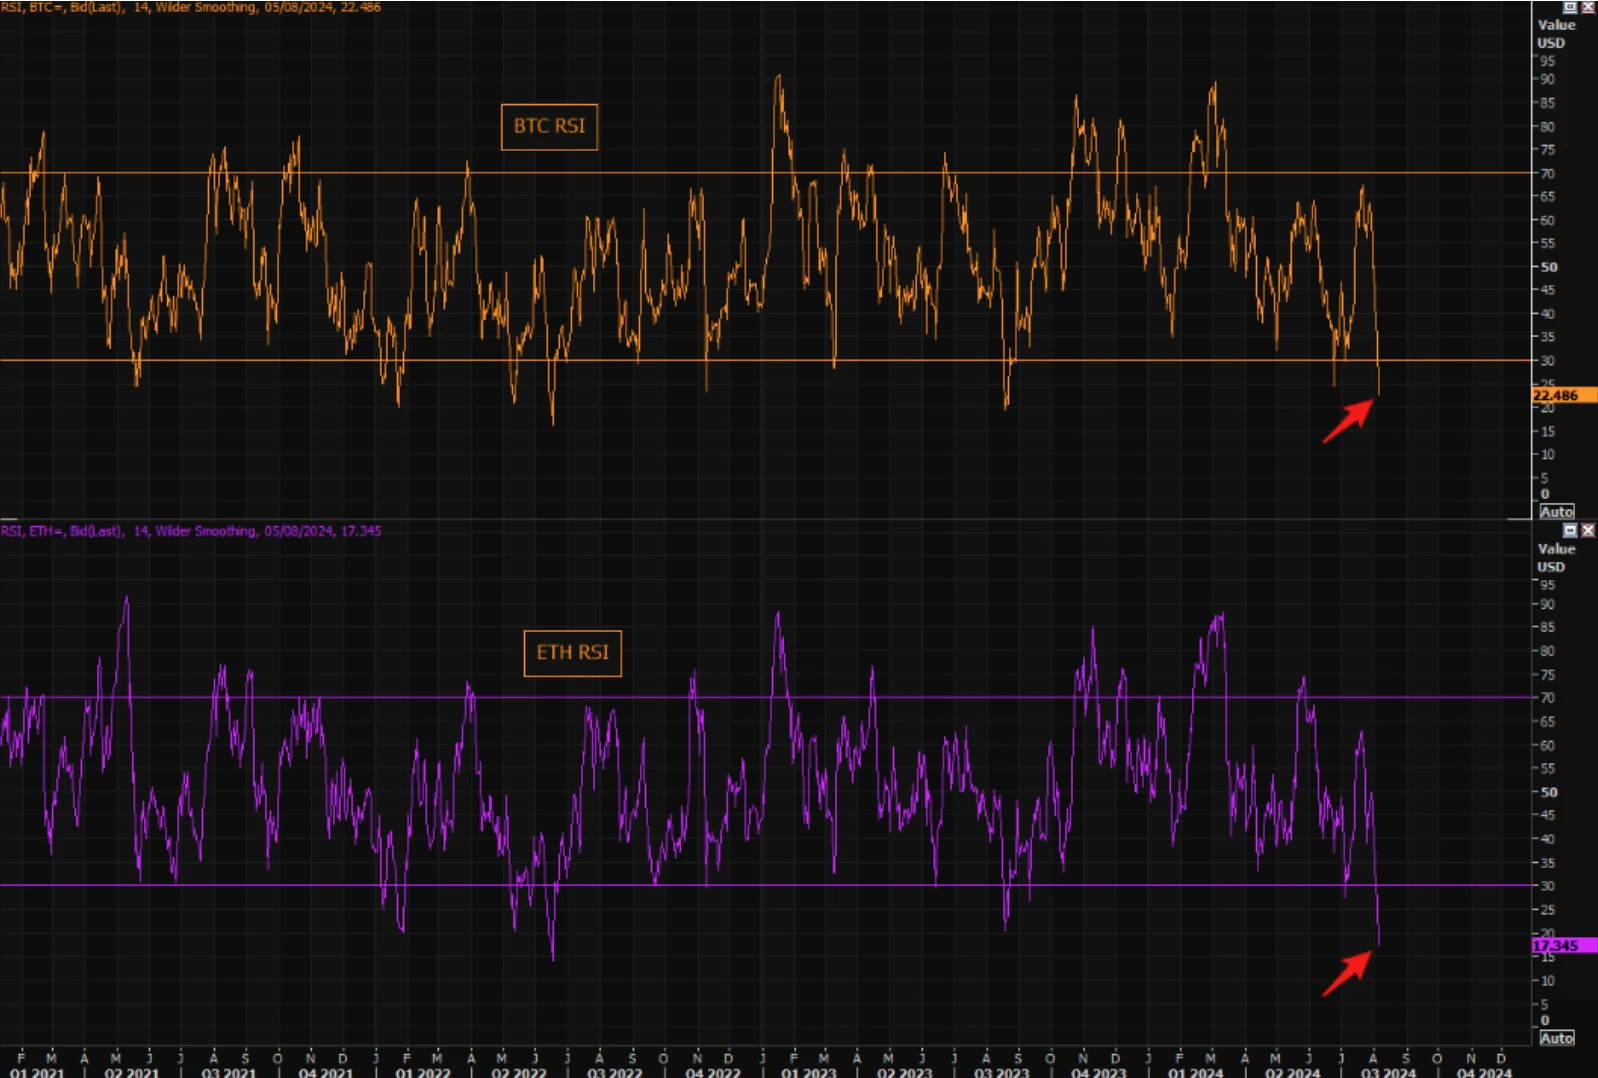
So it’s understandable why the crypto rally has been so strong.
The following analysis is quoted from JPM’s August 7 study:
Retail investors also played a major role in this correction. Bitcoin spot ETFs saw a significant increase in flows in August, reaching the highest monthly outflows since the inception of these ETFs.

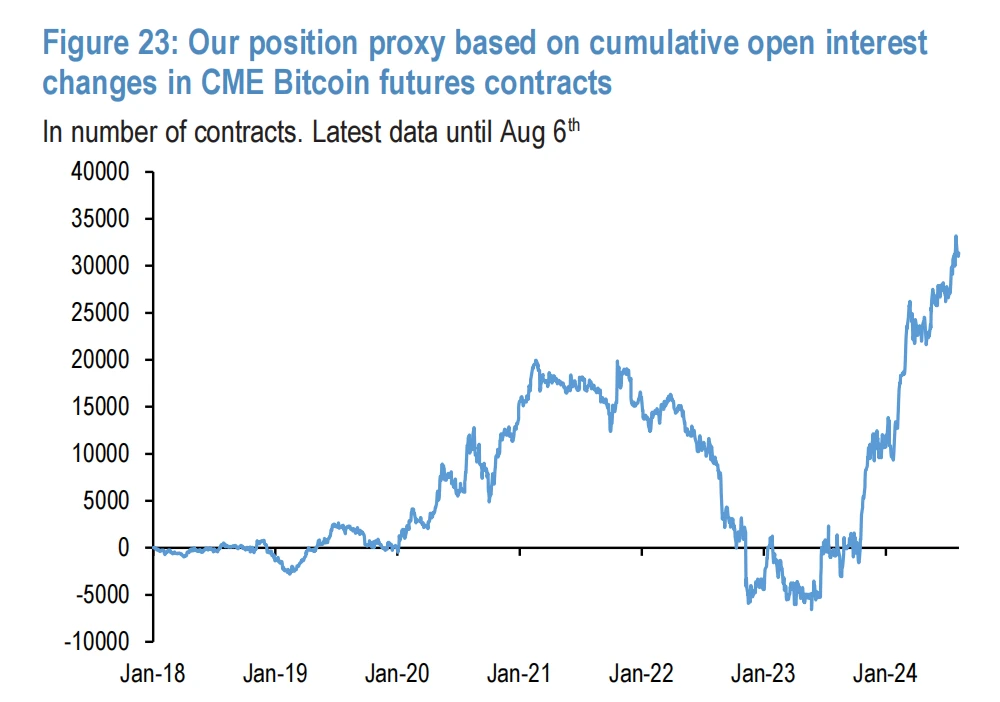
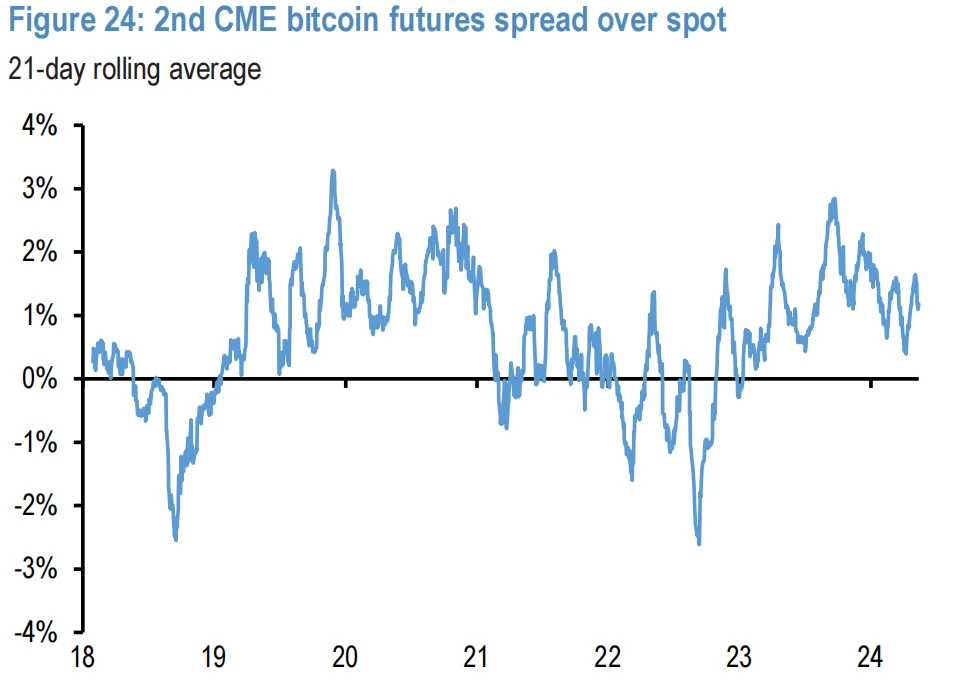
In contrast, there has been limited de-risking by players in the US futures market. This can be seen from the changes in open interest in CME Bitcoin futures contracts, where the positive spread of the futures curve suggests that futures investors still maintain a certain degree of optimism.
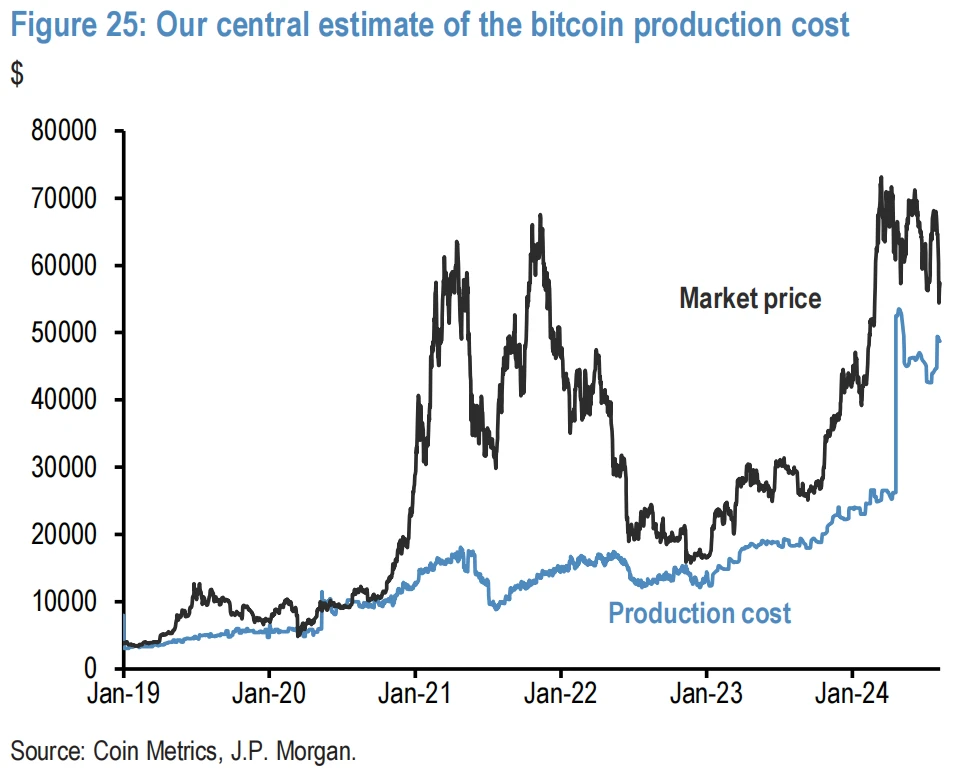
Bitcoin hit a low of around $49,000 last week. This price level is comparable to the cost of Bitcoin production estimated by JPMorgan Chase. If Bitcoin prices remain at or below this level for a long time, it will put pressure on miners, which in turn could exert further downward pressure on Bitcoin prices.
Several factors may keep institutional investors optimistic:
-
Morgan Stanley recently allowed its wealth advisors to recommend a Bitcoin spot ETF to clients.
-
Liquidation pressure for cryptocurrency payments from the Mt. Gox and Genesis bankruptcies may have passed.
-
The more than 10 billion US dollars in cash payments after FTX’s bankruptcy may further stimulate demand in the crypto market by the end of the year.
-
Both parties in the U.S. election are likely to support cryptocurrency-friendly regulations.
Funds and Positions
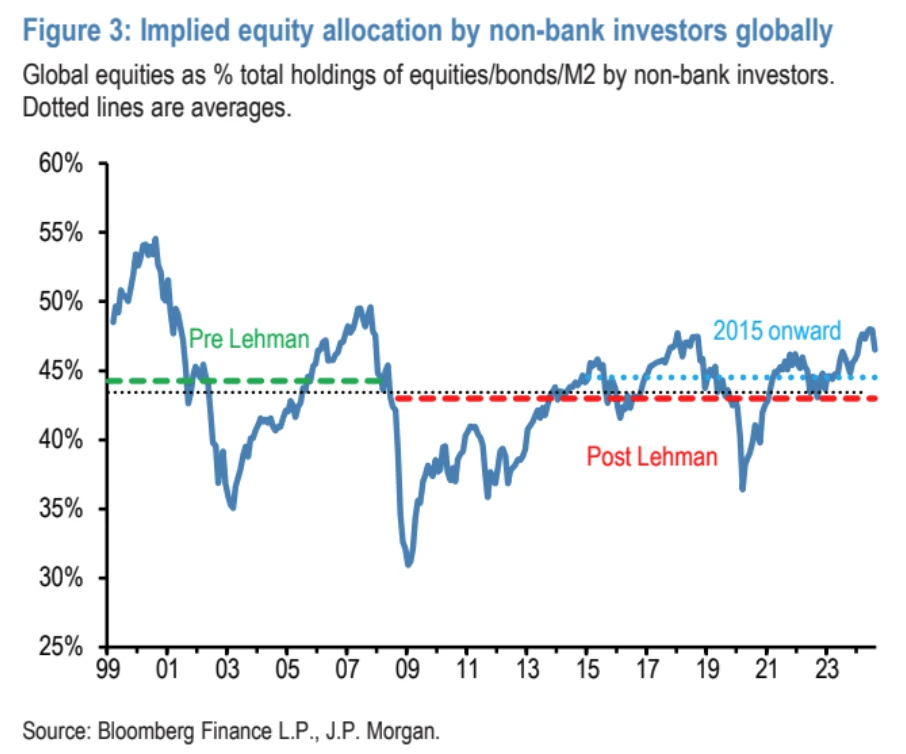
Although the equity allocation has been significantly reduced in recent weeks due to falling stock prices and a sharp increase in bond allocations, the current equity allocation (46.5%) is still significantly higher than the average level after 2015. According to JP Morgan calculations, for equity allocations to return to the average level after 2015, stock prices would need to fall a further 8% from current levels.
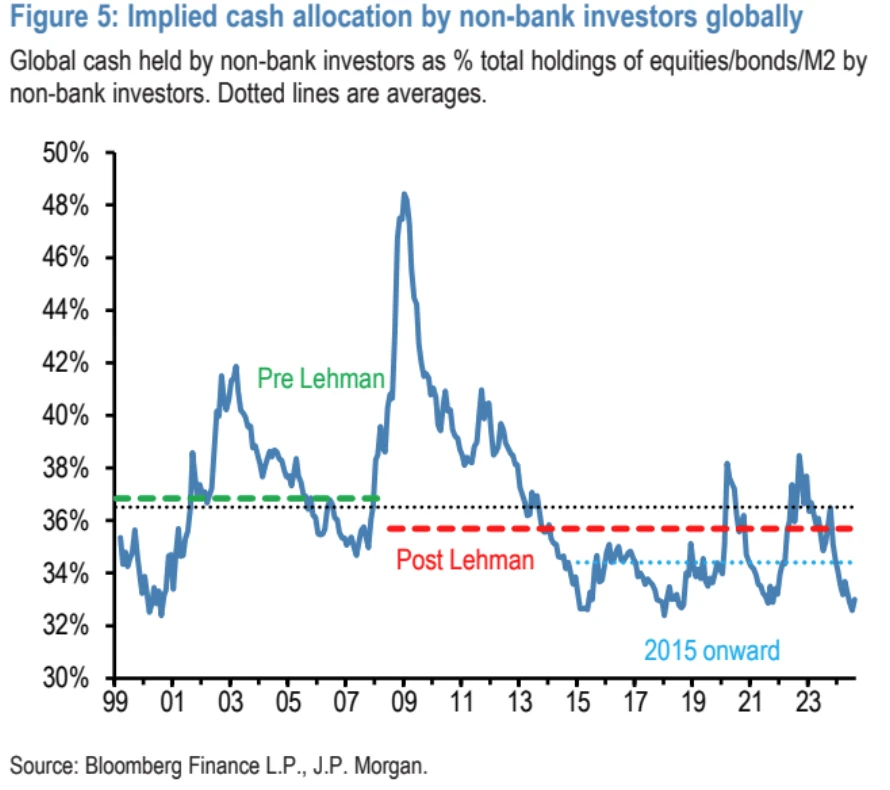
The current cash allocation ratio of investors is extremely low, which indicates that investors funds are more concentrated in stocks and bonds. Low cash allocation may increase the markets vulnerability when facing pressure, because when the market falls, investors may need to sell assets to obtain cash, which may exacerbate market volatility.
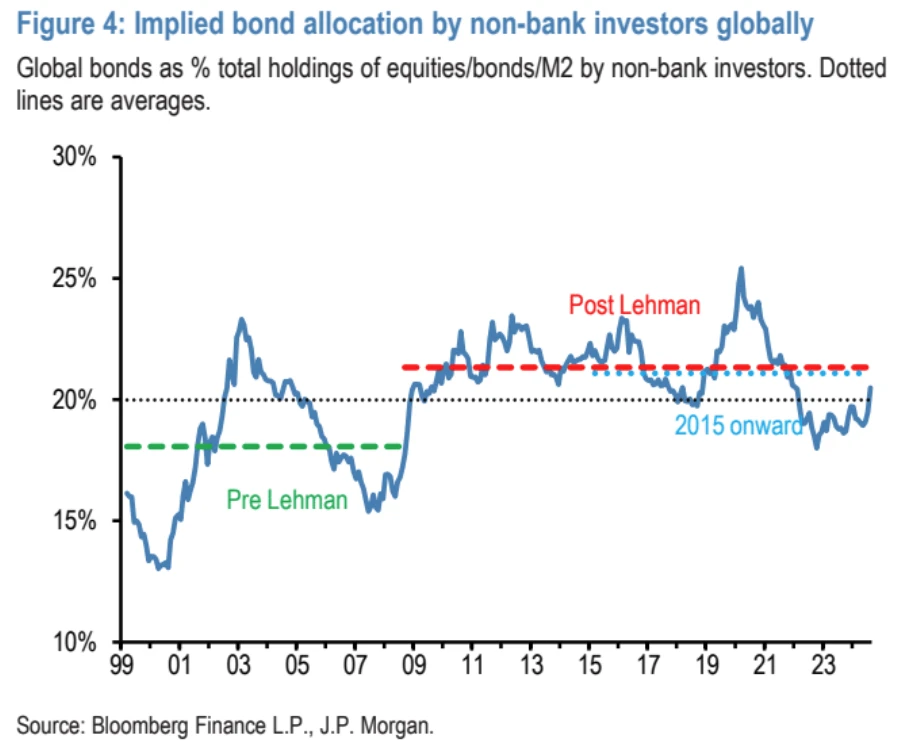
There has been a notable increase in bond allocations recently as investors turn to bonds as a safe haven during equity corrections:
Retail investors have reacted relatively mildly to recent market volatility, with no large-scale withdrawals:
Retail investor sentiment surveys remain positive:

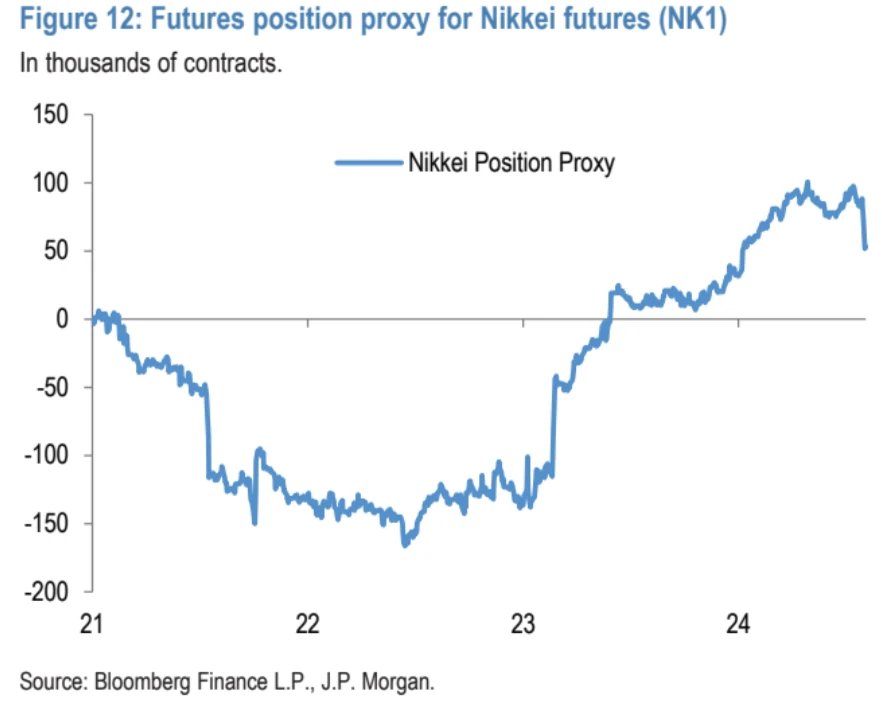
Changes in Nikkei futures positioning indicate that speculative investors have significantly unwound long positions:
Speculative net shorts in the Japanese yen (blue line in the chart below) were essentially zero as of last Tuesday:

How big is the “yen carry trade”?
There are three main parts to the yen carry trade:
-
The first part is that foreign investors buy Japanese stocks. To be on the safe side, they will short sell derivatives of the same amount of yen. Recently, due to the decline of Japanese stocks and the rise of the yen, these investors have lost money on both sides and have to close their entire portfolio. According to the statistics of the Japanese government on the amount of foreign investment in Japanese stocks, it is estimated that the scale of this transaction is about 600 billion US dollars.
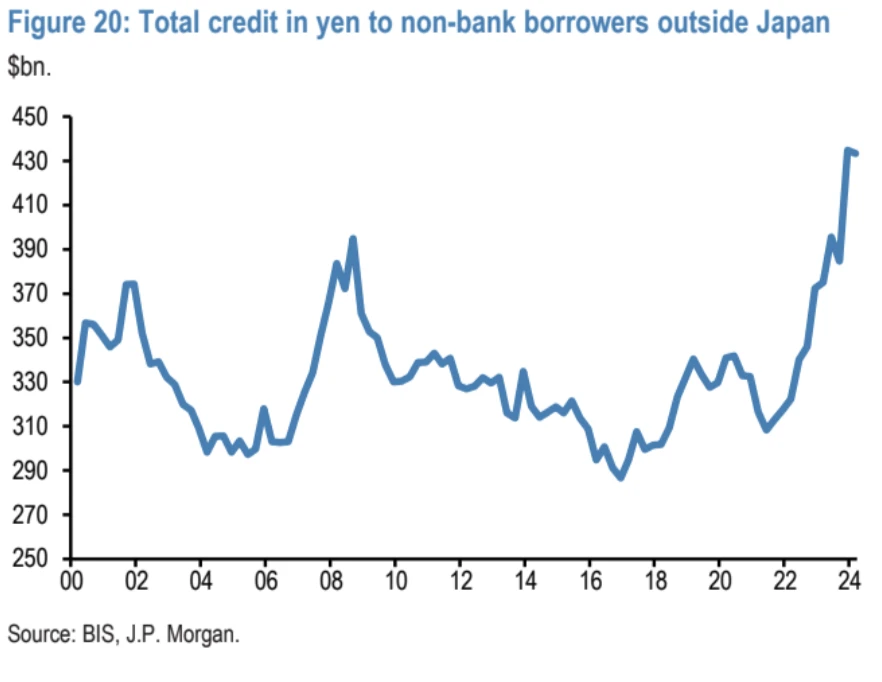
-
The second part is foreign investors borrowing yen to buy assets abroad, such as stocks and bonds. According to the Bank for International Settlements total yen credit to non-bank borrowers outside Japan, this operation was about $420 billion at the end of the first quarter of 2014. However, the relevant data is updated only once a quarter, and the second quarter data is not available yet.
-
The third part is domestic investors, that is, Japanese investors use yen to buy foreign stocks and bonds. For example, Japanese pension funds will use yen to buy foreign stocks and bonds in order to pay for future payments. This kind of transaction is about 3.5 trillion US dollars before adjustment, of which about 60% are foreign stocks.

If we add these three parts together, the total size of the yen carry trade is estimated to be about $4 trillion. If Japans inflation situation in the future forces the Bank of Japan to raise interest rates, then this trade will gradually decrease. So this is why short-term positions are completely unwound but long-term positions may still be affected.
In summary, different types of investors are adjusting their investment strategies according to market changes:
-
Trend following or speculative investors (such as CTA): Recently they have had to sell a large number of their previously held long stock and short yen positions.
-
Yen carry trade: If the yen appreciates, this operation will lose money. Although the yen trade has changed from oversold to overbought, overall, this $4 trillion trade has not been unwound on a large scale.
-
Risk Parity Funds: They are also reducing their investments due to recent market volatility, but less than CTAs. However, the rise in bond prices has helped them limit their losses.
-
Ordinary retail investors: Compared with previous stock market declines, their withdrawals this time are not much
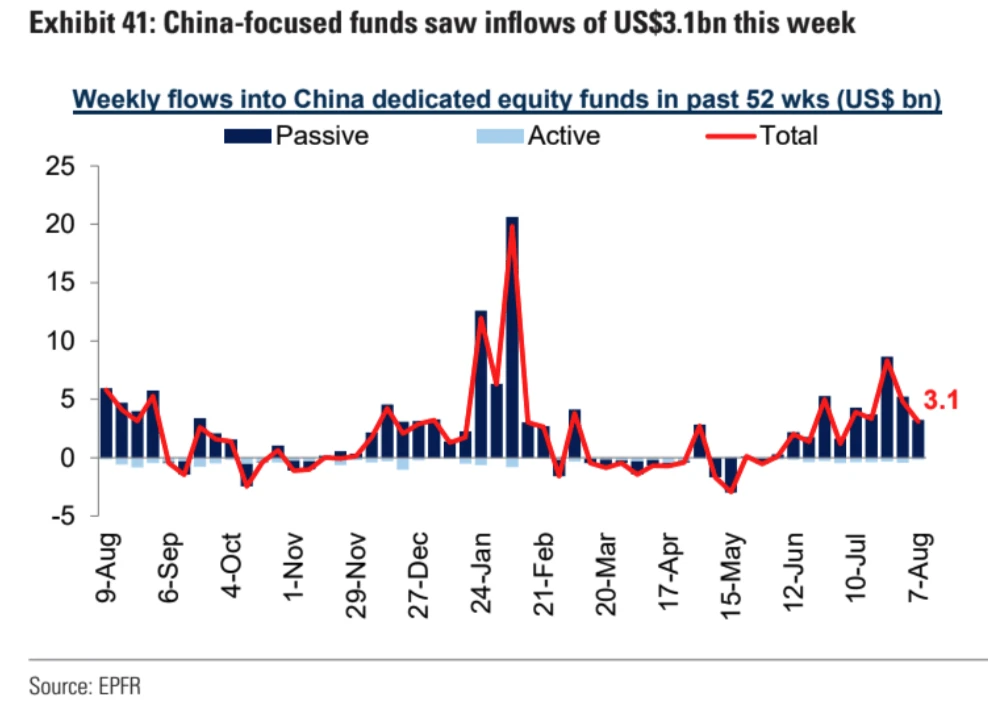
China-themed funds have inflows of $3.1 billion. Passive funds have continued to buy since the end of May:
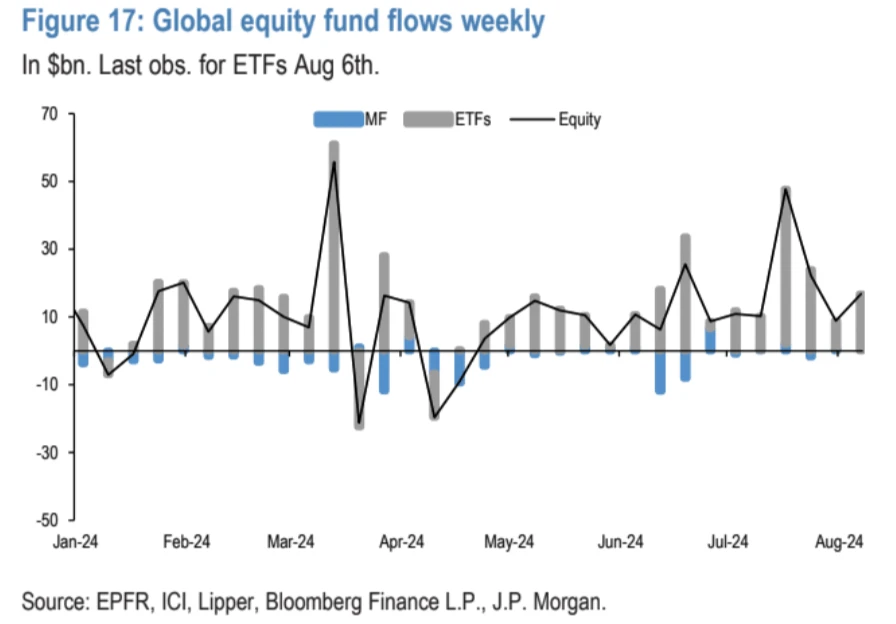
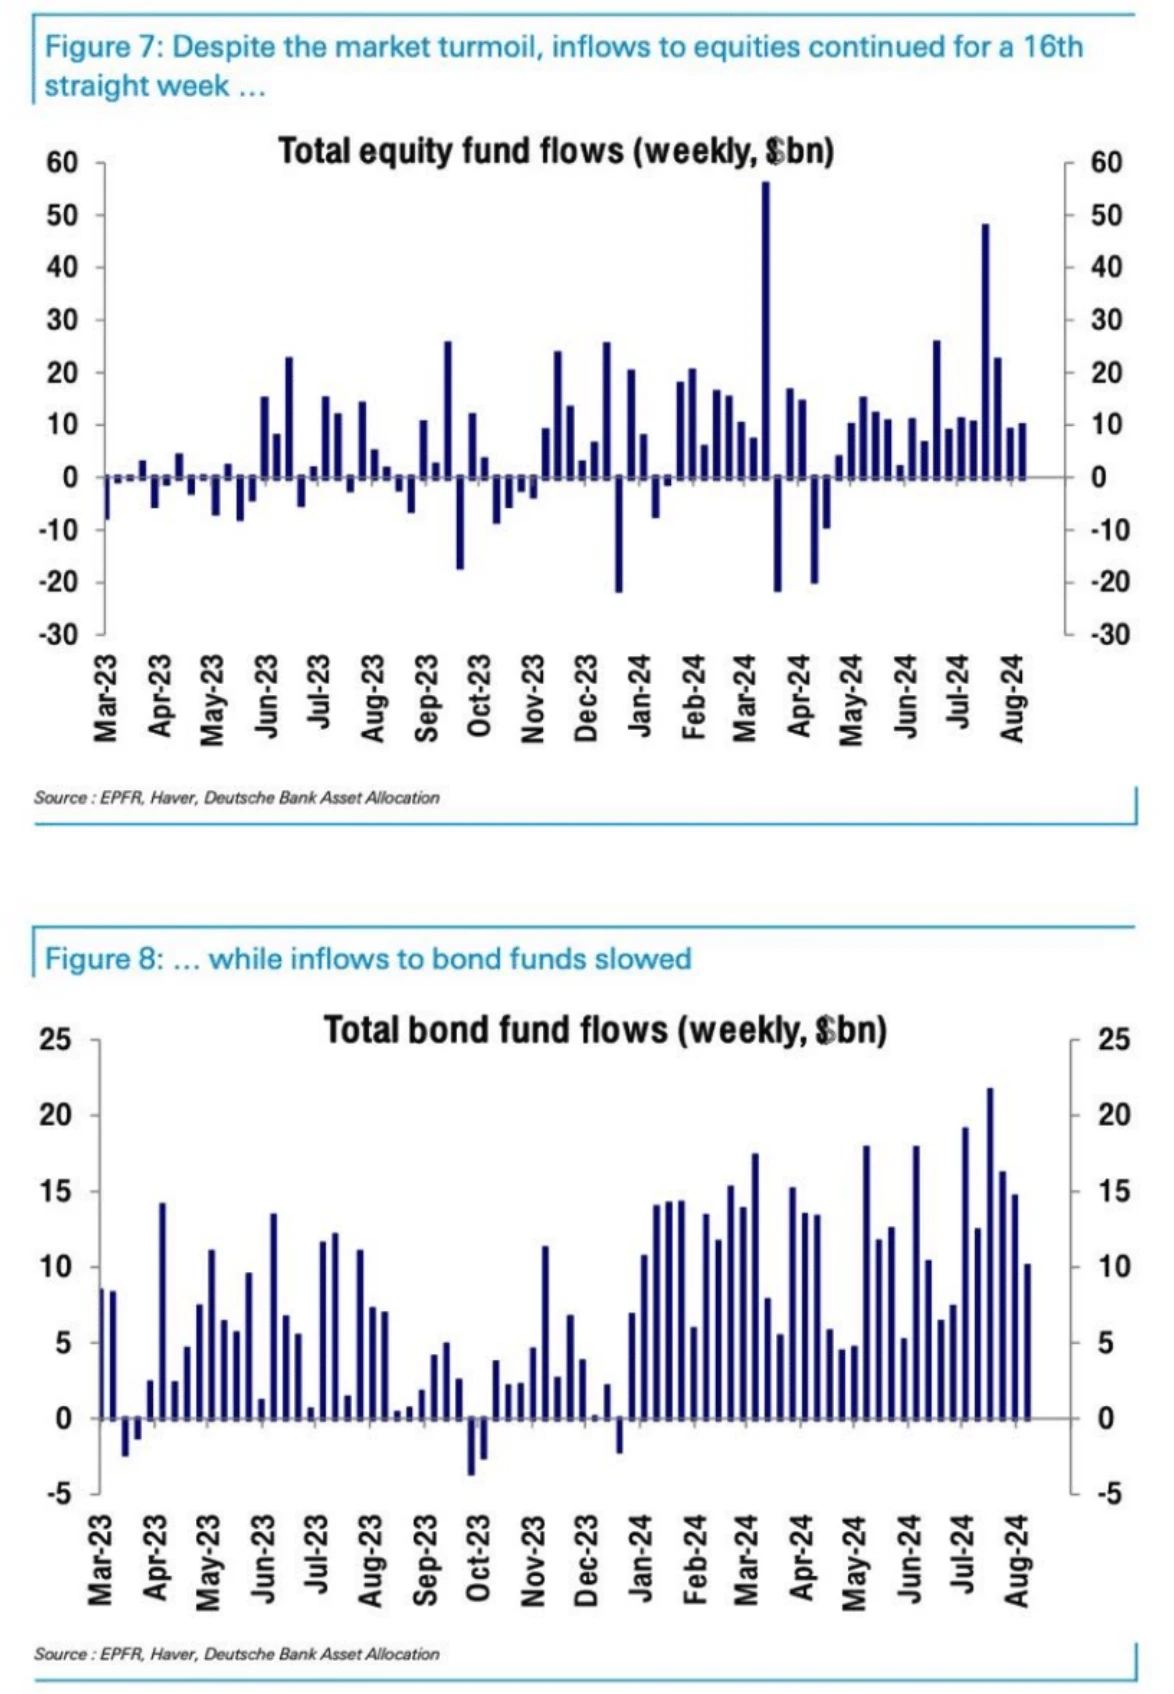
Despite the market turmoil, equity inflows remained positive for the 16th week in a row and even increased from the previous week. Bond inflows slowed
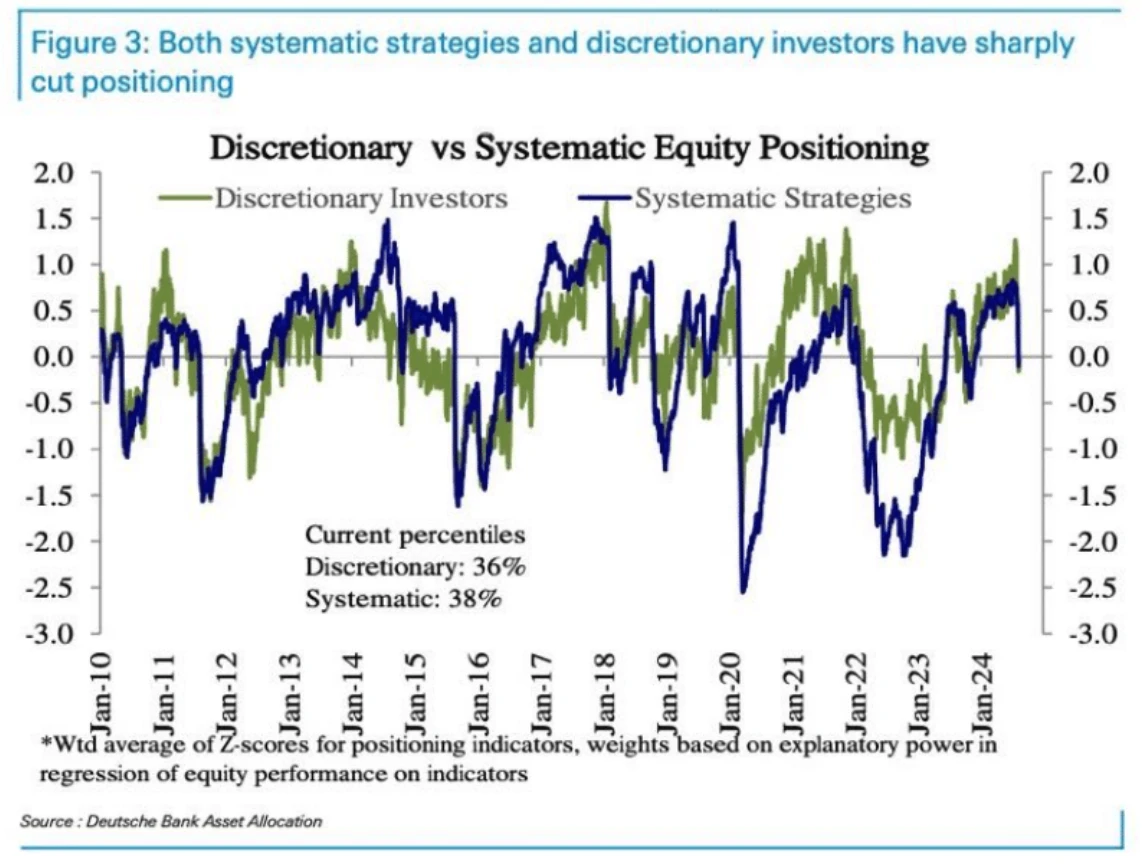
The allocation of discretionary investors has dropped from a high level to slightly below average (36th percentile). The allocation of systematic strategies has also dropped from a high level to slightly below average (38th percentile). Both have fallen to such low levels for the first time since the big correction last summer:

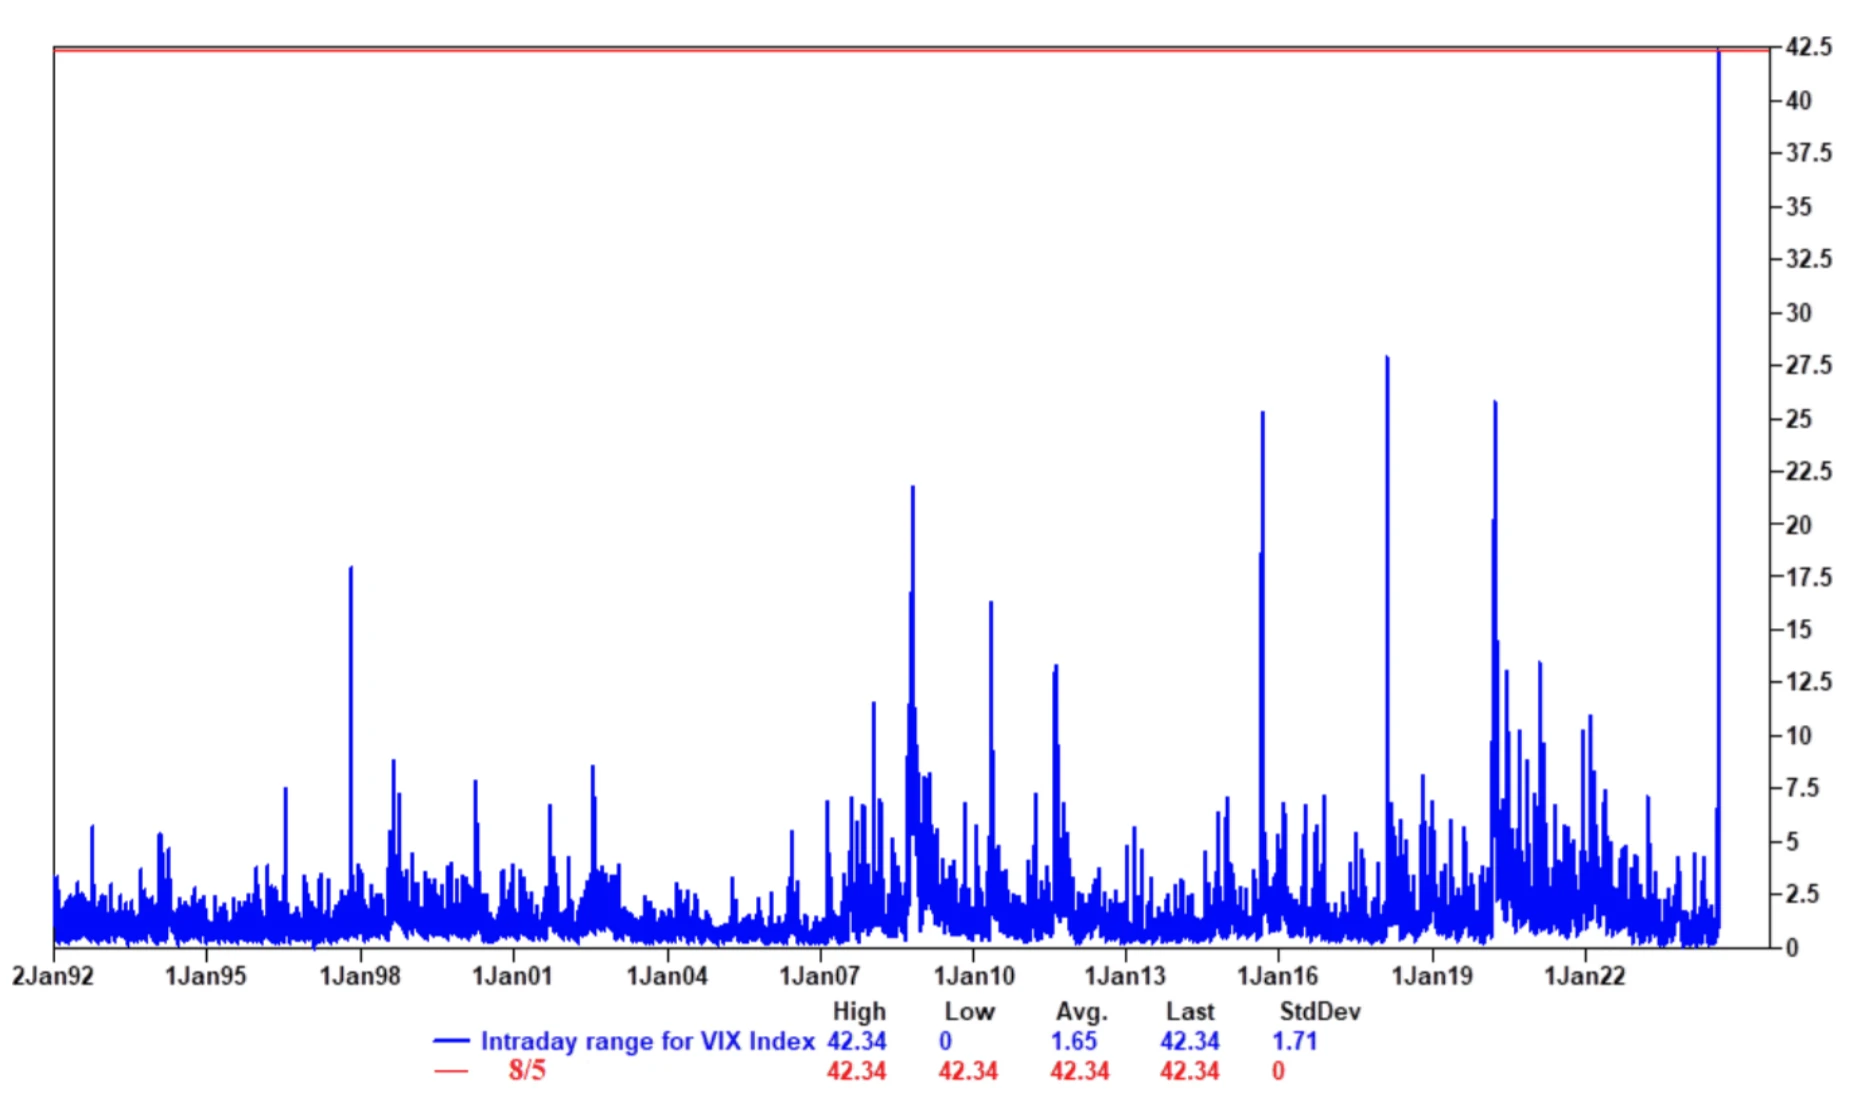
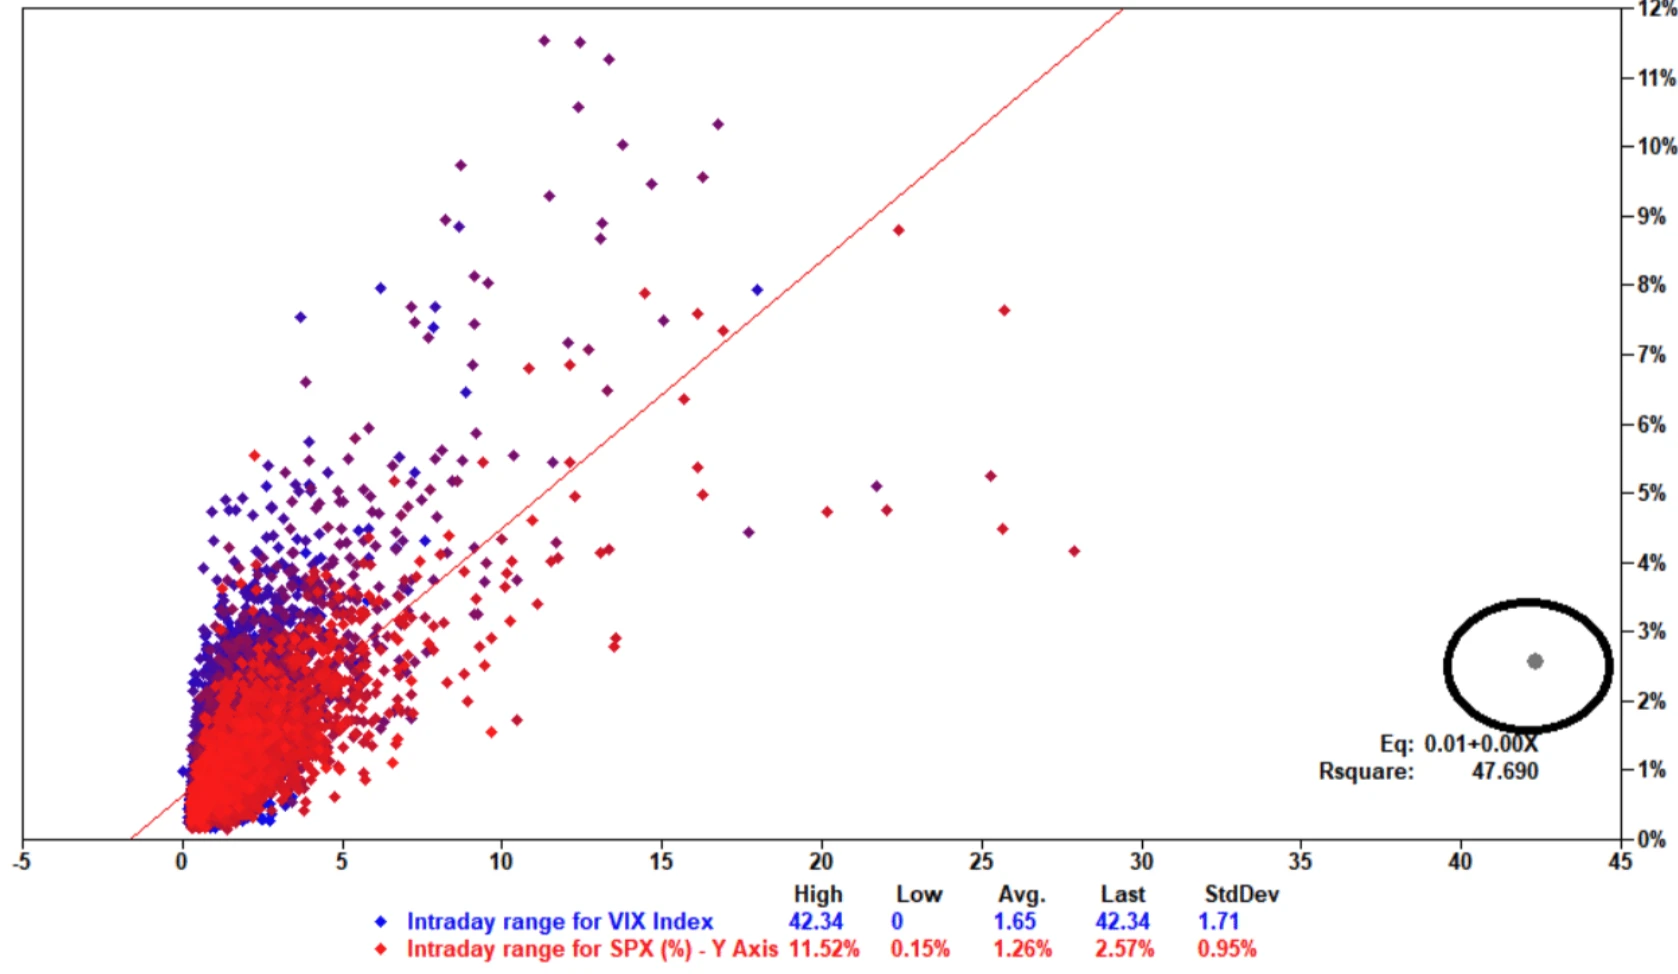
This Monday, the VIX index fluctuated more than 40 points in one day, setting a record. However, considering that the market fluctuated less than 3% on Monday, historically, when the VIX jumped 20 points in one day, the stock market spot volatility could reach 5% to 10%. Therefore, the Goldman Sachs trading desk commented that this was a vol market shock, not a stock market shock. There are problems with the liquidity of the VIX market, and the panic in the derivatives market has been amplified. The market may remain turbulent before the VIX expires on August 21:
According to statistics from Goldman Sachs brokerage department, clients sold product funds for the third consecutive week last week, while individual stocks recorded the largest net purchase in six months, especially in the information technology, consumer staples, industrial, communication services and financial sectors. This seems to indicate that if the economic data is relatively optimistic, investors may shift their attention from the overall market risk (market beta) to individual stocks or industry-specific opportunities (alpha).

U.S. stock liquidity is at its lowest level since May last year:

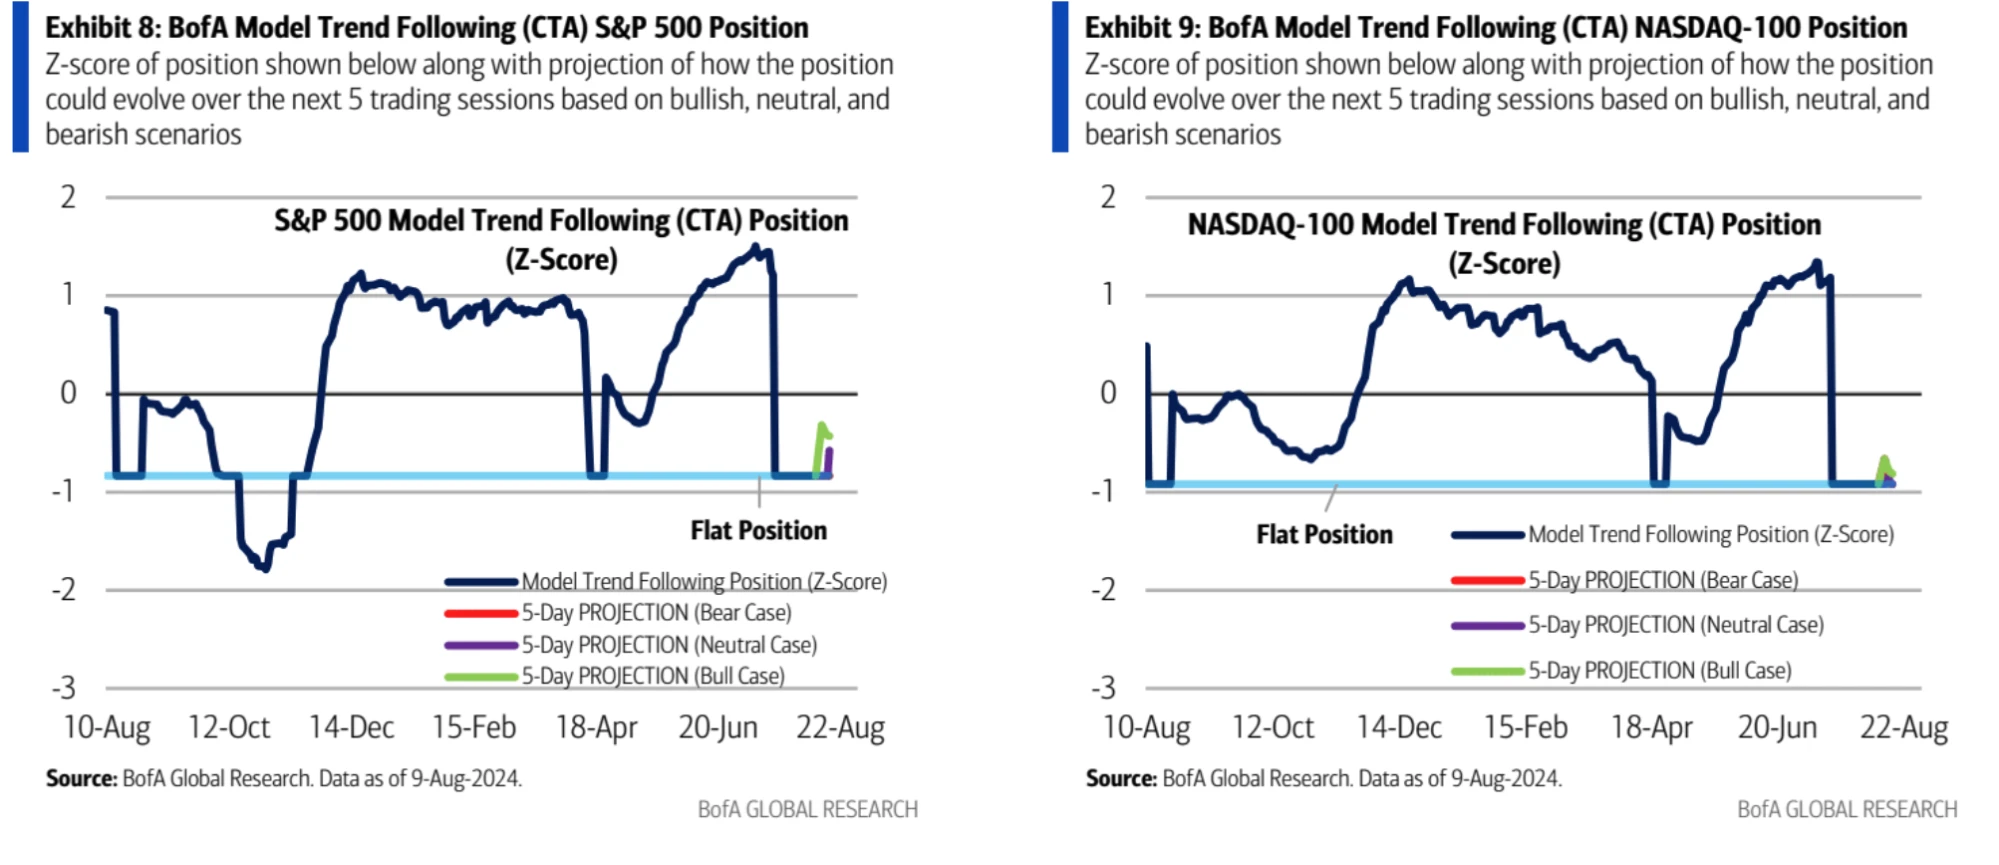
Bank of Americas CTA strategy model shows that U.S. stock CTA funds tend to increase their holdings in the coming week as the long-term trend of U.S. stocks remains bullish. Therefore, CTAs are unlikely to turn short soon. Instead, they may quickly rebuild stock long positions after the stock market finds support.
Japanese stocks tend to reduce their holdings:

Upcoming key events
-
Consumer Price Index (CPI): CPI data is expected to have an impact on the market. If CPI is in line with expectations or lower than expectations, the market may not react much. If CPI is higher than expected, it will be a major problem.
-
Retail Sales Data: If the data is strong, the market may be optimistic about a soft landing.
-
Jackson Hole Conference: The Fed is expected to convey a message of support for markets and may also mention tightening financial conditions.
-
Nvidia earnings report: The company is expected to release its earnings report at the end of the month and the market is likely to view its performance positively.
This article is sourced from the internet: Cycle Capital Macro Weekly Report (8.12): Roller Coaster Market
Related: YBB Capital: From modularization to aggregation, exploring the Agglayer core of Polygon 2.0
Original author: YBB Capital Researcher Zeke TLDR Agglayer is a core component of Polygon 2.0, which unifies decentralized blockchains by aggregating and ensuring atomic cross-chain transactions. Its goal is to provide a seamless user experience at the single-chain level and solve the liquidity and state fragmentation problems of the existing blockchain ecosystem. Agglayer uses a new verification mechanism called pessimistic proof, which assumes that all access chains are insecure and ultimately uses zero-knowledge proof to ensure the correctness of cross-chain operations. Agglayer is more concise and efficient, and its final form will achieve a more ideal chain abstraction and be more in line with the definition of the next generation Web3. 1. Agglayer derives from the modular era 1.1 Agglayer Introduction Agglayer is one of the core components of Polygon…