原作者: Alex Xu , Lawrence Lee
介绍
As one of the oldest tracks in the crypto field, the Defi track has not performed well in this bull market. The overall increase of the Defi sector in the past year (41.3%) is not only far behind the average level (91%), but even behind Ethereum (75.8%).
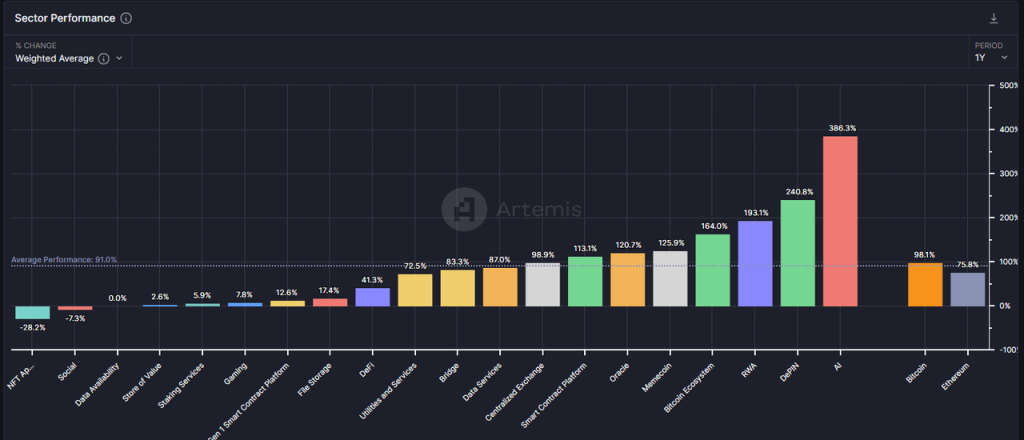
Data source: artemis
If we only look at the data from 2024, it is also difficult to say that the performance of the Defi sector is good, with an overall decline of 11.2%.
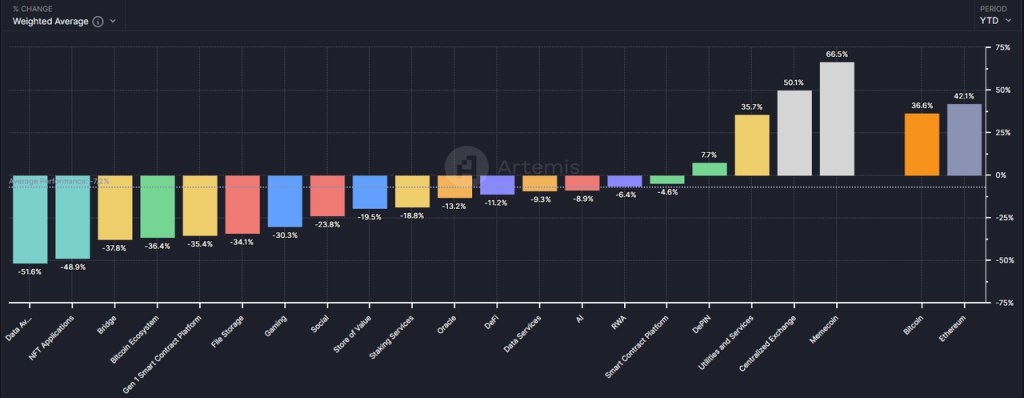
Data source: artemis
However, in my opinion, in the peculiar market context where BTC hit a new high and then altcoins fell together, the Defi sector, especially the leading projects in it, may have ushered in the best layout time since its birth.
Through this article, the author hopes to clarify the view on the value of Defi at the current moment by discussing the following questions:
-
The reason why altcoins have significantly underperformed BTC and Ethereum in this round
-
Why now is the best time to focus on Defi
-
Some Defi projects worth paying attention to, as well as their value sources and risks
This article is far from covering all the Defi projects with investment value in the market. The Defi projects mentioned in the article are only for example analysis and are not investment advice.
This article is the author’s interim thinking up to the time of publication. It may change in the future, and the views are highly subjective. There may also be errors in facts, data, and reasoning logic. Criticism and further discussion from colleagues and readers are welcome.
The following is the main text.
The mystery behind the sharp drop in altcoin prices
In my opinion, the current round of altcoin price performance is not as good as expected. There are three main internal reasons in the crypto industry:
-
Insufficient growth on the demand side: lack of attractive new business models, and PMF (product market fit) is far away in most tracks
-
Supply-side overgrowth: industry infrastructure is further improved, the threshold for entrepreneurship is further lowered, and new projects are over-issued
-
The unblocking trend continues: Tokens of low-circulation and high-FDV projects continue to be unlocked, bringing heavy selling pressure
Let’s look at the background of each of these three reasons.
Insufficient growth on the demand side: The first bull market lacked an innovative narrative
在文章中 Preparing for the main upward wave of the bull market, my phased thoughts on this cycle written by the author in early March, I mentioned that this bull market lacks business innovation and narratives of the same magnitude as Defi in 2021 and ICO in 2017. Therefore, the strategy should be to overweight BTC and ETH (benefiting from the incremental funds brought by ETFs) and control the allocation ratio of altcoins.
So far, this view is very correct.
The lack of new business stories has led to a significant reduction in the inflow of entrepreneurs, industry investment, users and funds. More importantly, this situation has suppressed investors overall expectations for the development of the industry. When the market has not seen stories such as Defi will devour traditional finance, ICO is a new innovation and financing paradigm and NFT subverts the content industry ecosystem for a long time, investors will naturally vote with their feet and move towards places with new stories, such as AI.
Of course, I do not support overly pessimistic views. Although no attractive innovations have been seen in this round, the infrastructure is constantly improving:
-
Block space fees have dropped significantly, from L1 to L2
-
Cross-chain communication solutions are gradually becoming more complete, with a rich list of options
-
User-friendly wallet experience upgrade, such as Coinbases smart wallet supports fast creation and recovery without private keys, direct call of cex balance, no need to recharge gas, etc., allowing users to get close to web2 product experience
-
Solana’s Actions and Blinks features can publish on-chain interactions with Solana to any common Internet environment, further shortening the user’s usage path
The above infrastructure is like water, electricity, coal and roads in the real world. They are not the result of innovation, but they are the soil for the emergence of innovation.
Excessive growth on the supply side: excessive issuance of projects + continuous unlocking of high-market-value tokens
In fact, looking at it from another angle, although the prices of many altcoins have hit new lows this year, the total market value of altcoins has not fallen as badly as compared to BTC.
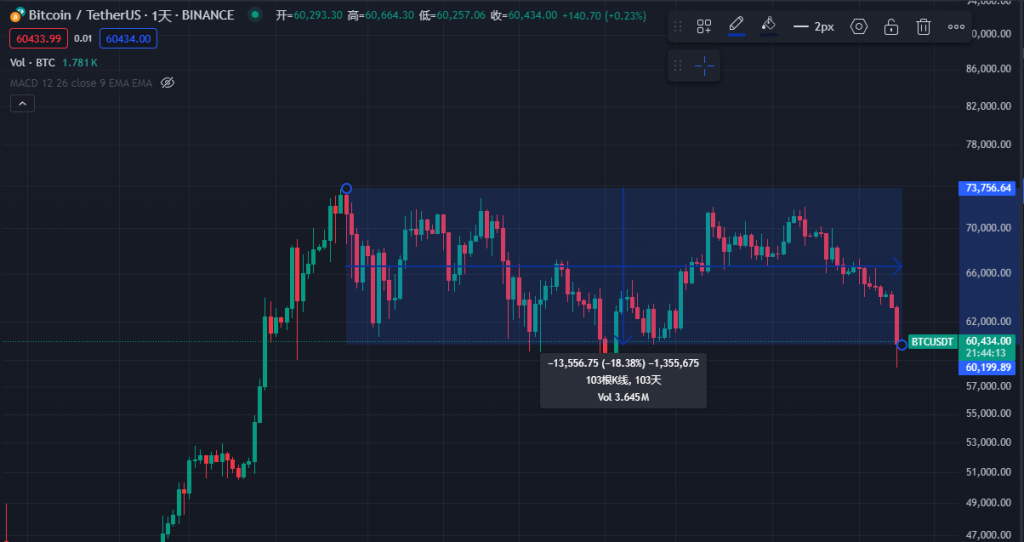
Data: Trading view, 2024.6.25
So far, the price of BTC has fallen by about 18.4% from its high, while the total market value of altcoins (shown as Total3 in the Trading View system, which represents the total crypto market value after deducting BTC and ETH) has only fallen by -25.5%.
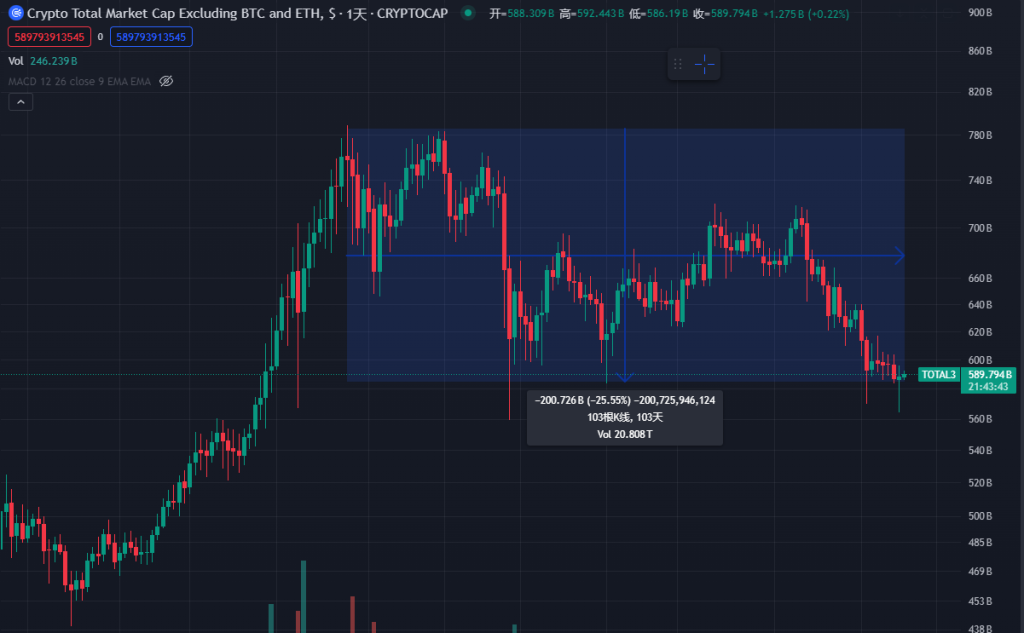
Data: Trading view, 2024.6.25
The limited decline in the total market value of altcoins is based on the substantial expansion of the total amount of newly added altcoins and their market value. From the figure below, we can intuitively see that the growth trend of the number of tokens in this bull market is the fastest in history.
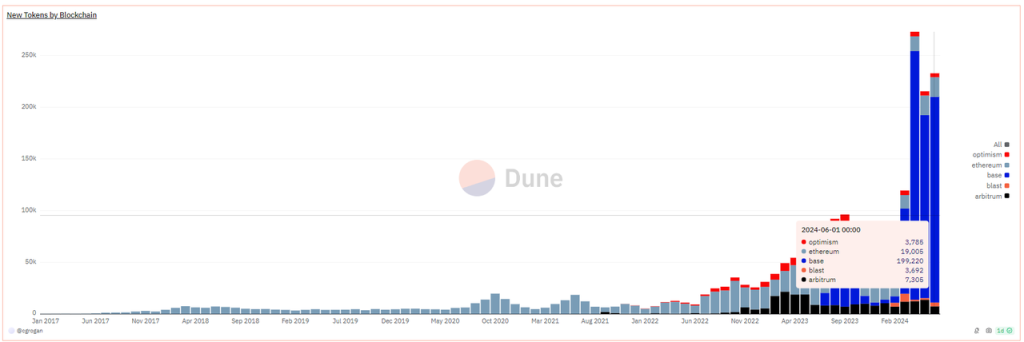
New Tokens by Blockchain, data source: https://dune.com/queries/3729319/6272382
It should be noted that the above data only counts the token issuance data of the EVM chain. More than 90% are issued on the Base chain. In fact, more new tokens are contributed by Solana. Whether it is Solana or Base, most of the newly issued tokens are memes.
Among them, the representative memes with higher market value that have emerged in this round of bull market are:
dogwifhat: 2.04 billion
Brett: 1.66 billion
Notcoin: 1.61 billion
DOG GO TO THE MOON: 630 million
Mog Coin: 560 million
Popcat: 470 million
Maga: 410 million
In addition to memes, a large number of infrastructure tokens are also or will be issued this year, such as:
The second layer network includes:
-
Starknet: Market capitalization 930 million, FDV 7.17 billion
-
ZKsync: Circulating market value 610 million, FD V3 510 million
-
Manta network: circulating market value 330 million, FD V1 20 million
-
Taiko: Circulating market value 120 million, FD V1 900 million
-
Blast: Circulating market value 480 million, FD V2 810 million
Cross-chain communication services include:
-
Wormhole: Circulating market value 630 million, FD V3 480 million
-
Layer 0: Circulating market value 680 million, FD V2 730 million
-
Zetachain: Circulating market value 230 million, FD V1 780 million
-
Omni network: circulating market value 147 million, FD V1 420 million
The chain building services include:
-
Altlayer: Circulating market value 290 million, FD V1 870 million
-
Dymension: Circulating market value 300 million, FD V1 590 million
-
Saga: Circulating market value 140 million, FD V1 500 million
*The above market value data is from Coingecko, the time is 2024.6.28
In addition, there are a large number of tokens that have been listed and are facing massive unlocking. Their common characteristics are low circulation ratio, high FDV, and early institutional rounds of financing, and the token costs of institutional rounds are very low.
The weakness of demand and narrative in this round, coupled with the over-issuance of assets on the supply side, is the first time in the crypto cycle. Although the project parties tried to maintain valuations by further reducing the token circulation ratio at the time of listing (from 41.2% in 2022 to 12.3%) and gradually selling them to secondary investors, the resonance of the two finally led to the overall downward shift of the valuation center of these crypto projects. In 2024, only a few sectors such as Meme, Cex, and Depin maintained positive returns.
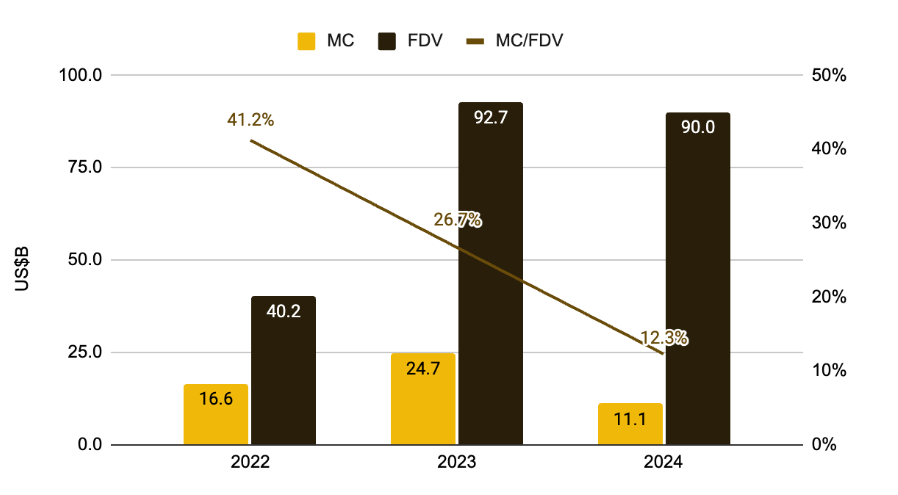
The ratio of MC to FDV of new coins. Image source: Low Float High FDV: How Did We Get Here?, Binance research
However, in my opinion, the collapse of the valuation center of high-market-value VC coins is a normal response of the market to various crypto anomalies:
-
Batch creation of ghost town Rollups, with only TVL and robots but no users
-
Financing through refurbished terms, actually providing similar solutions, such as a large number of cross-chain communication services
-
Start businesses based on hot topics rather than actual user needs, such as a large number of AI+Web3 projects
-
The token has no value capture because it has not found a profit model or simply does not find one.
The decline in the valuation centers of these altcoins is the result of the market’s self-healing, a benign process of bubble bursting, and a self-rescue behavior of funds voting with their feet and clearing the market.
The reality is that most VC coins are not completely worthless, they are just too expensive, and the market will eventually bring them back to where they belong.
It’s the right time to pay attention to Defi: PMF products, get out of the bubble period
Since 2020, Defi has officially become a category in the altcoin cluster. In the first half of 2021, the most popular projects in the top 100 crypto market capitalization rankings were Defi projects. At that time, there were so many categories that it was dizzying, vowing to redo all existing business models in traditional finance on the chain.
In that year, Defi was the infrastructure of the public chain. DEX, lending, stablecoins, and derivatives were the four must-haves after the new public chain went online.
However, with the over-issuance of homogeneous projects and a large number of hacker attacks (embezzlement), the TVL obtained by relying on the Ponzi model of stepping on the left foot with the right foot collapsed rapidly, and the price of the spiraling tokens spiraled back to zero.
Entering this round of bull market cycle, the price performance of most Defi projects that have survived to this day is not satisfactory, and primary investment in the Defi field is decreasing. As at the beginning of any bull market, investors like the new stories that have emerged in this cycle the most, and Defi does not belong to this category.
But it is also because of this that Defi projects that have emerged from the bubble have begun to appear more attractive than other altcoin projects. Specifically:
-
Business: Have a mature business model and profit model, and the leading projects have a moat
DEX and derivatives earn transaction fees, lending collects interest spread income, stablecoin projects collect stability fees (interest), and staking services collect pledge service fees. The profit model is clear. The user demand of the top projects in each track is organic, and they have basically passed the user subsidy stage. Some projects still achieve positive cash flow after deducting token emissions.
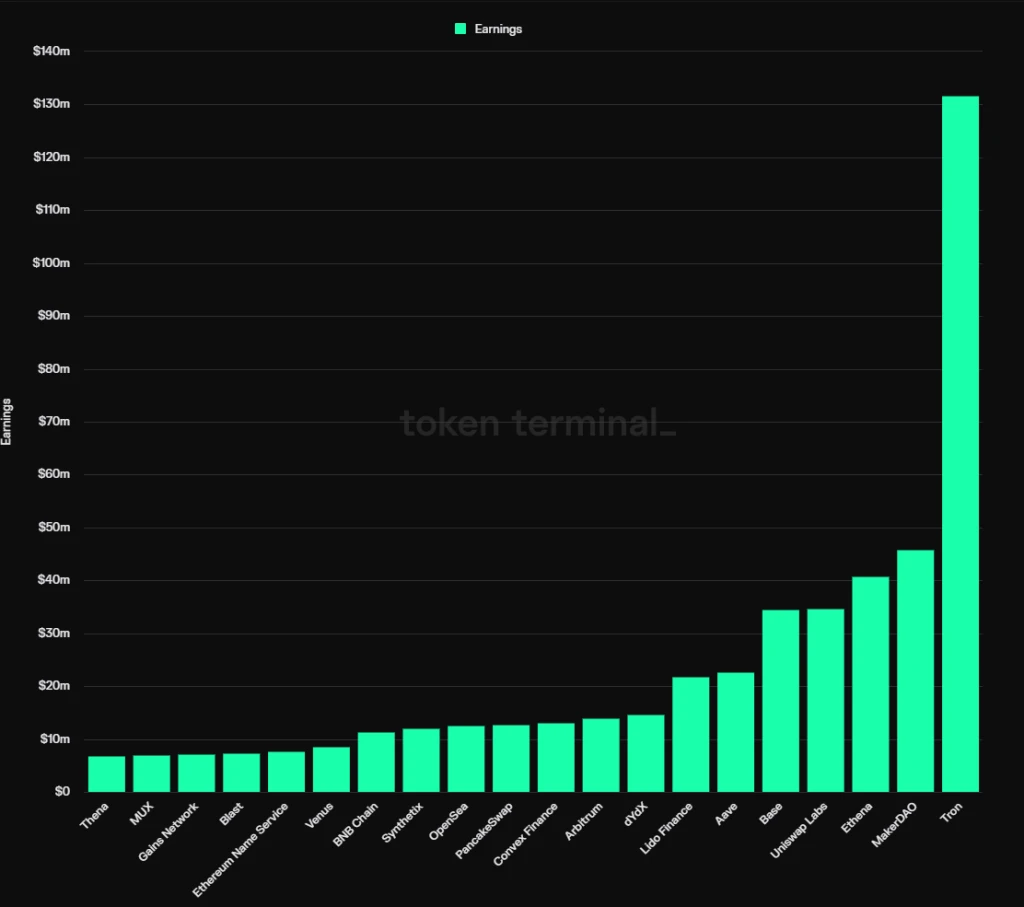
Crypto project profit ranking, source : Tokenterminal
According to Tokentermial’s statistics, of the top 20 most profitable protocols so far in 2024, 12 are DeFi projects, classified as follows:
Stablecoins: MakerDAO, Ethena
Lending: Aave, Venus
Staking service: Lido
DEX: Uniswap labs, Pancakeswap, Thena (income comes from front-end fees)
Derivatives: dYdX, Synthetix, MUX
Revenue Aggregation: Convex Finance
The moats of these projects are varied, some of which come from the multilateral or bilateral network effects of services, some from user habits and brands, and some from special ecological resources. However, judging from the results, the leading Defi projects have shown some commonalities in their respective tracks: market share tends to be stable, the number of later competitors decreases, and they have certain service pricing power.
As for the moat of specific Defi projects, we will elaborate on it in the project section of the third subsection.
-
Supply side: low emission, high circulation ratio, small scale of tokens to be released
In the previous section, we mentioned that one of the main reasons for the continued collapse of altcoin valuations in this round is the high emissions of a large number of projects based on high valuations, as well as the negative expectations brought about by the current huge amount of unblocked tokens entering the market.
As the leading DeFi projects were launched early, most of them have passed the peak period of token emission, and the tokens of institutions have basically been released, so the selling pressure in the future is extremely low. For example, the current token circulation ratio of Aave is 91%, the circulation ratio of Lido is 89%, the circulation ratio of Uniswap is 75.3%, the circulation ratio of MakerDAO is 95%, and the circulation ratio of Convex is 81.9%.
On the one hand, this shows that there will be little selling pressure in the future, but it also means that whoever wants to gain control of these projects can basically only purchase tokens from the market.
-
Valuation: Market attention and business data diverge, and valuation levels fall into historical lows
Compared with new concepts such as Meme, AI, Depin, Restaking, and Rollup services, Defi has received very little attention in this bull market, and its price performance has been mediocre. On the other hand, the core business data of each leading Defi, such as transaction volume, lending scale, and profit level, have continued to grow, forming a divergence between price and business. Specifically, the valuation level of some leading Defi has reached its historical lowest level.
Taking the lending protocol Aave as an example, while its quarterly revenue (referring to net income, not overall protocol fees) has surpassed the peak of the previous cycle and set a new historical high, its PS (market capitalization/annualized revenue) has hit a new historical low, currently only 17.4 times.

Data source: Tokenterminal
-
Policy: FIT 21 is conducive to the compliance of the Defi industry and may trigger potential mergers and acquisitions
FIT 21, the Financial Innovation and Technology for the 21st Century Act, aims to provide a clear federal regulatory framework for the digital asset market, strengthen consumer protection, and promote the United States leadership in the global digital asset market. The bill was proposed in May 23 and passed by the House of Representatives on May 22 this year. Since the bill clarifies the regulatory framework and the rules for market participants, it will be more convenient for both entrepreneurs and traditional finance to invest in Defi projects after the bill is officially passed. Considering the attitude of traditional financial institutions represented by BlackRock towards crypto assets in recent years (promoting the listing of ETFs and issuing treasury assets on Ethereum), Defi is likely to be their key layout area in the next few years. For the end of traditional financial giants, mergers and acquisitions may be one of the most convenient options, and any relevant signs, even if it is just the intention of mergers and acquisitions, will trigger a revaluation of the value of Defis leading projects.
Next, the author will take some Defi projects as examples to analyze their business conditions, moats, and valuations.
Considering the large number of Defi projects, the author will give priority to analyzing projects with better business development, wider moats, and more attractive valuations.
Defi projects worth watching
1. Lending: Aave
Aave is one of the oldest Defi projects. After completing its financing in 2017, it completed the transformation from peer-to-peer lending (the project was called Lend at the time) to a peer-to-pool lending model, and surpassed the leading project in the same track, Compound, in the last bull market cycle. Currently, it ranks first in the lending track in terms of market share and market value.
Aaves main business model is to earn interest income from lending. In addition, Aave launched its own stablecoin GHO last year, which will generate interest income for Aave. Of course, operating GHO also means additional cost items, such as promotion fees, liquidity incentive fees, etc.
1.1 Business Situation
For lending agreements, the most critical indicator is the size of active loans, which is the main source of income for lending projects.
The figure below shows the market share of Aaves active loan size in the past year. In the past six months, Aaves active loan share has continued to rise and has now reached 61.1%. In fact, the ratio is even higher because the chart repeatedly counts the loan volume of Morphos yield optimization module built on Aave and Compound.
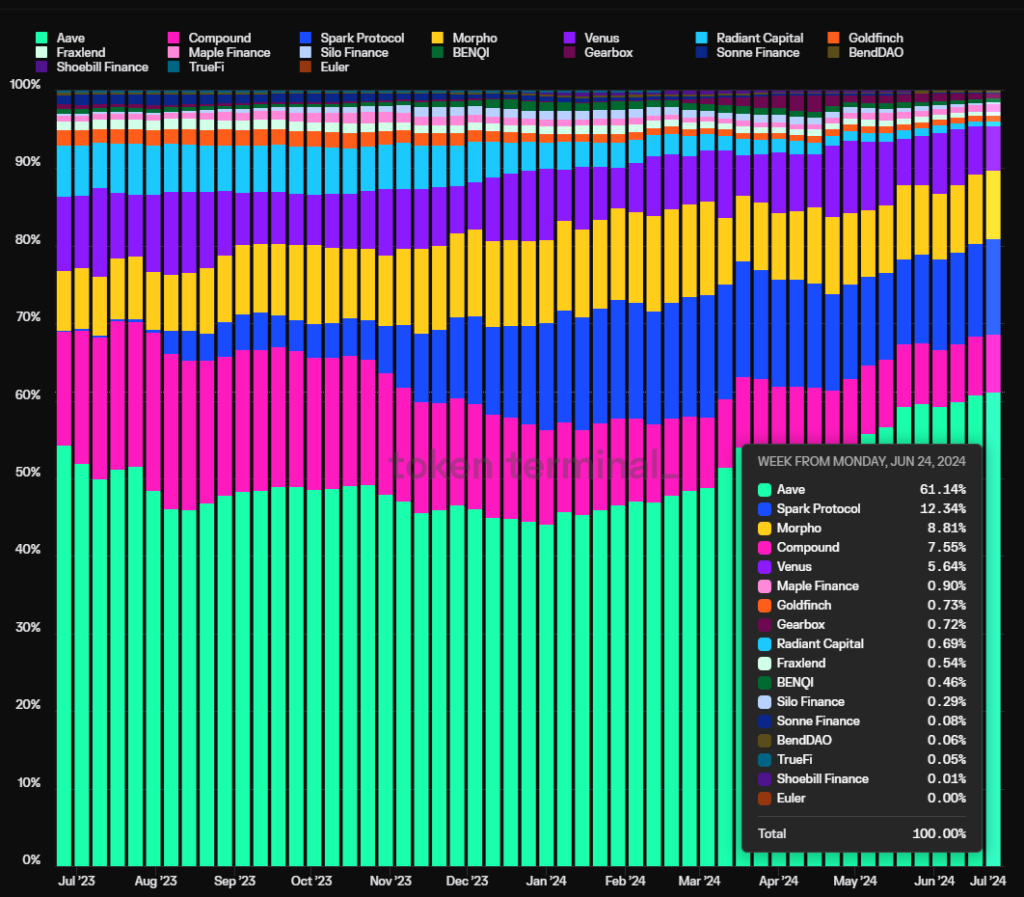
Data source: Tokenterminal
Another key indicator is the profitability of the protocol, that is, the profit level. Profit in this article = protocol revenue – token incentives. As can be seen from the figure below, Aaves protocol profit has opened up a large gap with other lending protocols, and it has long gotten rid of the Ponzi model of stimulating business through token subsidies (represented by Radiant, the purple part in the figure below).
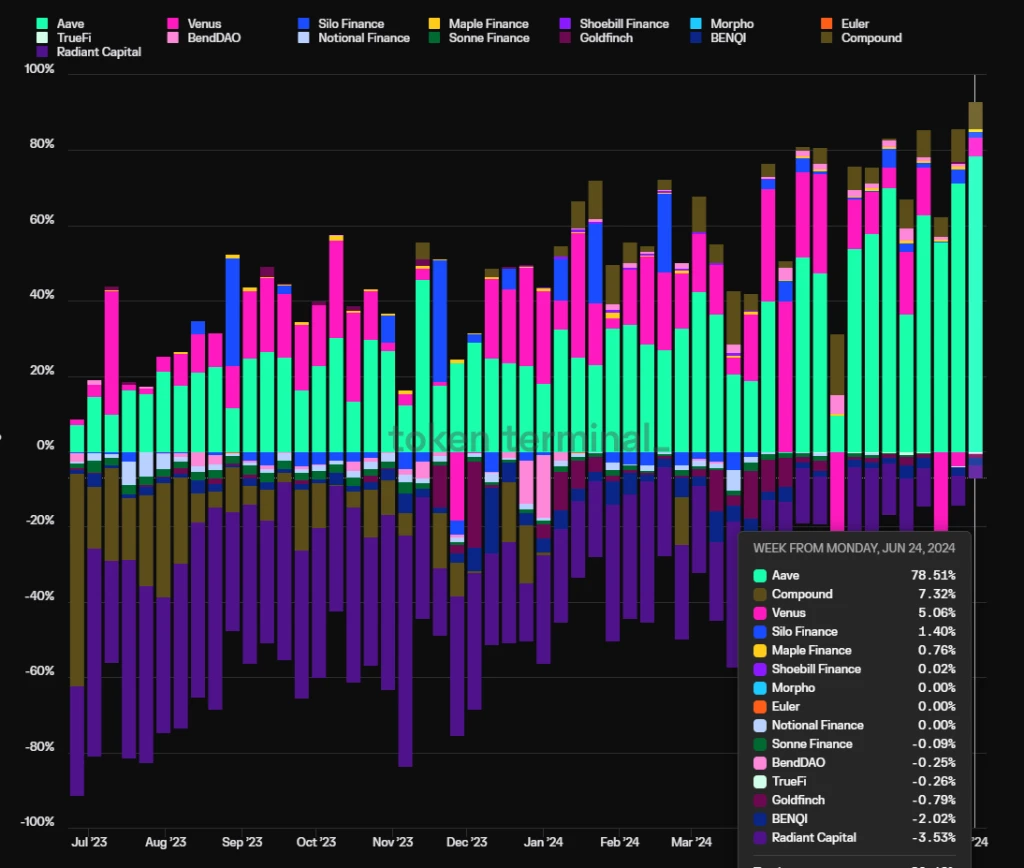
Data source: Tokentermina l
1.2 Moat
Aaves moat mainly consists of the following four points:
1. Continuous accumulation of security credit: Most new lending protocols will have security incidents within one year of going online. Aave has not had a single security incident at the smart contract level since its operation. The security credit accumulated by a platforms risk-free and stable operation is often the top priority for DeFi users when choosing a lending platform, especially for whale users with large capital volumes, such as Justin Sun, who is a long-term user of Aave.
2. Bilateral network effect: Like many Internet platforms, Defi lending is a typical bilateral market, where depositors and borrowers are both supply and demand. The unilateral growth of deposits and loans will stimulate the growth of business on the other side, making it more difficult for later competitors to catch up. In addition, the more abundant the overall liquidity of the platform, the smoother the liquidity in and out of both depositors and borrowers, and the more likely it is to be favored by large capital users, which in turn stimulates the growth of the platform business.
3. Excellent DAO management level: The Aave protocol has fully implemented DAO-based management. Compared with the team-centralized management model, DAO-based management has more complete information disclosure and more complete community discussions on important decisions. In addition, a number of professional institutions with high governance levels are active in the Aave DAO community, including top VCs, university blockchain clubs, market makers, risk management service providers, third-party development teams, financial consulting teams, etc. The sources are rich and diverse, and governance participation is relatively active. Judging from the projects operating results, Aave, as a latecomer in peer-to-pool lending services, has better balanced growth and security in product development and asset expansion, and has surpassed its big brother Compound. In this process, DAO governance played a key role.
4. Multi-chain ecological position: Aave is deployed on almost all EVM L1L2, and TVL is basically at the top of each chain. In the V4 version that Aave is developing, multi-chain liquidity will be connected in series, and the advantages of cross-chain liquidity will be more obvious. See the figure below for details:
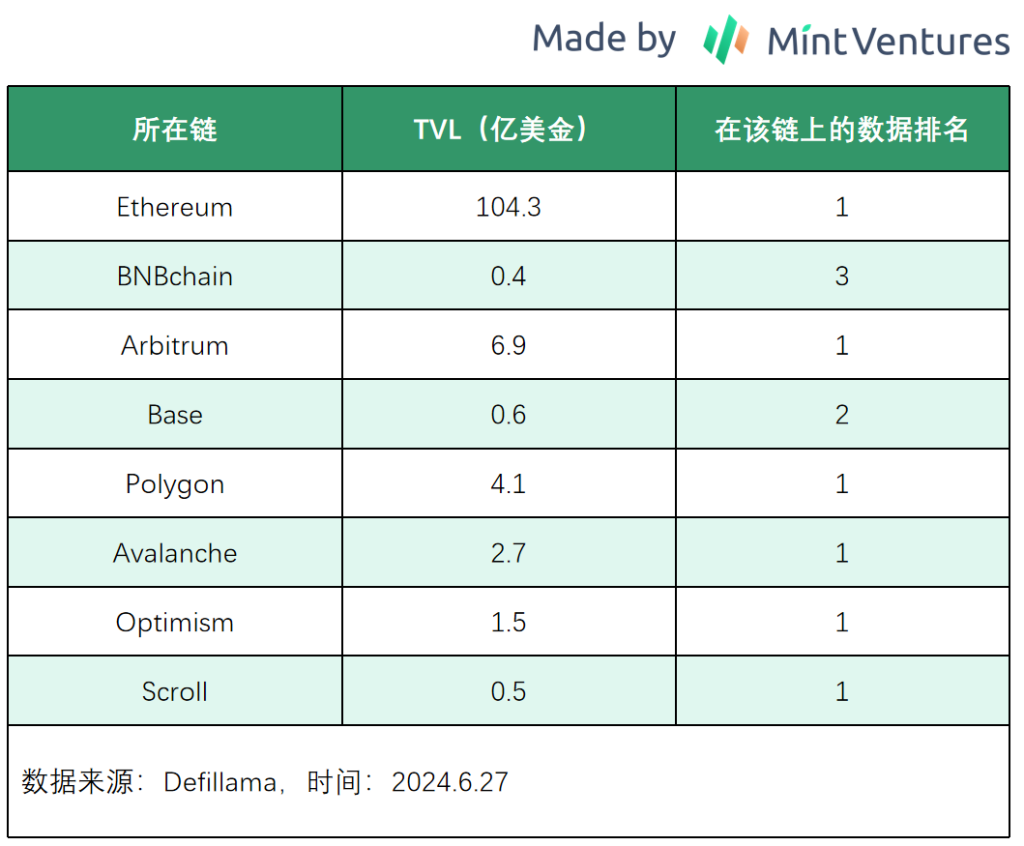
In addition to the EVM public chain, Aave is also evaluating Solana and Aptos, with the possibility of deploying them on the network in the future.
1.3 Valuation Level
According to Tokenterminal data, Aaves PS (ratio of circulating market value to protocol revenue) and PF (ratio of circulating market value to protocol fees) have both hit record lows, with PS at 17.44 times and PF at 3.1 times, due to the continued recovery of protocol fees and revenue, as well as the fact that the coin price is still hovering at a low level.
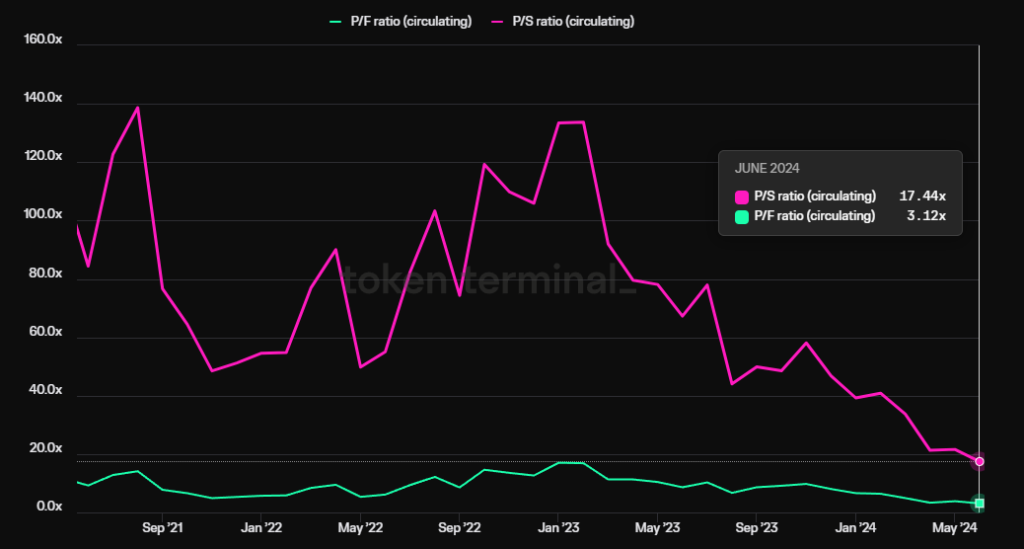
Data source: Tokenterminal
1.4 Risks and Challenges
While Aave continues to gain market share, a new competitor worth noting is Morpho Blue’s modular lending platform. Morpho Blue provides a modular protocol for third parties interested in building lending markets. You can freely choose different collateral, borrowing assets, oracles, and risk parameters to build a customized lending market.
This modular approach allows more market participants to enter the lending field and start providing lending services. For example, Gaunlet, Aaves former risk service provider, would rather terminate its service relationship with Aave and launch its own lending market on Morpho blue.

Image 来源 : https://app.morpho.org/?network=mainnet
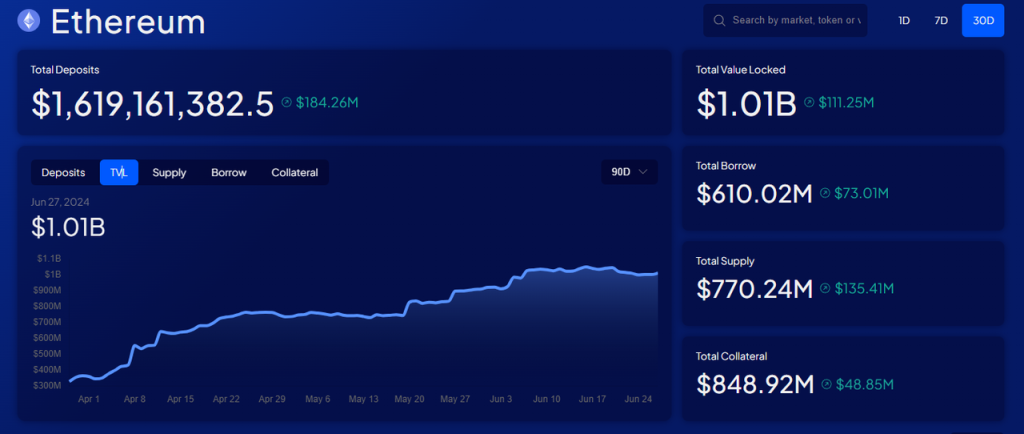
Data source: https://morpho.blockanalitica.com/
Morpho blue has grown rapidly since its launch more than half a year ago and has become the fourth largest lending platform in terms of TVL after Aave, Spark (the Aave v3 fork lending platform launched by MakerDAO) and Compound.
Its growth rate on Base is even faster. Less than two months after its launch, its TVL has reached 27 million US dollars, while Aaves TVL on Base is around 59 million.
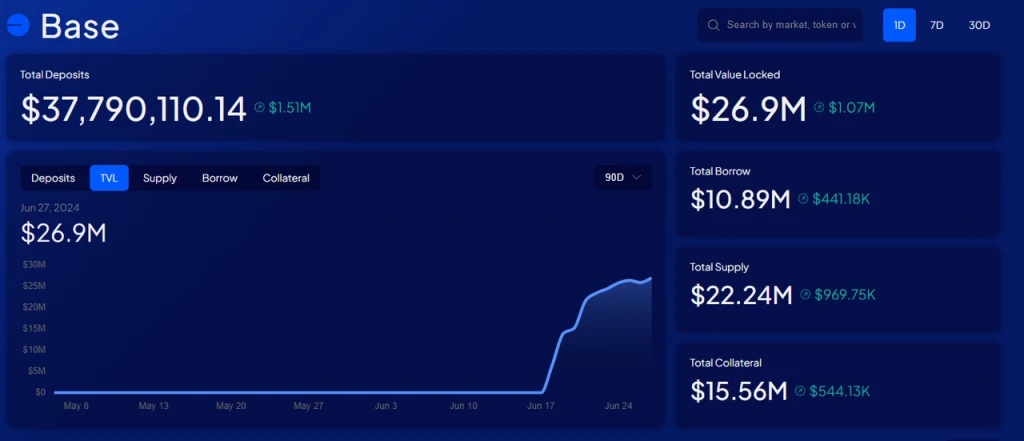
数据 来源 : https://morpho.blockanalitica.com/
2. Dexs: Uniswap Raydium
Uniswap and Raydium belong to the Evm ecosystem and Solana ecosystem of the Ethereum camp respectively. Uniswap launched the V1 version deployed on the Ethereum mainnet as early as 2018, but what really made Uniswap popular was the V2 version launched in May 2020. Raydium was launched on Solana in 2021.
The reason why we recommend two different targets in the Dexs track is that they belong to the two ecosystems with the largest number of Web3 users, namely the Evm ecosystem built around Ethereum, the king of public chains, and the Solana ecosystem with the fastest user growth. The two projects have their own advantages and problems. Next, we will interpret these two projects separately.
2.1 Uniswap
2.1.1 Business situation
Since the launch of V2, Uniswap has almost always been the Dex with the largest share of transaction volume on the Ethereum mainnet and most EVM chains. In terms of business, we mainly focus on two indicators, namely transaction volume and handling fees.
The following figure shows the share of Dex monthly trading volume since the launch of Uniswap V2 (excluding DEX trading volume of non-EVM chains):
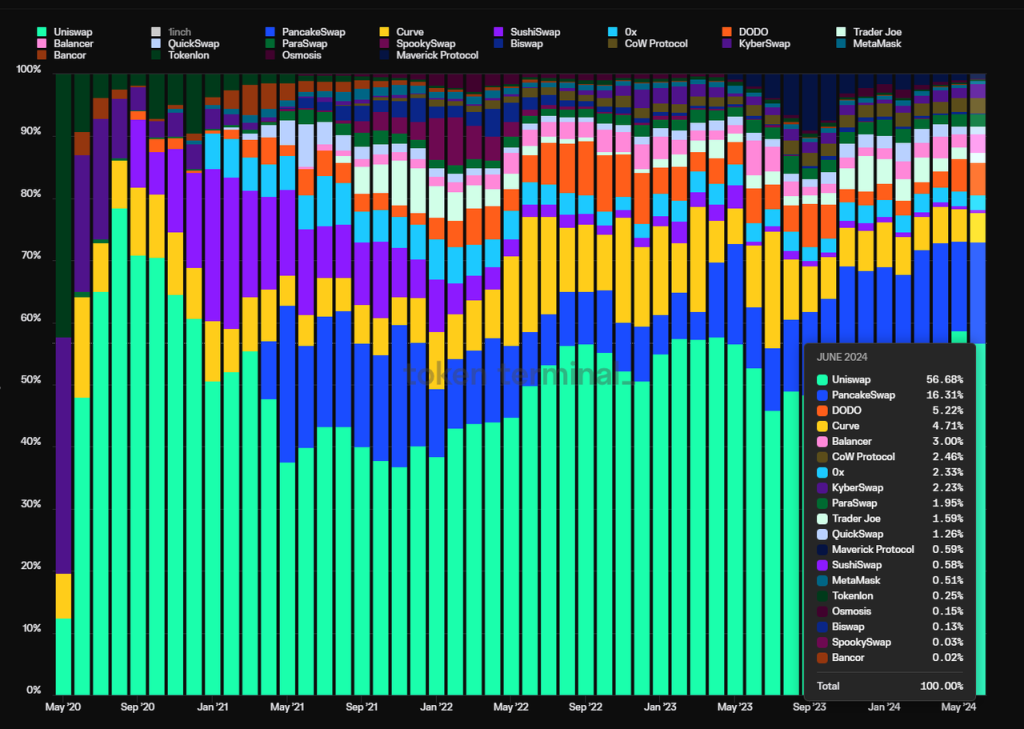
Data source: Tokenterminal
Since the launch of V2 in May 2020, Uniswaps market share has risen from a peak of 78.4% in August 2020 to a bottom of 36.8% at the peak of the Dexs war in November 2021, and has rebounded to the current 56.7%. It can be said that it has experienced the test of brutal competition and has established a firm foothold.
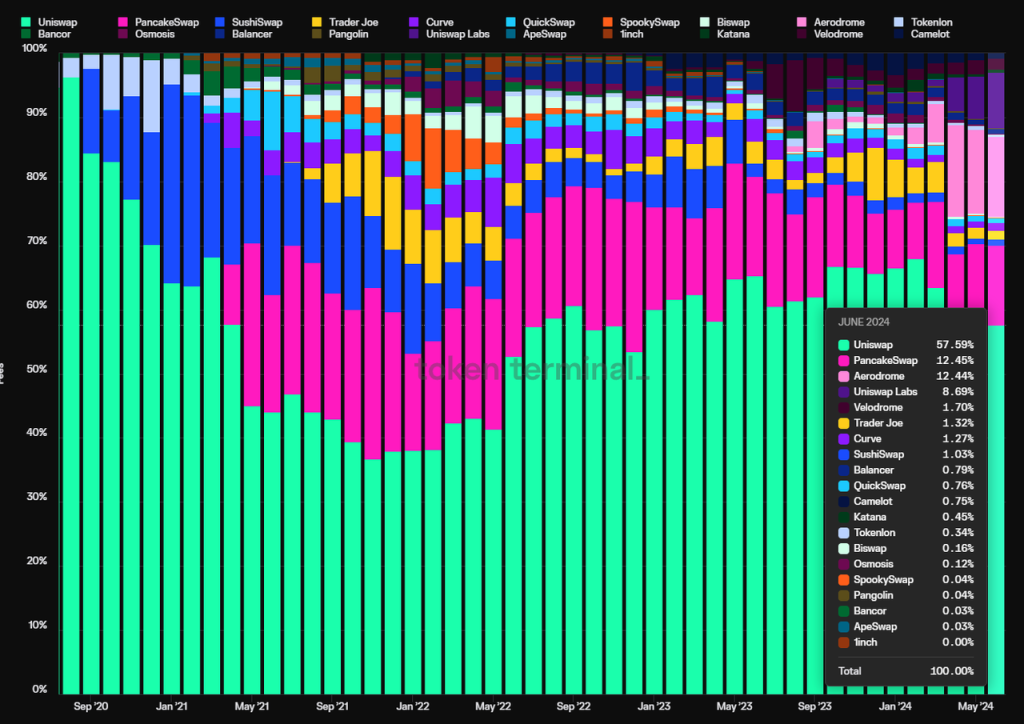
Data source: Tokenterminal
Uniswaps market share in transaction fees also shows this trend. Its market share bottomed out in November 2021 (36.7%), and then rebounded all the way to 57.6% at present.
What is even more commendable is that except for a few short months in 2020 (Ethereum mainnet) and late 2022 (OP mainnet), Uniswap has not incentivized liquidity at all other times, while most Dexs have not stopped subsidizing liquidity until now.
The figure below shows the proportion of the month-end incentive amounts of the major Dexs. It can be seen that Sushiswap, Curve, Pancakeswap, and the ve (3, 3) project Aerodrome currently on Base were once the projects with the largest subsidy amounts in the same period, but none of them have gained a higher market share than Uniswap.

Data source: Tokenterminal
However, the most criticized point about Uniswap is that although there is no token incentive expenditure, the token also has no value capture, and the protocol has not turned on the fee switch so far.
However, at the end of February 2024, Erin Koen, a Uniswap developer and head of foundation governance, published a proposal in the community to upgrade the Uniswap protocol so that its charging mechanism can reward UNI token holders who have authorized and custody their tokens. The proposal has sparked a lot of discussion at the community level. The formal vote was originally scheduled for May 31, but it is still delayed and has not yet been formally voted on. Despite this, the Uniswap protocol has taken the first step to start charging and empowering Uni tokens. The contracts to be upgraded have completed development and auditing. In the foreseeable future, Uniswap will have separate protocol revenue.
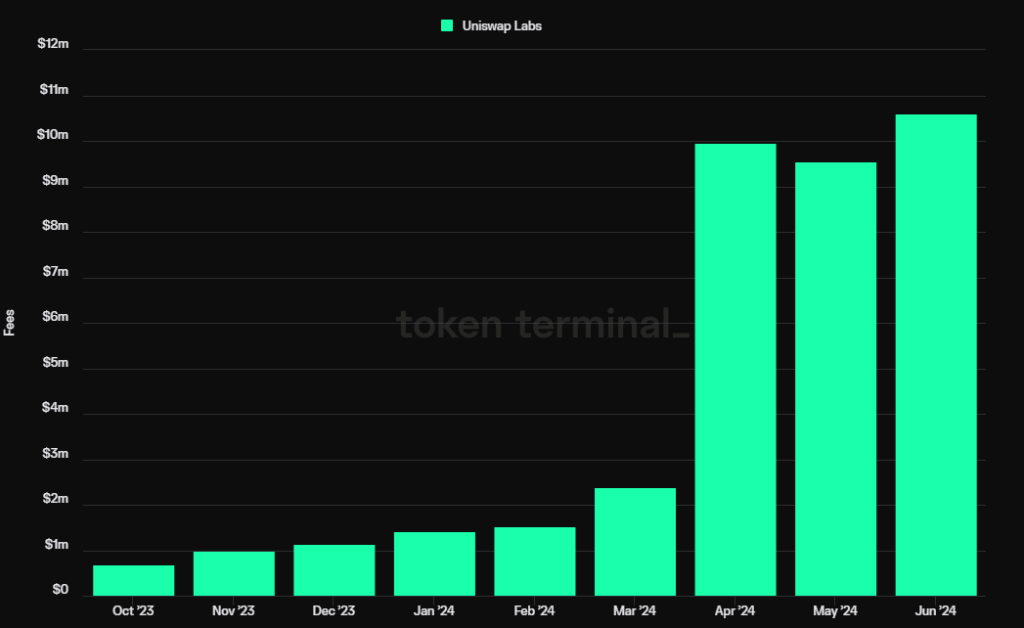
In addition, Uniswap labs actually started charging users who use the Uniswap official web front-end and Uniswap wallet to trade as early as October 2023. The rate is 0.15% of the transaction amount. The currencies involved in the charges are ETH, USDC, WETH, USDT, DAI, WBTC, agEUR, GUSD, LUSD, EUROC, XSGD, but there is no charge for stablecoin transactions and WETHETH swaps.
The fees charged by the Uniswap front-end alone have made Uniswap labs one of the highest-earning teams in the entire Web3 field.
It can be imagined that when the Uniswap protocol layer fees are enabled, based on the annualized fees in the first half of 2024, Uniswaps annualized fees will be approximately US$1.13 billion. Assuming the protocol fee rate is 10%, the annualized revenue of the protocol layer will be approximately US$110 million.
After Uniswap X and V4 are launched in the second half of this year, Uniswap is expected to further expand its market share in transaction volume and transaction fees.
2.1.2 Moat
Uniswaps moat mainly comes from the following three aspects:
1. User habits: When Uniswap started charging front-end fees last year, many people thought it was not a good idea, and soon users would switch their trading behavior from Uniswap’s front-end to trading aggregators such as 1inch to avoid paying additional transaction fees. However, since the front-end started charging, the revenue from the front-end has been rising, and its growth rate has even exceeded the growth rate of fees for the entire Uniswap protocol.
Data source: Tokenterminal
This data strongly demonstrates the power of Uniswaps user habits. A large number of users do not care about the 0.15% transaction fee and choose to maintain their trading habits.
2. Bilateral network effect: Uniswap, as a trading platform, is a typical bilateral market. One perspective of the bilateral understanding of its business model is that the two sides of this market are buyers (traders) and market makers (LPs). The more and more active the transactions are, the more LPs tend to provide liquidity there, reinforcing each other. Another bilateral perspective is: one side of the market is traders, and the other side is the project party that deploys the initial liquidity of tokens. In order to make their tokens easier for the public to find and trade, project parties tend to deploy initial liquidity in Dex, which has more users and is more familiar to the public, rather than choosing relatively unpopular second- and third-tier Dex. This behavior of the project party further strengthens the habitual behavior of users when trading – new tokens are traded on Uniswap first, which forms a mutual reinforcement of the bilateral market of project parties and trading users.
3. Multi-chain deployment: Similar to Aave, Uniswap is quite active in multi-chain expansion. Uniswap can be seen on all EVM chains with large trading volumes, and its trading volume is basically among the top few in the Dex ranking of the chain.
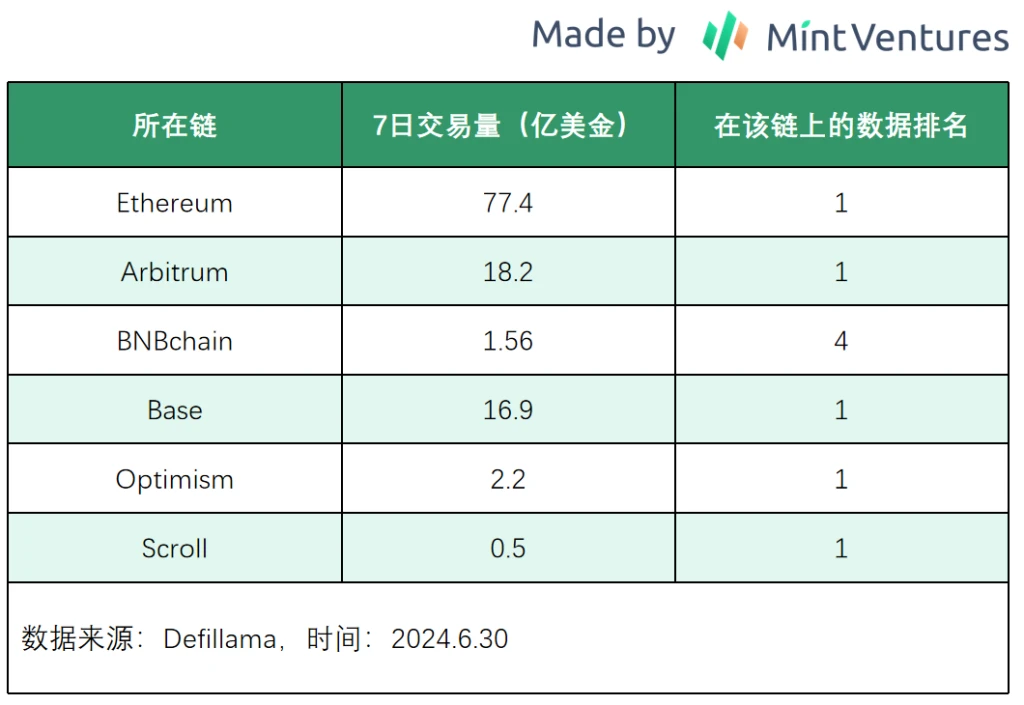
Subsequently, with the launch of Uniswap X to support multi-chain transactions, Uniswap’s comprehensive advantages in multi-chain liquidity will be further amplified.
2.1.3 Valuation
If we use the ratio of Uniswaps circulating market value to its annualized fee, namely PF, as the main valuation criterion, we will find that the current valuation of the UNI token is in a historically high percentile range. This may be because its upcoming fee switch upgrade has been reflected in the market value level in advance.
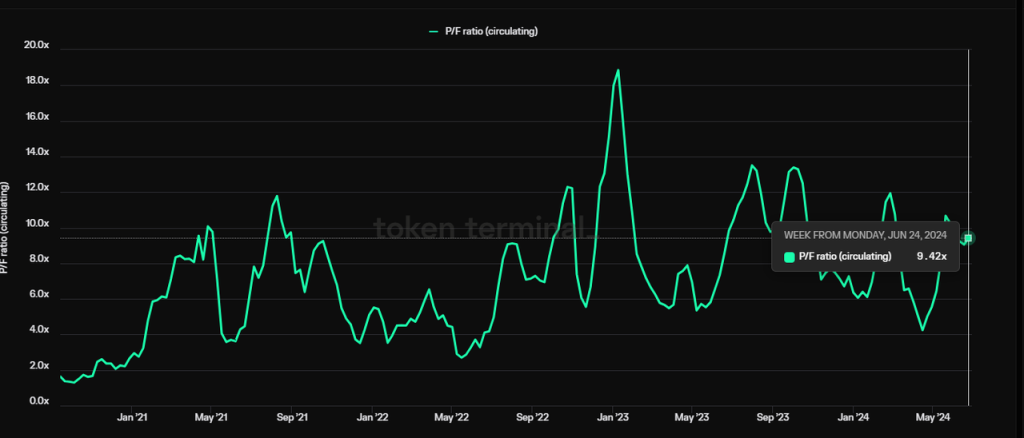
Data source: Tokenterminal
In terms of market capitalization, Uniswap’s current circulating market capitalization is nearly 6 billion, and its fully diluted market capitalization is as high as 9.3 billion, which is also not low.
2.1.4 Risks and Challenges
Policy risks: In April this year, Uniswap received a Wells Notice from the SEC, which means that the SEC will take enforcement action against Uniswap in the future. Of course, with the gradual advancement of the FIT 21 bill, DeFi projects such as Uniswap are expected to obtain a more transparent and predictable regulatory framework, but considering that the bill still takes a long time to be voted on and implemented, the lawsuit from the SEC will put pressure on the projects business and token prices in the medium term.
Ecological position: Dexs are the base layer of liquidity. Previously, their upstream was a trading aggregator. Trading aggregators such as 1inch, Cowswap, and Paraswap can provide users with price comparisons of full-chain liquidity and find the optimal trading path. This model has inhibited the downstream Dexs ability to charge and price user trading behaviors to a certain extent. With the development of the industry, wallets with built-in trading functions have become a more upstream infrastructure. In the future, with the introduction of the intent model, Dexs, as the source of underlying liquidity, will become a layer that users cannot perceive at all, which may further eliminate the users habit of using Uniswap directly and enter a complete price comparison mode. It is precisely because of this that Uniswap is working hard to move upstream in the ecology, such as vigorously promoting the Uniswap wallet and releasing Uniswap X to enter the aggregation layer of transactions to improve its ecological position.
2.2 Raydium
2.2.1 Business situation
We will also focus on analyzing Raydiums transaction volume and transaction fees. One thing that makes Raydium better than Uniswap is that it started charging protocol fees very early and has good protocol cash flow. Therefore, we also focus on Raydiums protocol revenue.
Let’s first look at Raydium’s trading volume. Thanks to the prosperity of the Solana ecosystem, its trading volume has taken off since October last year. Its trading volume in March once reached 47.5 billion US dollars, which is about 52.7% of Uniswap’s trading volume in that month.
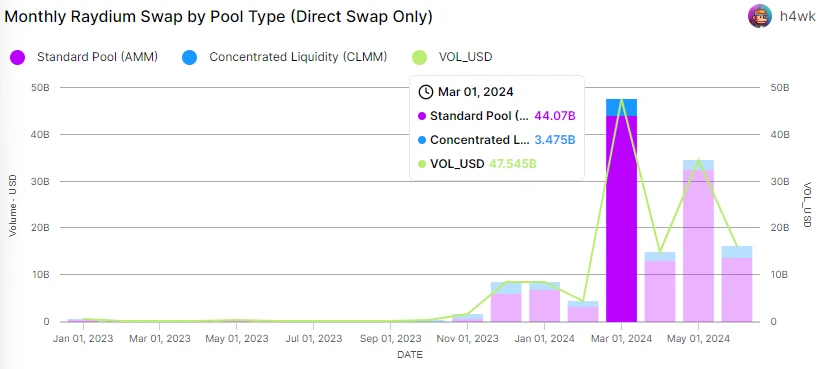
Data source: flipside
In terms of market share, Raydiums share of transaction volume on the Solana chain has been rising since September last year, and currently accounts for 62.8% of the Solana ecosystems transaction volume. Its dominance in the Solana ecosystem even exceeds Uniswaps position in the Ethereum ecosystem.
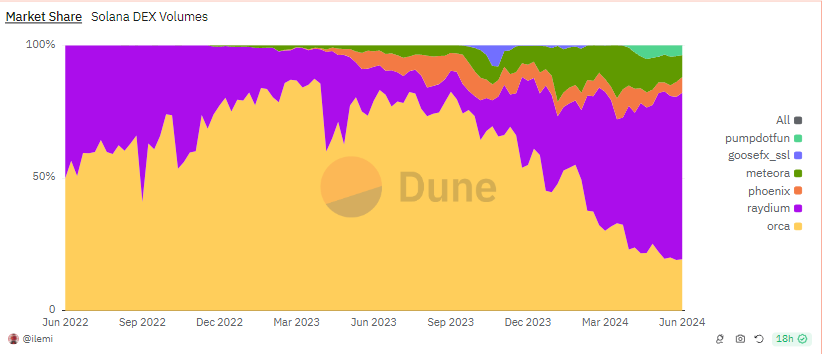
Data source: Dune
The reason why Raydiums market share has risen from less than 10% in the low tide to more than 60% at present is mainly due to the Meme trend that has continued to this day in this bull market cycle. Raydium uses two liquidity pools, which are divided into standard AMM and CPMM. The former is similar to Uni V2, with evenly distributed liquidity, suitable for highly volatile assets. The latter is similar to V3s centralized liquidity pool. Liquidity providers can customize the liquidity range, which is more flexible, but also more complicated.
Raydiums competitor Orca has chosen to fully embrace the centralized liquidity pool model of the Uni V3 type. For Meme project owners who need to mass-produce and mass-allocate liquidity every day, Raydiums standard AMM model is more suitable, so Raydium has become the preferred liquidity venue for Meme-type tokens.
Solana is the largest meme incubation base in this bull market. Since November this year, hundreds or even tens of thousands of new memes have been born every day. Meme is also the core driving factor for the prosperity of the Solana ecosystem in this round, and has become a fuel for the takeoff of Raydiums business.
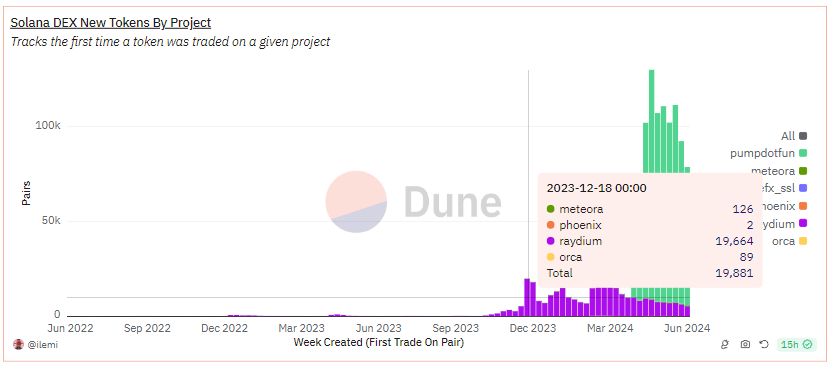
Data source: Dune
As can be seen from the above figure, in December 2023, the number of new tokens added by Raydium in a week was 19,664, while Orca only had 89 in the same period. Although in theory, Orcas centralized liquidity mechanism can also choose to fully configure liquidity to achieve similar effects as traditional AMM, this is still not as simple and direct as Raydiums standard pool.
In fact, Raydiums transaction volume data also proves this point. Its transaction amount from the standard pool accounts for 94.3%, and most of these transactions are contributed by Meme tokens.
In addition, as a bilateral market, Raydium, like Uniswap, serves both project owners and users. The more retail investors there are on Raydium, the more Meme projects tend to deploy initial liquidity on Raydium, which in turn allows users and tools that serve users (such as various TG bots) to choose Raydium for trading. This self-reinforcing cycle further widens the gap between Raydium and Orca.
In terms of transaction fees, Raydium generated approximately US$300 million in transaction fees in the first half of 2024, which is 9.3 times the transaction fees of Raydium for the whole year of 2023.
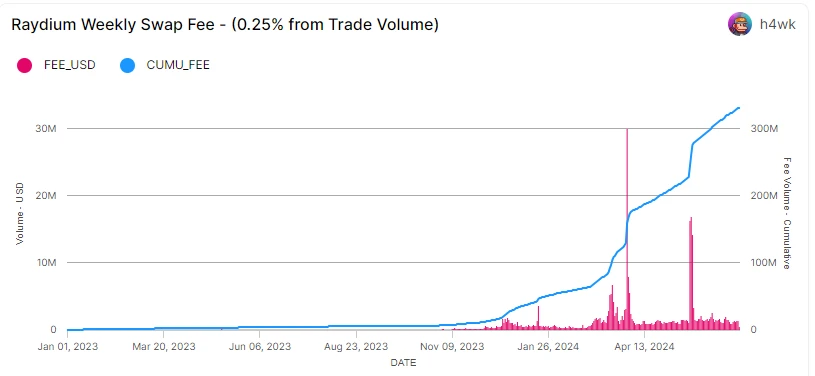
Data source: flipside
The standard AMM pool fee rate of Raydium is 0.25% of the transaction volume, of which 0.22% belongs to LP and 0.03% is used to repurchase the protocol token Ray. The CPMM rate can be freely set to 1%, 0.25%, 0.05% and 0.01%. LP will receive 84% of the transaction fee, and 12% of the remaining 16% will be used to repurchase Ray, and 4% will be deposited in the treasury.

Data source: flipside
Raydiums agreement revenue for repurchasing Ray in the first half of 2024 is approximately US$20.98 million, which is 10.5 times the amount of Rays agreement repurchase in the whole year of 2023.
In addition to the income from handling fees, Raydium also charges fees for newly created pools. Currently, the fee for creating an AMM standard pool is 0.4 Sol, and the fee for creating a CPMM pool is 0.15 Sol. Currently, the average pool creation fee received by Raydium every day is as high as 775 Sol (calculated at a price of 6.30 Sol, which is approximately US$108,000. However, this part of the fee is neither included in the treasury nor used for the repurchase of Ray, but is used for the development and maintenance of the protocol, which can be understood as team income.
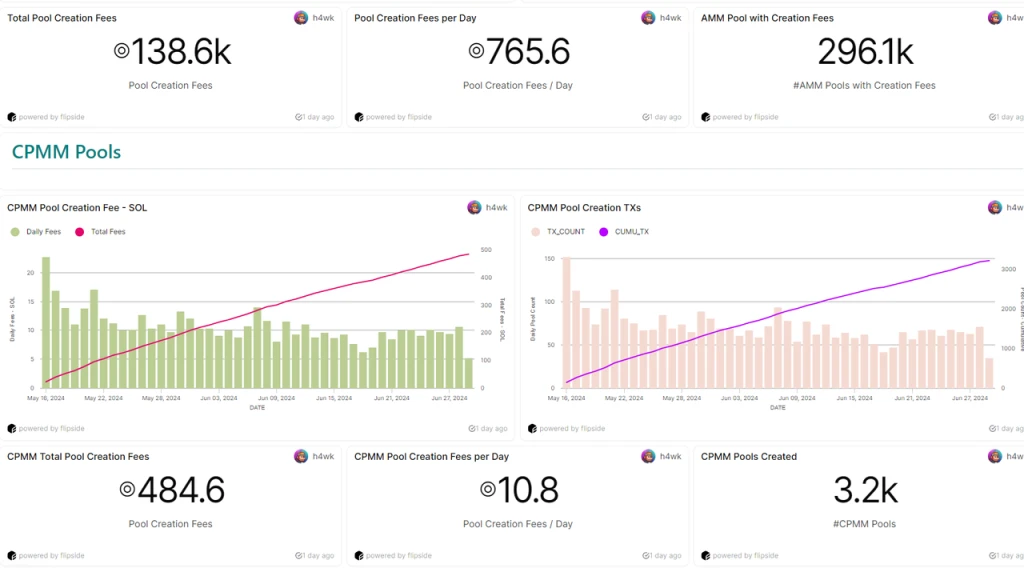
Data source: flipside
Like most Dex, Raydium still has incentives for Dex liquidity. Although the author has not found data that continuously tracks the amount of its incentives, we can roughly count the incentive value of the liquidity pool currently being incentivized from the official liquidity interface.
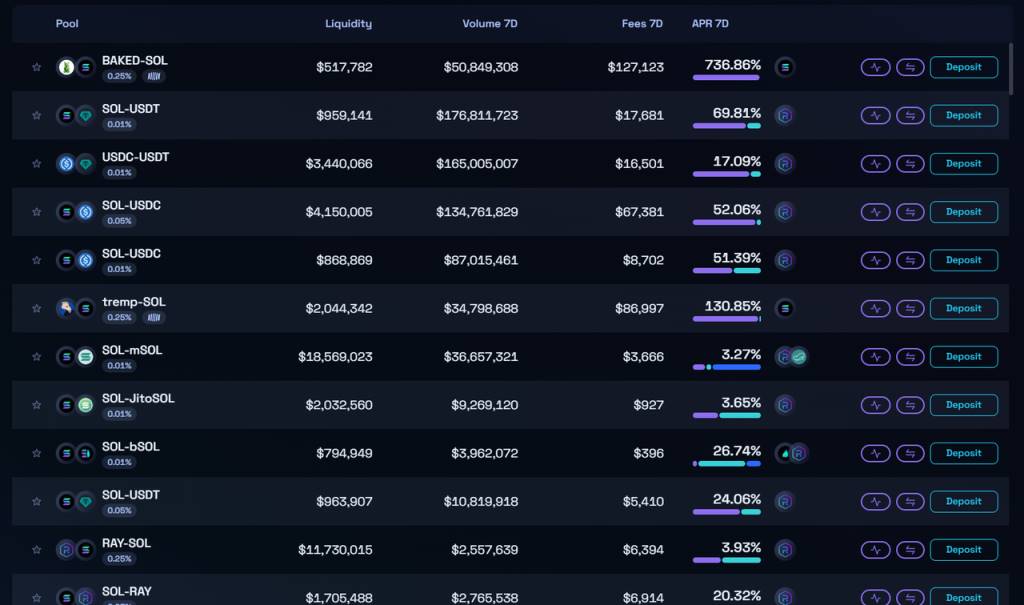
According to Raydiums current liquidity incentives, there are approximately $48,000 worth of incentive expenditures per week, mainly in Ray tokens. This amount is far less than the current protocols weekly revenue of nearly $800,000 (excluding revenue from pool creation), and the protocol is in a state of positive cash flow.
2.2.2 Moat
Raydium is the Dex with the largest market transaction volume on Solana. Compared with its competitors, its main advantages come from the current bilateral network effect, similar to Uniswap, which benefits from the mutual reinforcement of the business of traders and LPs, as well as the mutual reinforcement of the project parties and trading users. This network effect is particularly prominent in the Meme asset category.
2.2.3 Valuation
Due to the lack of historical data before 23 years ago, the author only compares Raydiums valuation data in the first half of this year with the valuation data in 2023.
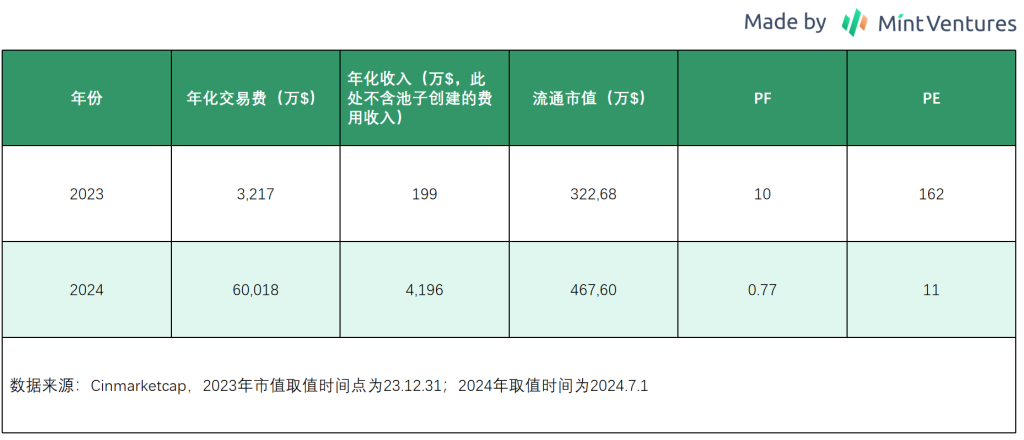
With the surge in trading volume this year, although Rays coin price has increased, its valuation is still significantly lower than last year, and its PF is also at a lower level compared to Dex such as Uniswap.
2.2.4 Risks and Challenges
Although Raydiums transaction volume and revenue have been strong in the past six months, there are still many uncertainties and challenges in its future development. Specifically:
Ecological position: Raydium, like Uniswap, faces the same ecological position problem. In the Solana ecosystem, aggregators represented by Jupiter have greater influence, and their trading volume far exceeds Raydium (Jupiters total trading volume in June was 28.2 billion, and Raydiums was 16.8 billion). In addition, Meme platforms represented by Pump.fun are gradually replacing Raydiums project launch scenarios, and more Memes are launched through Pump.fun rather than Raydium, although the two parties are currently in a cooperative relationship. The Pump.fun platform has gradually replaced Radyiums influence on the project side, and Jupiter has also surpassed Raydiums influence on traders on the user side. If this situation is not improved for a long time, if Pump.fun or Jupiter, which are located upstream of the ecosystem, build their own Dex, or turn to competitors, it will have a significant impact on Raydium.
Market trend changes: Before Solana started the meme whirlwind, Orcas market share was 7 times that of Raydium. Raydiums standard pool is more friendly to meme projects, which has helped Raydium regain its share. However, it is difficult to predict how long Solanas meme trend will last and whether the chain will still be dominated by local dogs in the future. When the types of market transactions change, Raydiums market share may face challenges again.
Token emission: Raydiums token circulation rate is currently 47.2%, which is not high compared to most DeFi projects. The selling pressure after the token is unlocked in the future may cause price pressure. However, considering that the project currently has a good cash flow, selling tokens is not the only option. The team may also destroy the unblocked tokens to dispel investors concerns.
High degree of centralization: Raydium has not yet started the governance process based on Ray tokens. The development of the project is completely controlled by the project party, which may lead to the inability to pass on profits that should belong to the coin holders. For example, how to distribute the Ray tokens repurchased by the agreement has not yet been resolved.
3. Staking: Lido
Lido is the leading liquidity staking protocol on the Ethereum network. The launch of the beacon chain at the end of 2020 marked the official start of Ethereums transition from PoW to PoS. Since the retrieval function of staked assets was not yet launched at the time, the staked ETH would lose liquidity. In fact, the Shapella upgrade that allows the retrieval of staked assets on the beacon chain occurred in April 2023, which means that the earliest users who entered ETH staking will not be able to obtain liquidity for two and a half years.
Lido pioneered the track of liquidity staking. Users who deposit ETH in Lido will receive stETH certificates issued by Lido. Lido has incentivized a large number of stETH-ETH LPs on Curve, thus providing users with a stable service of participating in ETH staking to earn income and being able to withdraw ETH at any time for the first time. It began to develop rapidly and has since gradually developed into a leader in the Ethereum staking track.
In terms of business model, Lido obtains 10% of its staking income, 5% of which is allocated to staking service providers and 5% is managed by the DAO.
3.1 Business Situation
Lidos main business is ETH liquidity staking services. Previously, Lido was the largest liquidity staking service provider for the Terra network and the second largest liquidity staking service provider for the Solana network. It also actively expanded its business in other chains such as Cosmos and Polygon. However, Lido wisely contracted its strategy and shifted its focus to staking services for the ETH network. Currently, Lido is the leader in the ETH staking market and the DeFi protocol with the highest TVL.
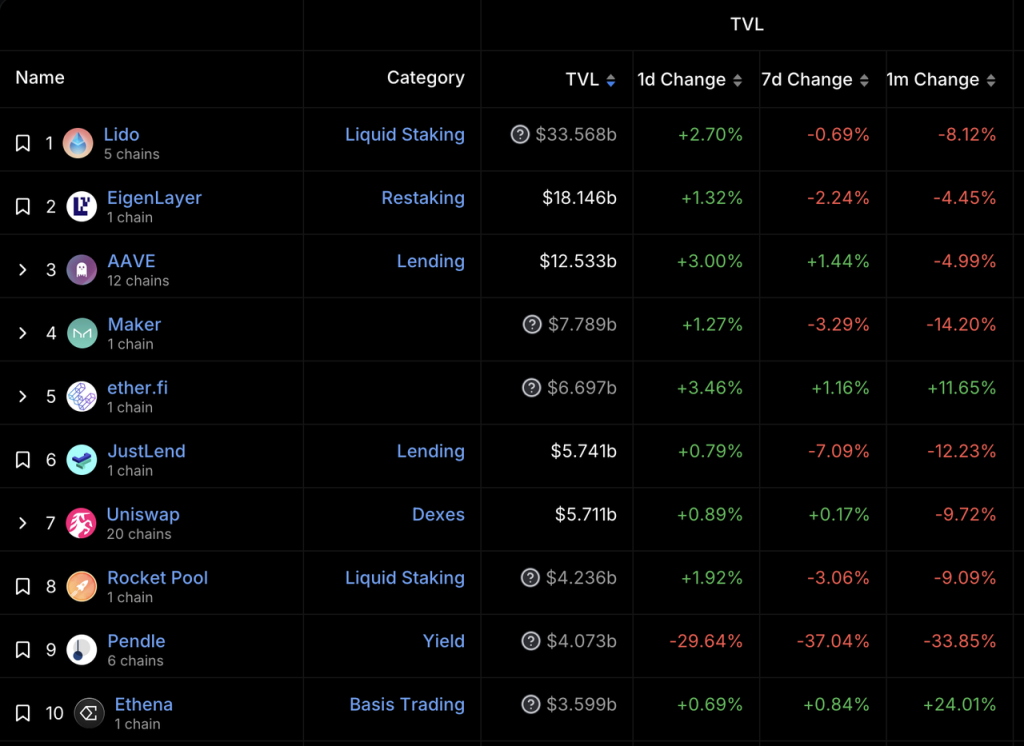
来源: DeFiLlama
With the deep stETH-ETH liquidity created by a large amount of $LDO incentives, and investment support from institutions such as Paradigm and Dragonfly in April 2021, Lido surpassed its main competitors at the time – centralized exchanges (Kraken and Coinbase) at the end of 2021, becoming the leader in the Ethereum staking track.

Lido spent a total of approximately $280 million in 2021-2022 to incentivize liquidity for stETH-ETH Source: 沙丘
However, there was a discussion about whether Lidos dominance would affect the decentralization of Ethereum. The Ethereum Foundation was also discussing whether it was necessary to limit the staking share of a single entity to no more than 33.3%. After Lidos market share hit a high of 32.6% in May 2022, it began to fluctuate between 28% and 32%.

ETH staking market share history (the light blue block at the bottom is Lido) Source: 沙丘
3.2 Moat
The moats of Lidos business are mainly the following two points:
-
The stable expectations brought by the long-term market leadership make Lido the first choice for whales and institutions to enter ETH staking. Justin Sun, Mantle before issuing its own LST, and many whales are all users of Lido.
-
The network effect brought by the wide use cases of stETH. stETH has been fully supported by the leading DeFi protocols as early as 2022, and the newly developed DeFi protocols will try every means to attract stETH (such as the LSTFi project that was once popular in 2023, as well as Pendle and various LRT projects). stETH has a relatively stable position as the basic income asset of the Ethereum network.
3.3 Valuation Level
Although Lidos market share has slightly declined, Lidos staking scale is still rising with the increase of ETHs own staking ratio. In terms of valuation indicators, Lidos PS and PF have both hit record lows recently.

来源: 令牌终端
With the successful launch of Shapella upgrade, Lidos market position has been consolidated, and the profit indicator reflecting the revenue-token incentive indicator has also performed well, with a cumulative profit of US$36.35 million in the past year.

来源: 令牌终端
This has also triggered the communitys expectations for adjustments to the $LDO economic model. However, Hasu, the actual helmsman of Lido, has 说 more than once that compared with Lidos current expenditures, the current income from the community treasury cannot sustain all the expenses of Lido DAO in the long term, and it is too early to distribute income.
3.4 Risks and Challenges
Lido faces the following risks and challenges:
-
Competition from newcomers. Since the launch of Eigenlayer, Lido’s market share has been declining. Any new project with sufficient token marketing budget will become a competitor to projects like Lido that have a leading advantage but whose tokens are close to full circulation.
-
The Ethereum community, including some members of the Ethereum Foundation, have long questioned the fact that Lido accounts for too high a share of the staking market. Vitalik has previously written an article to discuss this issue and sorted out various solutions, but he did not express a clear preference for any solution in the article (Mint Ventures 写道 an article specifically analyzing this issue in November last year, and interested readers can go and check it out).
-
在 its June 28, 2024 indictment against Consensys, the SEC explicitly defined LST as a security, and that users’ actions of minting and purchasing stETH were “Lido’s issuance and sale of securities not registered with the SEC.” Consensys was also suspected of “issuing and selling securities not registered with the SEC” because it provided users with the service of pledging ETH to Lido.
4. Perpetual Contract Exchange: GMX
GMX is a perpetual contract trading platform that was officially launched on Arbitrum in September 2021 and Avalanche in January 2022. Its business is a two-sided market: on one end are traders who can trade with up to 100 times leverage; on the other end are liquidity providers who sell the liquidity of their assets for traders to trade and act as counterparties to traders.
In terms of business model, GMXs revenue is made up of transaction fees ranging from 0.05% to 0.1% charged to traders, as well as funding fees and borrowing fees. GMX distributes 70% of all revenue to liquidity providers and the remaining 30% to GMX stakers.
4.1 Business Situation
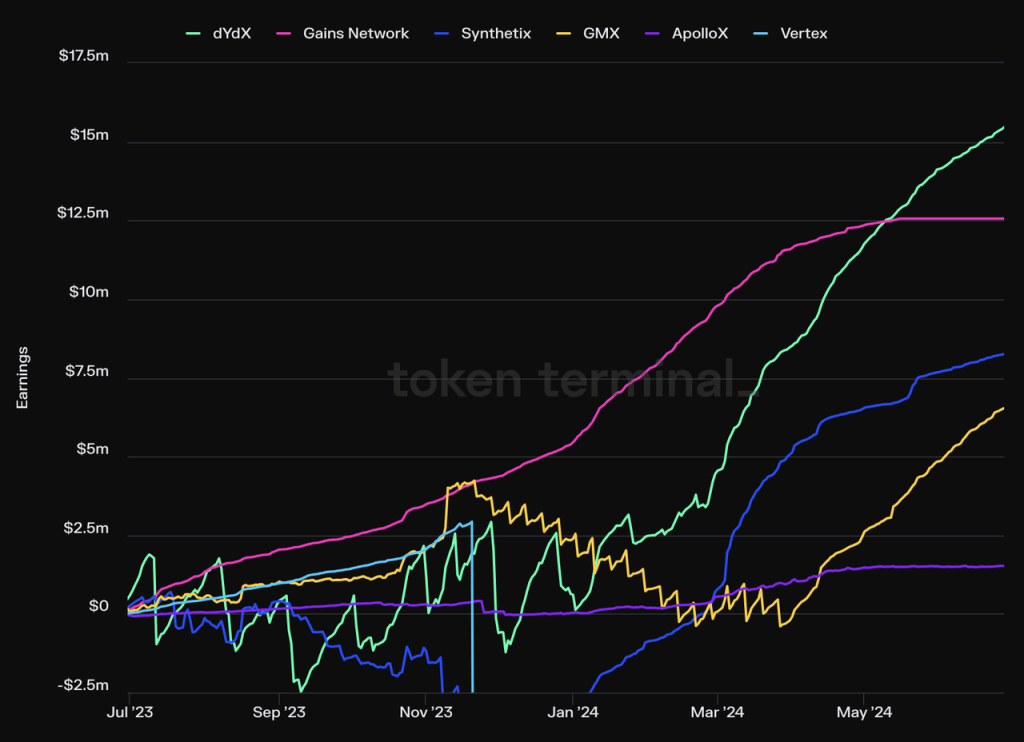
In the field of perpetual contract trading platforms, due to the frequent emergence of new projects that have openly stated that they have retroactive airdrops (such as Aevo, Hyperliquid, Synfutures, Drift, etc.), and the common existence of similar trading mining incentives in old projects (such as dYdX, Vertex, RabbitX), the trading volume data is not very representative. We will select TVL, PS and profit indicators to compare the data of GMX and its competitors horizontally.
In terms of TVL, GMX currently ranks first, but the TVL of the old derivatives protocol dYdX, Jupiter Perp which has a large amount of traffic entrance of Solana, and the yet-to-be-released Hyperliquid are also at the same level.
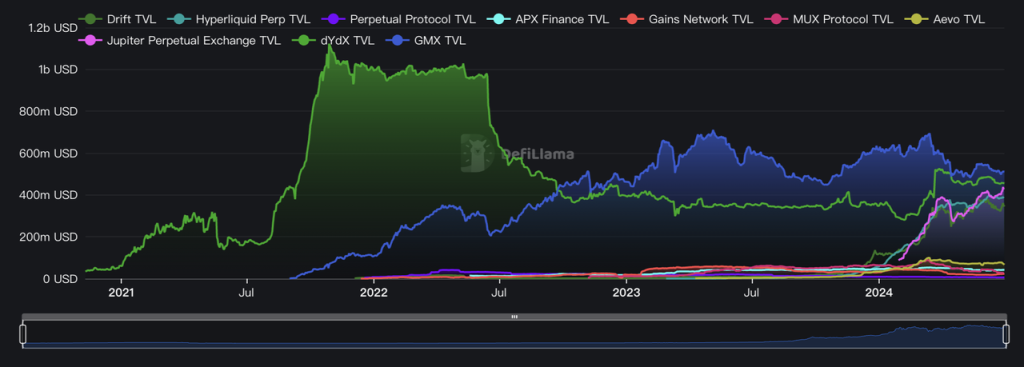
数据源: DeFiLlama
From the PS index, among the projects that have issued tokens, whose main business is perpetual contract trading, and whose average daily trading volume exceeds 30 million US dollars, GMXs PS index is relatively low, only higher than vertex, which still has a high trading mining incentive.

From the profit indicator, GMXs profit in the past year was $6.5 million, which is lower than DYDX, GNS and SNX. However, it is worth pointing out that this is largely due to the fact that GMX released all the 12 million ARBs (about $18 million on average according to the price of ARB during the period) obtained in Arbitrums STIP activities from November last year to March this year, resulting in a significant decrease in profits. We can see GMXs strong profit-making ability from the slope of profit accumulation.
4.2 Moat
Compared with other DeFi projects mentioned above, GMXs moat is relatively weak. The frequent emergence of new derivatives exchange projects in recent years has also greatly impacted GMXs trading volume. The track is still relatively crowded. GMXs main advantages include:
-
Arbitrum has given GMX strong support. As a native project of the Arbitrum network, GMX contributed nearly half of the TVL of the Arbitrum network at its peak. At that time, almost all new DeFi projects on Arbitrum were developed for GLP. In addition to being able to gain official exposure from Arbitrum, it also obtained a large number of ARB tokens (8 million in the initial airdrop and 12 million in STIP) in previous ARB incentive activities, which enriched the GMX treasury and increased the valuable marketing budget for the already fully circulated GMX.
-
The positive image brought by the long-term industry leading position. GMX led the narrative of real income DeFi from the second half of 2022 to the first half of 2023, which was a rare bright spot in the DeFi field during that period of bearish market. GMX took this opportunity to accumulate a good brand image and accumulated a lot of loyal users.
-
A certain degree of scale effect. Trading platforms such as GMX have scale effects, because only when the LP scale is large enough can it accommodate larger transaction orders and higher open contracts, and higher transaction volumes can in turn give LP higher returns. As the leading derivatives trading platform on the chain, GMX has become a beneficiary of this scale effect. For example, the famous trader Andrew Kang once opened long and short positions of up to tens of millions of dollars on GMX for a long time. At that time, GMX was almost his only choice to open such a large position order on the chain.
4.3 Valuation Level
GMX is now fully circulated. We have made a horizontal comparison with peers above, and GMX is currently the mainstream derivatives exchange with the lowest valuation.
Compared with historical data, GMXs revenue is relatively stable, and the PS indicator is historically at a medium to low level.

4.4 Risks and Challenges
-
Strong competitors. GMXs competitors include not only the old but still active DeFi protocols Synthetix and dYdX, but also various emerging protocols: AEVO, which exchanges tokens, and Hyperliquid, which has not issued tokens, have both achieved quite high trading volume and exposure in the past year, while Jupiter Perp, which has a large number of traffic entrances to Solana, has achieved a TVL close to GMX and a trading volume that exceeds GMX by using a mechanism that is almost exactly the same as GMX. GMX is also preparing to expand their V2 version to Solana, but the track is generally very competitive and does not have a relatively certain pattern like other DeFi tracks. The common transaction mining incentives in the industry reduce the switching cost of users, and user loyalty is generally low.
-
GMX uses oracle prices as the basis for transactions and liquidations, and there is a possibility of being attacked by the oracle. In September 2022, GMX lost $560,000 in the Avalanche network due to an oracle attack on AVAX . Of course, for most assets that GMX allows to trade, the cost of the attack (manipulating the price of the corresponding token on CEX) is much greater than its benefits. The V2 version of GMX has also targeted isolation pools and transaction slippage to deal with this risk.
5. Other Defi projects worth paying attention to
In addition to the Defi projects mentioned above, we also investigated other interesting Defi projects, such as the old stablecoin project MakerDAO, the emerging star Ethena, the oracle leader Chainlink, etc. However, due to space limitations, we cannot present all of them in this article. On the other hand, these projects also face many problems, such as:
Although MakerDAO is still the leader of decentralized stablecoins and has a large number of natural holders who hold DAI just like they hold USDC and USDT, the scale of its stablecoins has always stagnated, and its market value is only about half of the previous peak. Its collateral is largely based on off-chain US dollar assets, which is also gradually damaging the decentralized credit of its tokens.
In sharp contrast to MakerDAOs DAI, Ethenas stablecoin USDe has grown rapidly, from 0 to 3.6 billion US dollars in about half a year. However, Ethenas business model (a public fund focusing on perpetual contract arbitrage) still has an obvious ceiling. The large-scale expansion of its stablecoin is based on the premise that secondary market users are willing to take over its token ENA at a high price and provide high income subsidies for USDe. This slightly Ponzi-like design can easily usher in a negative spiral of business and currency prices when market sentiment is not good. The key point of Ethenas business turning point is that USDe will one day truly become a decentralized stablecoin with a large number of natural coin holders. So far, its business model has also completed the transformation from a public arbitrage fund to a stablecoin operator. However, considering that most of USDes underlying assets are arbitrage positions stored in centralized exchanges, USDe is not on both ends of decentralized anti-censorship and strong credit institution endorsement, and it is difficult for it to replace DAI and USDT.
After the Defi era, Chainlink is preparing to usher in a wave of hidden and yet-to-be-launched narratives, namely the RWA narrative promoted by financial giants represented by BlackRock, which have gradually actively embraced Web3 in recent years. In addition to promoting the listing of BTC and ETH ETFs, BlackRocks most noteworthy move this year is the issuance of a US Treasury bond fund with the code Build on Ethereum, and its fund size exceeded US$380 million in 6 weeks. Subsequent experiments by traditional financial giants on the chain will continue, and they will inevitably face the problems of tokenization of off-chain assets, as well as on-chain and off-chain communication and interoperability. Chainlink has been quite advanced in this regard. For example, in May this year, Chainlink completed the Smart Net Asset Value (Smart NAV) pilot project with the Depository Trust and Clearing Corporation (DTCC) and several major financial institutions in the United States. The project aims to establish a standardized process to aggregate and disseminate fund net asset value (NAV) data on private or public blockchains using Chainlinks interoperability protocol CCIP. In addition, in February this year, asset management companies Ark Invest and 21 Shares announced that they would verify holdings data by integrating Chainlinks reserve proof platform. However, Chainlink still faces the problem of business value being separated from tokens. The Link token lacks value capture and rigid application scenarios, which makes people worry that it will be difficult for holders to benefit from the business growth of its parent company.
总结
Just like the development process of many revolutionary products, Defi also experienced the narrative fermentation in 2020, the rapid bubble of asset prices in 2021, and the disillusionment stage after the bear market bubble burst in 2022. Now, with the full verification of the product PMF, it is coming out of the trough of narrative disillusionment and building its intrinsic value with actual business data.

The author believes that as one of the few tracks in the encryption field with a mature business model and a still growing market space, Defi still has long-term attention and investment value.
This article is sourced from the internet: It’s time to refocus on DeFi after the continuous decline
In the past 24 hours, many new hot currencies and topics have appeared in the market, and it is very likely that they will be the next opportunity to make money. The following sectors need to be paid attention to: Meme sector, fan token sector Hot search tokens and topics by users: Scroll, Manta Network, BONK Potential airdrop opportunities include: Scroll, Orbiter Finance Data statistics time: May 20, 2024 4: 00 (UTC + 0) 1. Market environment Last week, BTC spot ETF had a net inflow for 5 consecutive days. The inflow of funds in the past two weeks has offset all the outflows in April. BTC rose 9% in a week, and the price fluctuated around 67,000. CME Federal Reserve observation data shows that the probability of the Federal…


