My XP
0
Login
HBAR noted a 20% rally during Wednesday’s intraday trading session. This double-digit gain was fueled by Nasdaq’s filing of a 19b-4 form with the US Securities and 交換 Commission (SEC) to list and trade Grayscale’s spot HBAR exchange-traded fund (ETF).
However, the rally appears to be losing momentum. 市場 indicators suggest that bearish sentiment is strengthening, putting HBAR at risk of losing recent gains.
HBAR’s negative Balance of Power (BoP) reading indicates weakening buying pressure among its spot market participants. At press time, this indicator, which compares the strength of an asset’s bulls and bears, is below zero at -0.09.

When an asset’s BoP is negative, its sellers exert more control over price action. This suggests weakening buying pressure in the HBAR market and hints at a potential continuation of the bearish momentum.
Moreover, HBAR’s Long/Short ratio indicates an increasing dominance of short positions, confirming the bearish sentiment among its futures traders. As of this writing, this stands at 0.98.
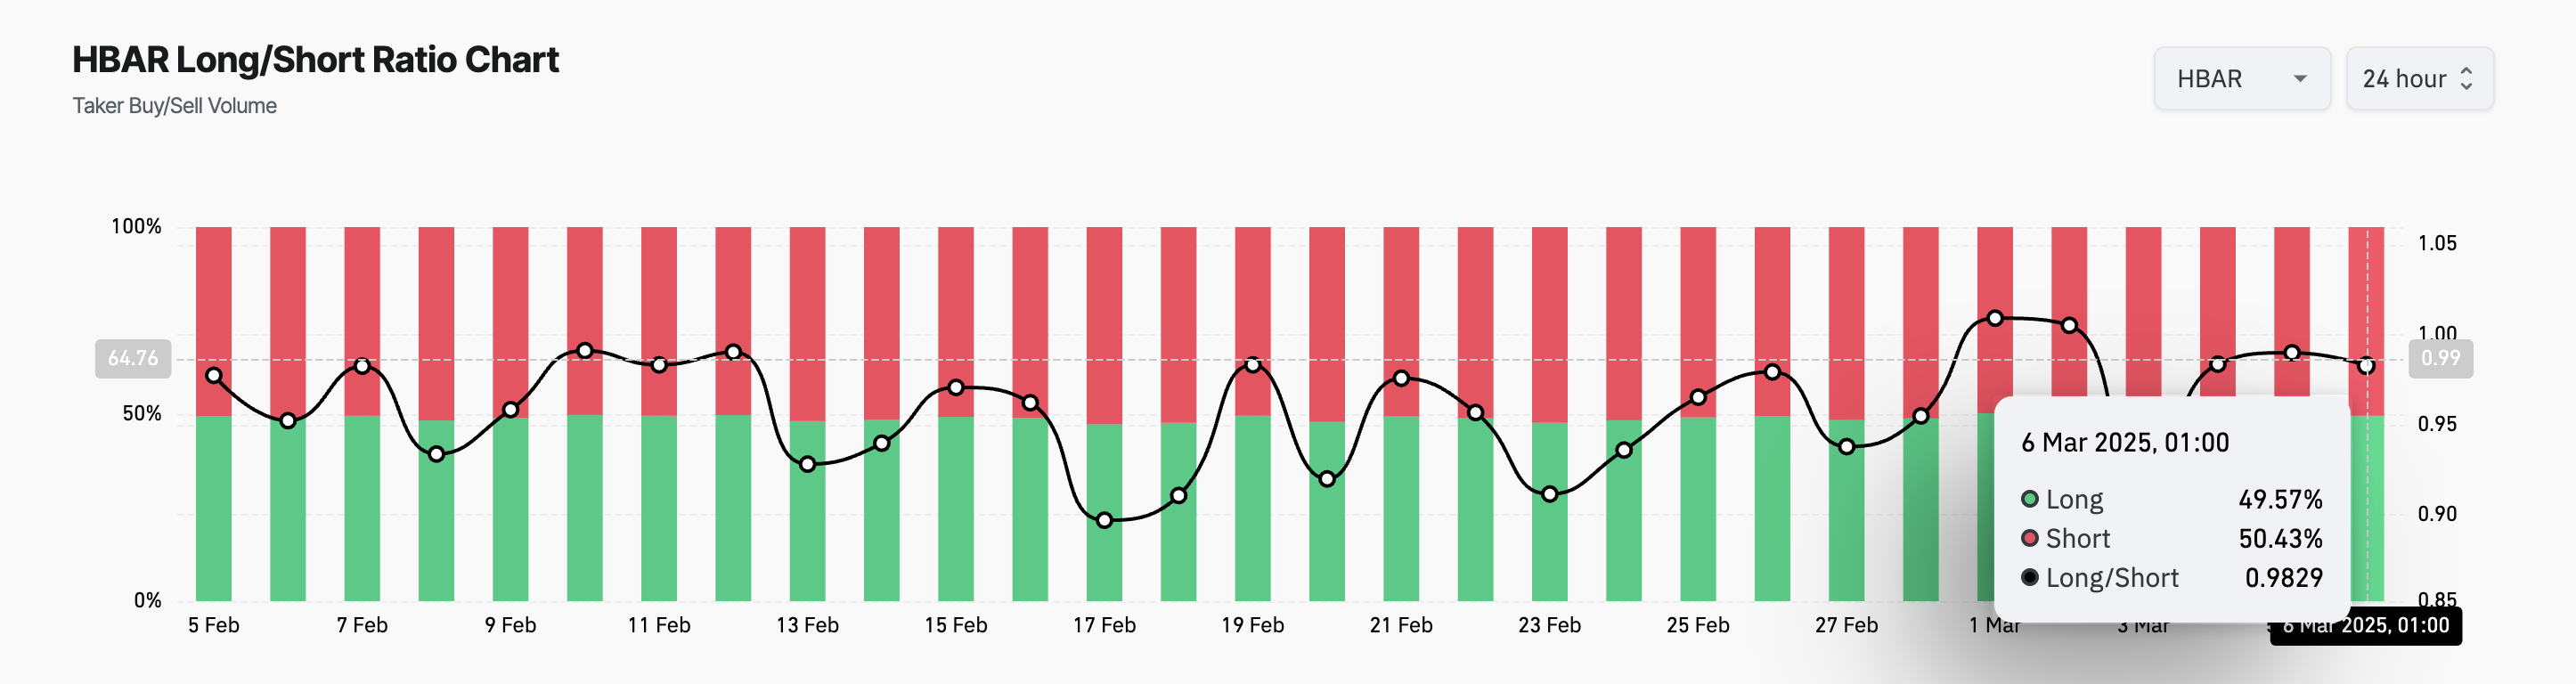
The Long/Short ratio measures the proportion of long positions (bets on price increases) to short positions (bets on price declines) in the market. When the ratio is below 1, it indicates that short positions outnumber long positions. It highlights the bearish sentiment among HBAR holders and increases the downward pressure on its price.
HBAR exchanges hands at $0.24 at press time. On the daily chart, it trades above support formed at $0.22. If bearish pressure gains momentum, this level may fail to hold. HBAR’s price could decline further to $0.17 if the bulls cannot defend this support level.
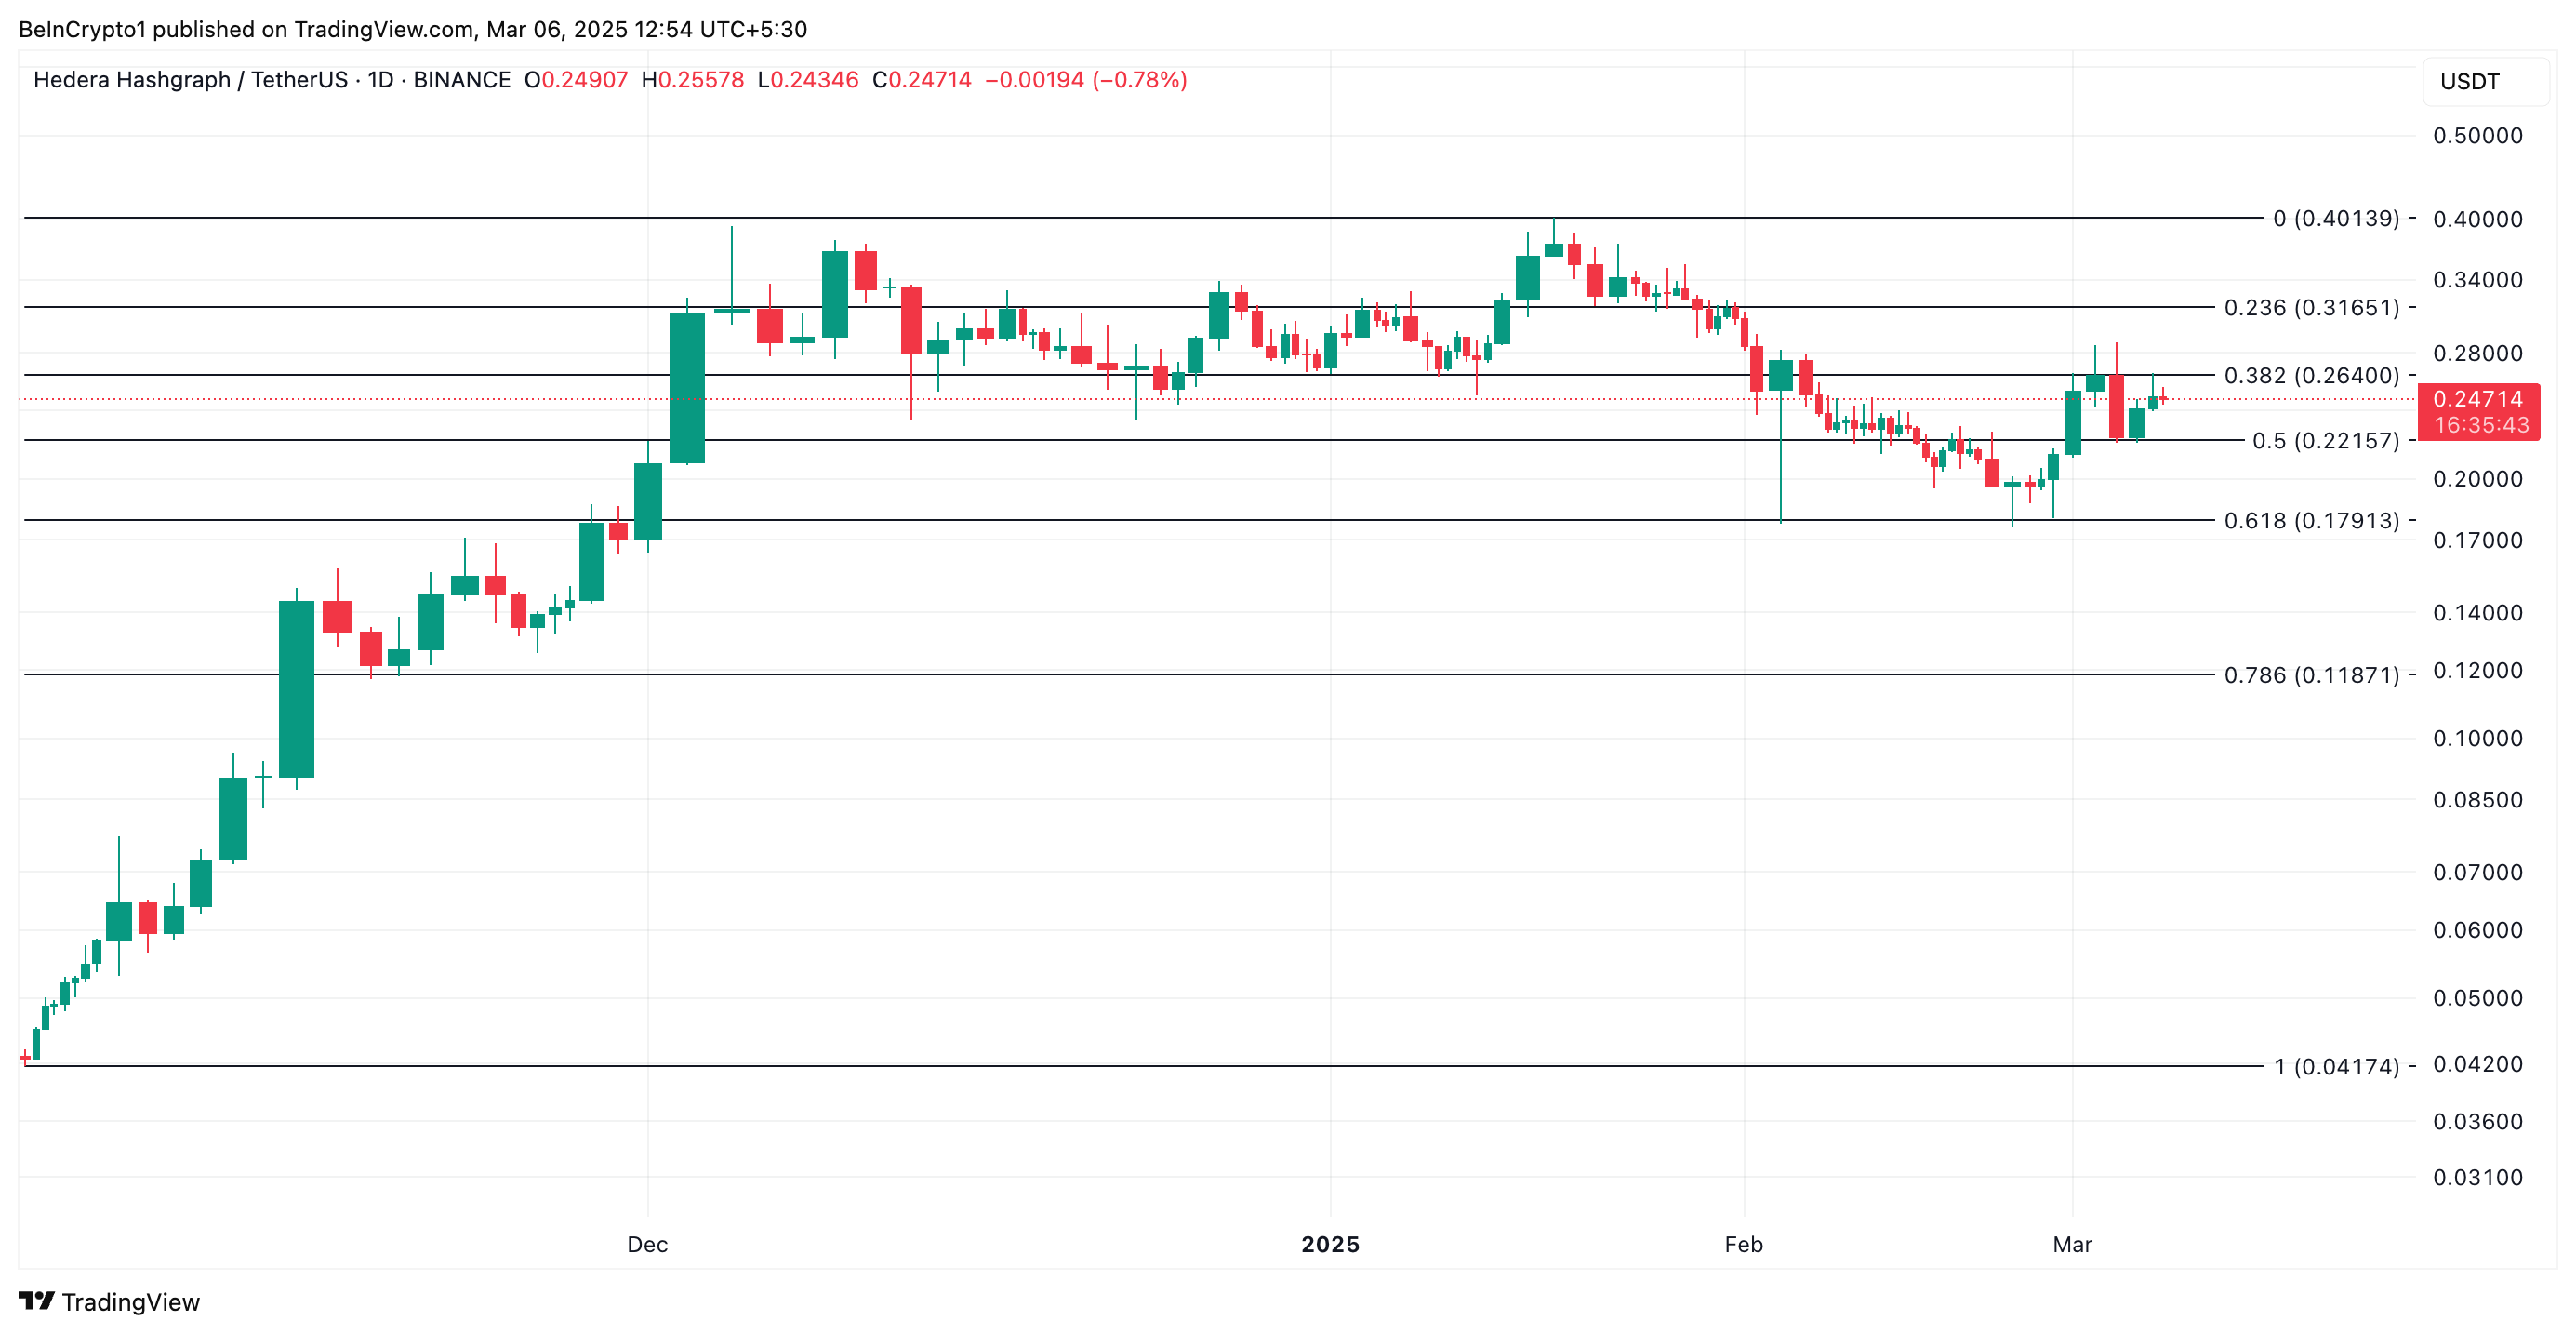
Conversely, a positive shift in market sentiment could prevent this. If new demand trickles into the market, HBAR’s price could breach resistance at $0.26 and rally toward $0.31.
本文源自網路: HBAR Jumps 20% on Nasdaq’s ETF Filing, Yet Key Indicators Suggest Caution
Related: Trading Outpost: How Centralized Exchanges Can Influence the Pre-Market
If I could have established a position before ME was released… Such exclamations can be seen everywhere in the 加密貨幣 market. When a high-quality project is officially released, the best time to enter the market has often been missed. Nowadays, PVP can be seen everywhere in the crypto market, and early layout often means greater profit space. Data shows that star projects such as ME and HYPE have already shown amazing growth potential in the pre-market, bringing considerable returns to early participants. This strong demand for early layout of high-quality projects has given rise to the innovative market form of pre-market trading. By deeply analyzing the underlying logic behind the rise of pre-market trading, we can find three key driving factors: first, early investors and project parties need a liquidity…


