1. The easing cycle started again after four years
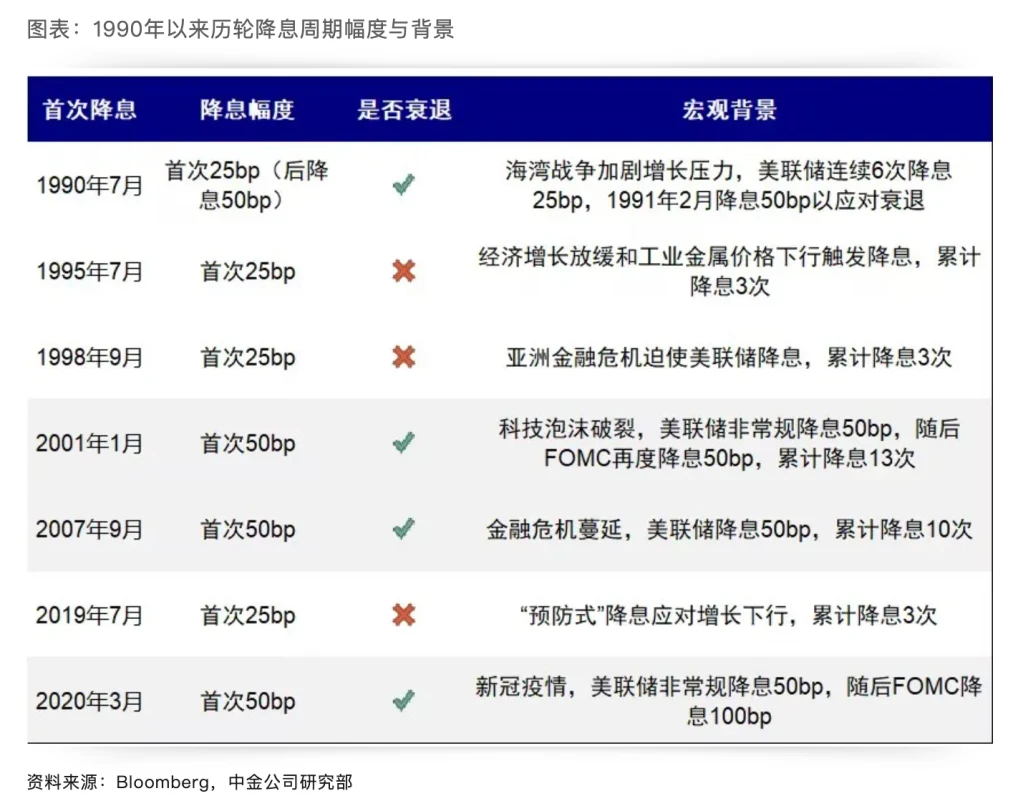
At 2:00 am on September 19th, Beijing time, the Federal Reserve announced a 50 basis point interest rate cut, and the target range of the federal funds rate was reduced from 5.25%-5.50% to 4.75%-5.0%, and a new round of interest rate cuts officially began. The 50 bp interest rate cut was in line with the expectations of CME interest rate futures, but exceeded the forecasts of many Wall Street investment banks. Historically, the first 50 bp interest rate cut has only occurred in economic or market emergencies, such as the technology bubble in January 2001, the financial crisis in September 2007, and the COVID-19 pandemic in March 2020. Since a 50 bp interest rate cut will make the market more worried about the economic recession, Powell emphasized in his speech that he did not see any signs of recession, and as always, he used this method to hedge the markets recession concerns.
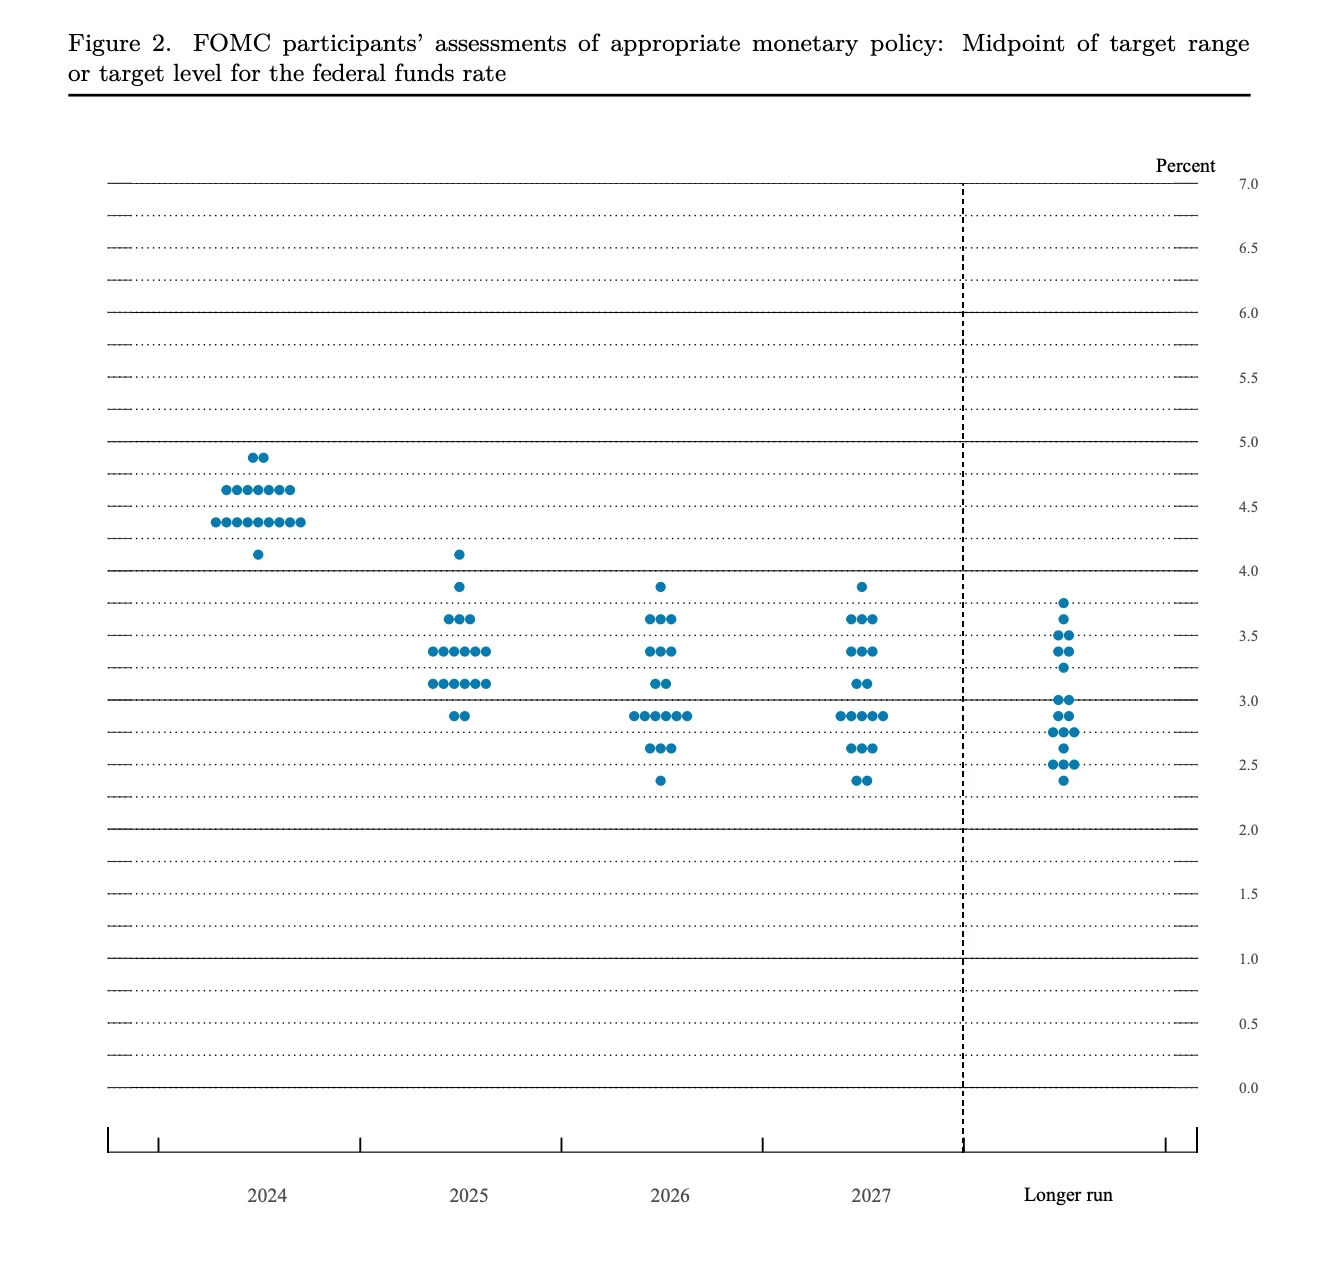
The Fed also gave a more hawkish dot plot, predicting two more rate cuts totaling 50 bp this year, four rate cuts totaling 100 bp in 2025, and two rate cuts totaling 50 bp in 2026, with an overall rate cut of 250 bp and an end point of 2.75-3%. The rate cuts given by the dot plot are relatively slow, and the path is slower than the 2.75-3% level reached in September 2025 in CME interest rate futures trading. At the same time, Powell emphasized that this round of 50 bp rate cuts cannot be used as a new benchmark and linearly extrapolated. There is no fixed interest rate path set. It can be accelerated, slowed down, or even suspended, depending on the situation of each meeting, which to some extent explains the surge in US Treasury bond interest rates after the close.
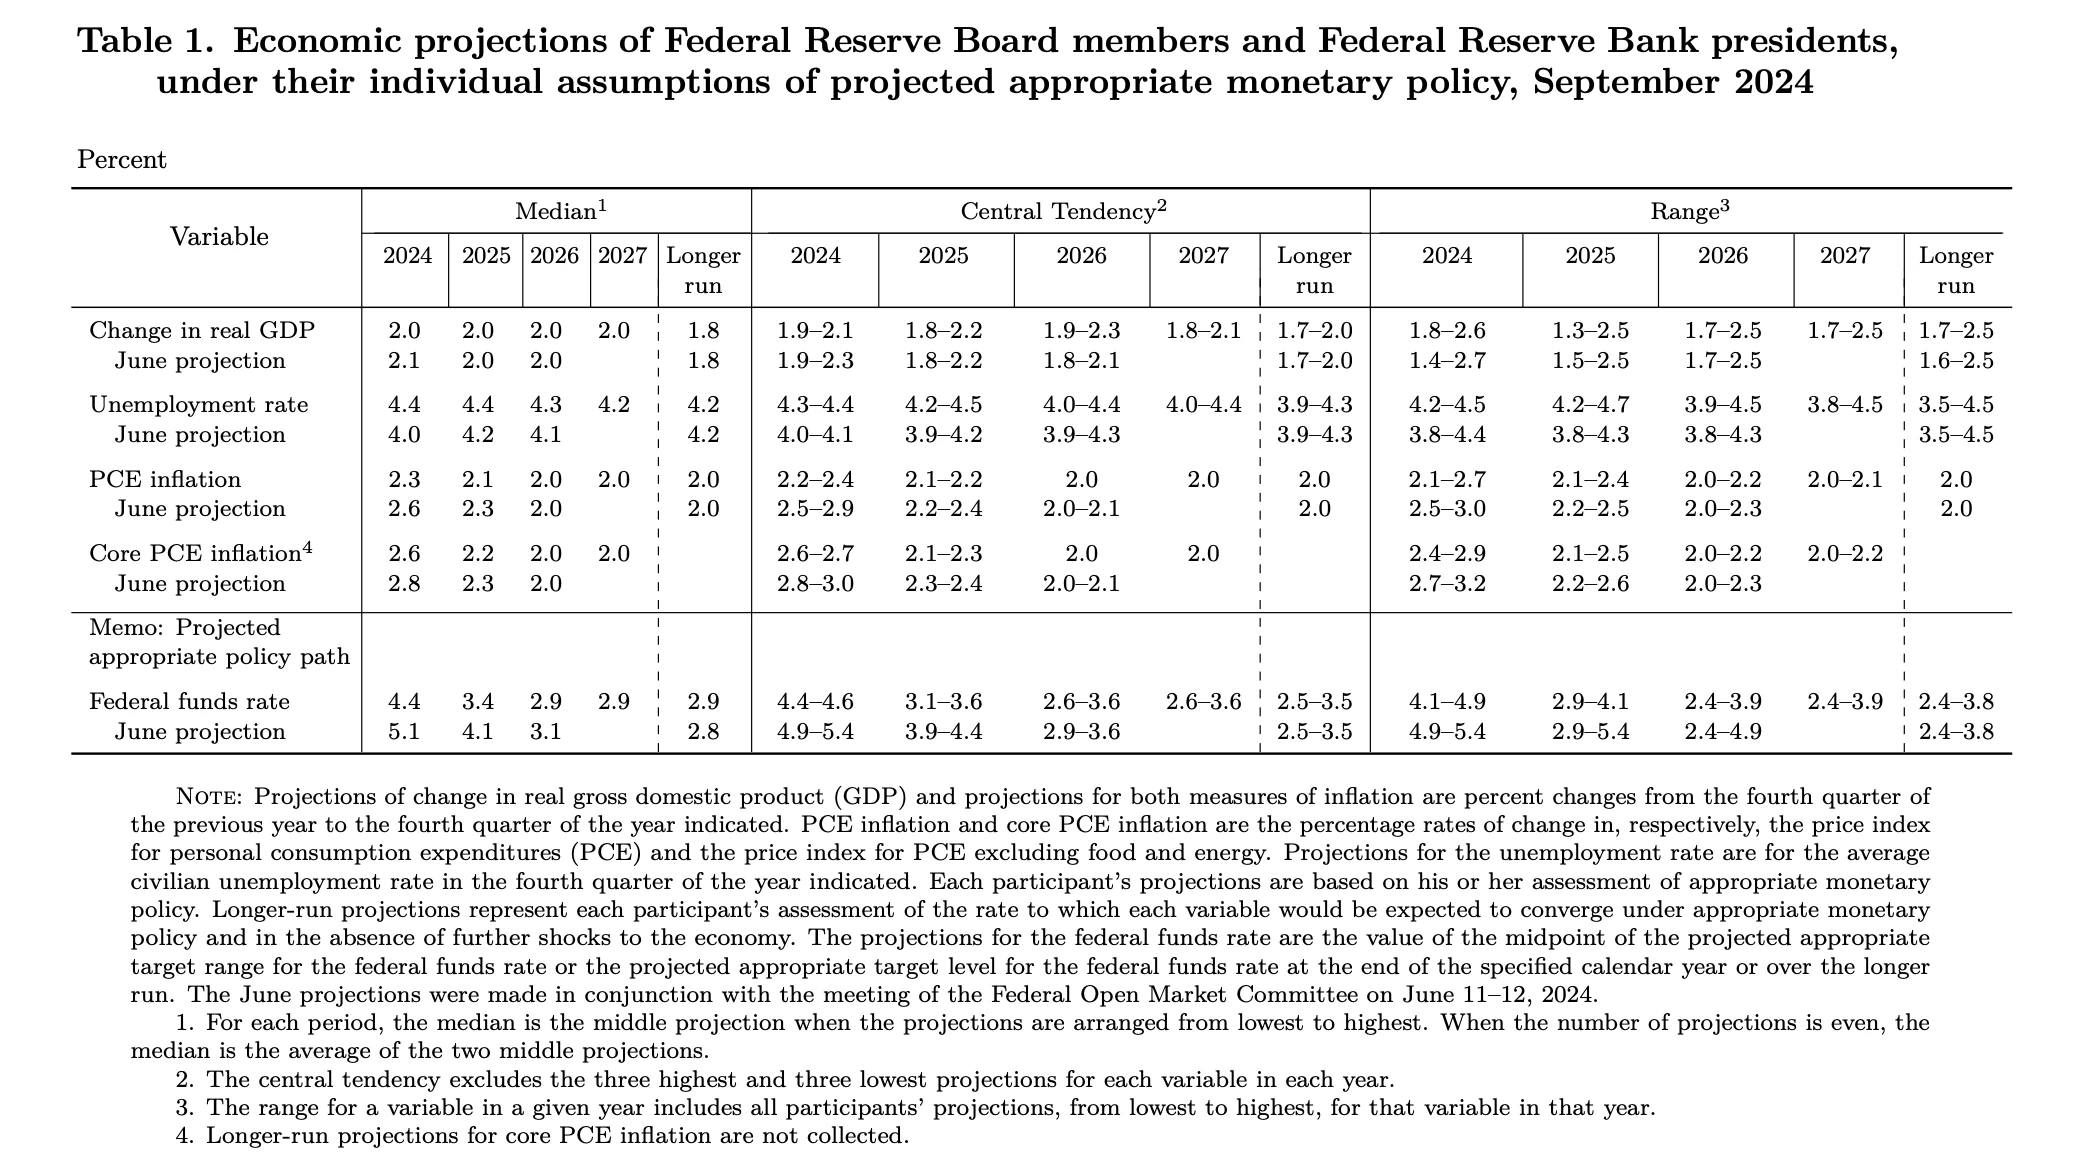
In terms of economic forecasts, the Fed lowered its GDP growth forecast for this year from 2.1% to 2.0%, and significantly raised its unemployment forecast from 4.0% to 4.4%. It also lowered its PCE inflation forecast from 2.6 to 2.3%. The Feds data and statements show that it has increased its confidence in curbing inflation, while paying more attention to employment. Overall, the Fed has played a big role in expectation management with a relatively large first interest rate cut and a relatively hawkish pace of interest rate cuts.
II. Interest rate cut cycles since the 1990s
June 1989 to September 1992 (recessionary rate cuts)
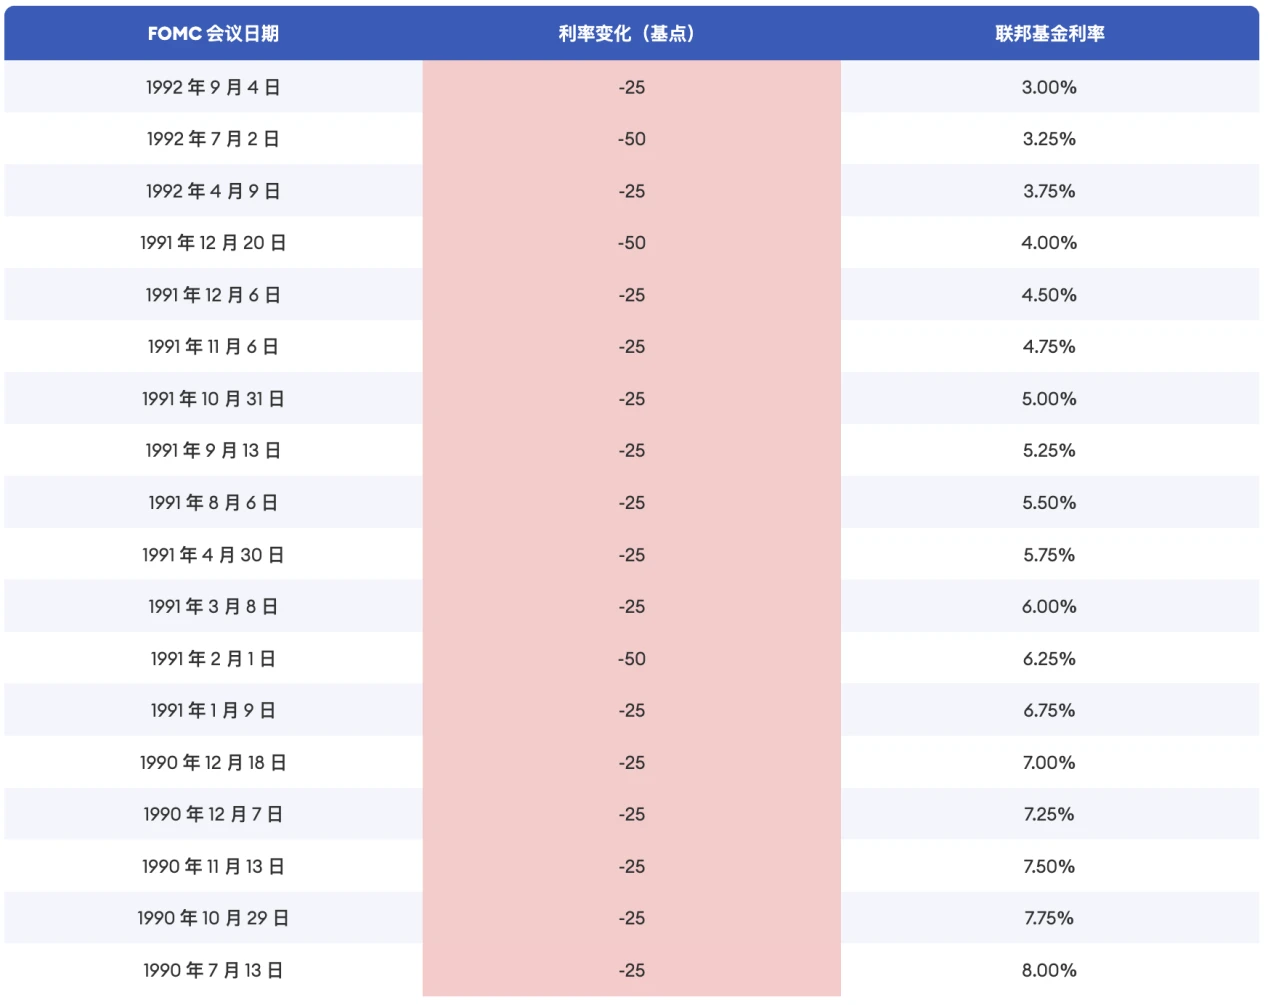
In the late 1980s, the rapid rise in US interest rates led to the dilemma of short-term deposit interest rates being higher than long-term fixed loan rates for savings and loan banks, and the yield curve of US Treasury bonds was inverted. The savings and loan crisis broke out in the US financial industry, and a large number of banks and savings institutions went bankrupt. Combined with the impact of the external Gulf War, from August 1990 to March 1991, the US economy fell into a recession defined by the National Bureau of Economic Research (NBER), which lasted for 8 months. In June 1989, the Federal Reserve started a more than three-year interest rate cut cycle, with a cumulative interest rate cut of 681.25 BP, and the upper limit of the policy interest rate dropped from 9.8125% to 3%.
July 1995 to January 1996 (precautionary rate cuts)
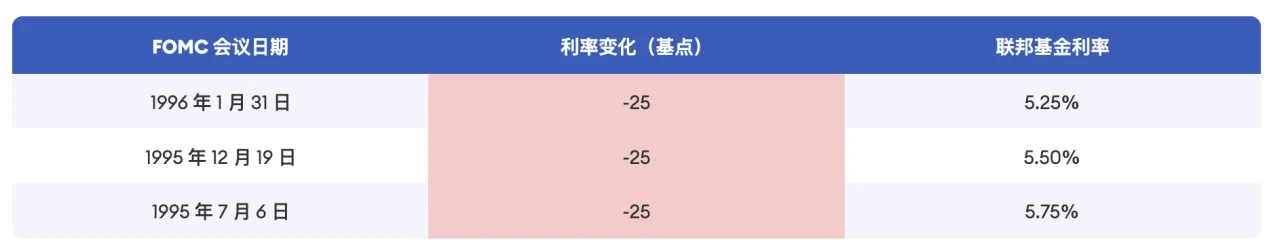
In 1995, the US economic growth slowed down and employment was sluggish. The Federal Reserve believed that although the economy had not yet entered a recession, the decline in some economic indicators might indicate the risk of a future economic downturn, and decided to start cutting interest rates to stimulate the economy and prevent recession. This interest rate cut began in July 1995, lasting seven months, with three cumulative interest rate cuts, a total of 75 BP, and the upper limit of the policy interest rate dropped from 6% to 5.25%. After that, the US economy achieved a soft landing, and the employment and manufacturing PMI indicators that were weak before the interest rate cut rebounded. This round of interest rate cycle is also regarded as a typical case of soft landing. On the other hand, the Feds operation successfully avoided the take-off of inflation. During the interest rate cut, the PCE inflation rate hardly exceeded 2.3%, and remained relatively stable.
September-November 1998 (precautionary rate cuts)
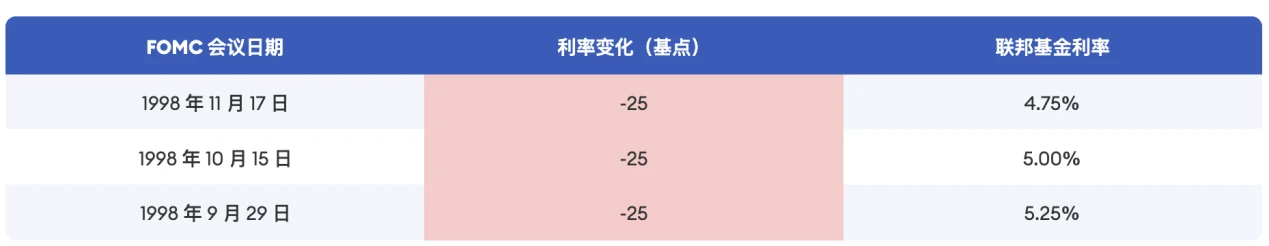
In the second half of 1997, the Asian Financial Crisis broke out. The economic recession in Asia led to weakened external demand, which affected the US commodity trade. The US economy remained stable overall, but the external environment was turbulent. The weakness of commodity trade put pressure on the US manufacturing industry and the US stock market adjusted. From July to August 1998, the SP 500 index adjusted for nearly two months, with the deepest drop of nearly 20%. The giant hedge fund Long-Term Capital Management (LTCM) was on the verge of bankruptcy. In order to prevent the impact of the crisis from further affecting the US economy, the Federal Reserve began to cut interest rates in September 1998. By November, it had cut interest rates three times, a total of 75 BP, and the upper limit of the policy interest rate was reduced from 5.5% to 4.75%.
January 2001 to June 2003 (recessionary rate cuts)
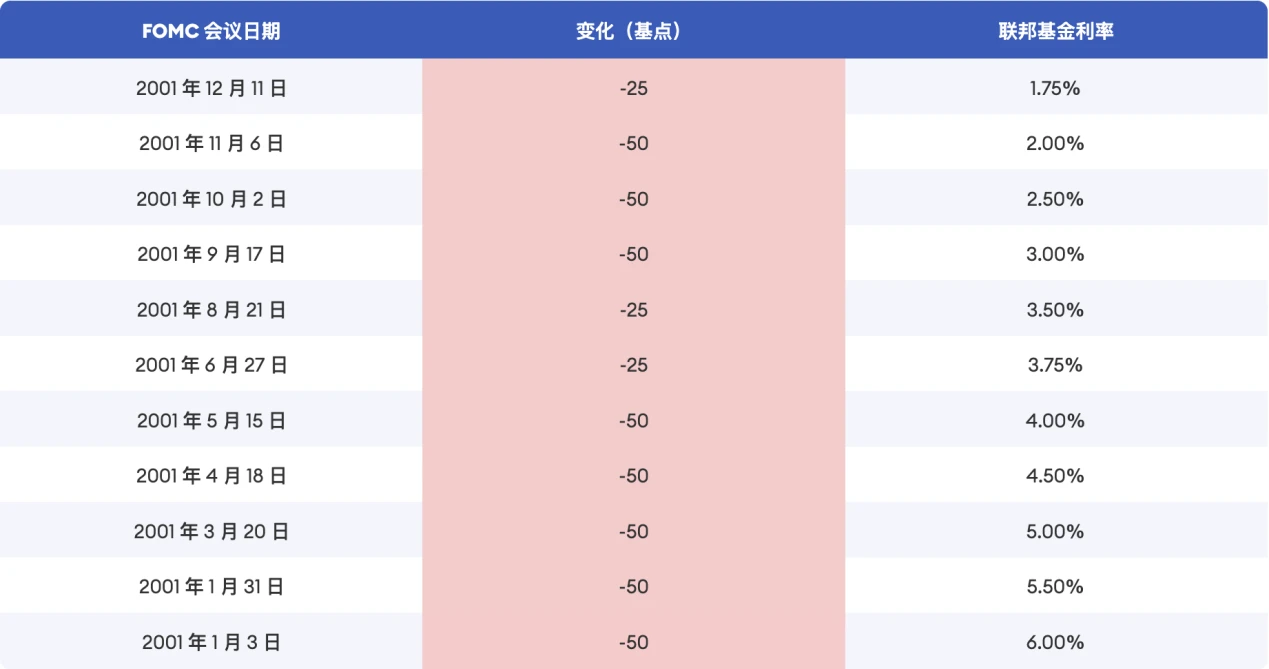

In the late 1990s, the rapid development and popularization of Internet technology triggered excessive speculation, and the frenzy of irrational prosperity led to a large amount of funds flowing into Internet investment. From October 1999 to March 2000, the Nasdaq index rose as high as 88% in five months. From June 1999 to May 2000, the Federal Reserve raised interest rates 6 times, a total of 275 BP, to cope with the overheating of the economy. In March 2000, the Nasdaq index peaked and then fell rapidly. The Internet bubble gradually burst, a large number of Internet companies went bankrupt, and the economy fell into recession. On January 3, 2001, the Federal Reserve announced a 50 BP cut in interest rates, and then cut interest rates 13 times, a total of 550 BP, and the upper limit of the policy interest rate dropped from 6.5% to 1.0%.
September 2007 to December 2008 (recessionary rate cuts)

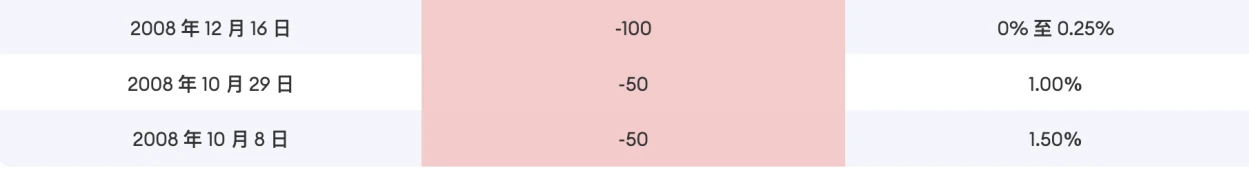
In 2007, the US subprime mortgage crisis broke out and further spread to other markets such as bonds and stocks, and the US economic situation took a sharp turn. On September 18, the Federal Reserve lowered the federal funds target rate by 50 BP to 4.75%, and then cut interest rates 10 times in a row. By the end of 2008, the interest rate had dropped by 550 BP to 0.25%. The interest rate cut was still not enough to cope with the severe economic situation. The Federal Reserve introduced quantitative easing (QE) for the first time, through large-scale purchases of US Treasury bonds, mortgage-backed securities and other unconventional monetary policy tools to lower long-term interest rates, stimulate the economy and inject liquidity into the market.
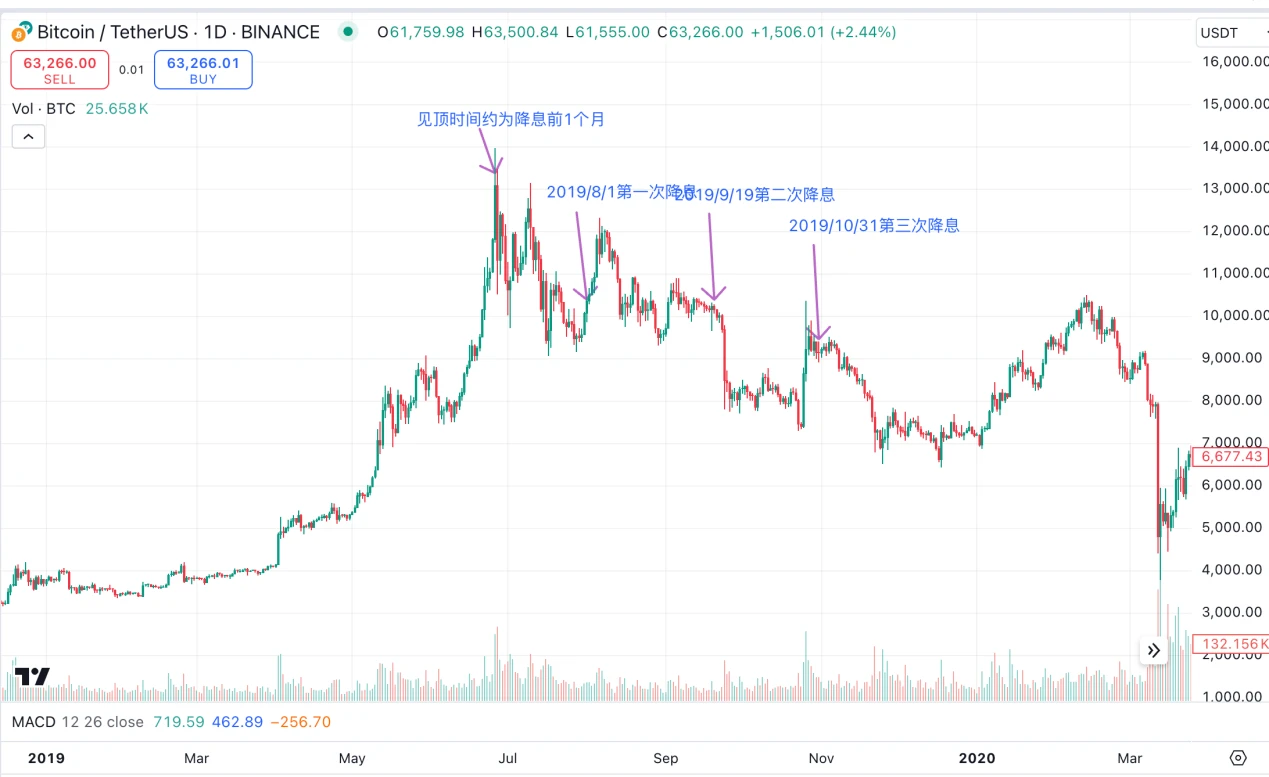
August to October 2019 (precautionary rate cuts)
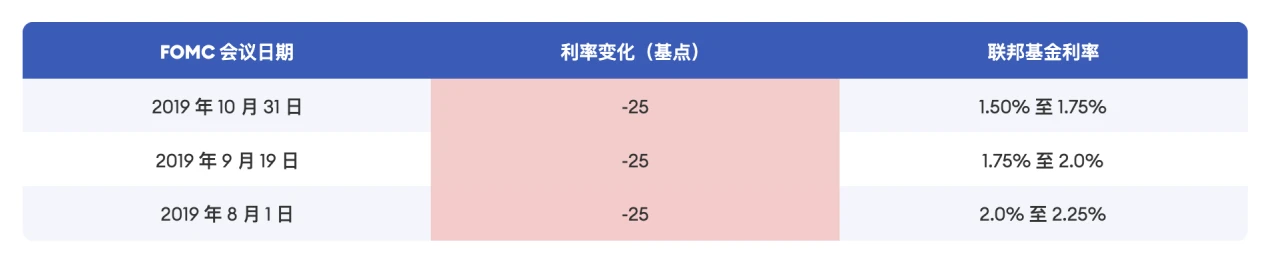
In 2019, the US economy and job market were generally stable, but due to factors such as geopolitical conflicts and Sino-US trade frictions, US external demand weakened, while domestic demand also slowed down, and the inflation rate was below 2%. In the first half of 2019, the PCE inflation rate remained at 1.4-1.6%, and the core PCE inflation rate dropped from 1.9% at the beginning of the year to 1.6% in March-May.
On July 31, 2019, the Federal Reserve announced a 25 BP rate cut to 2.25%, saying that the US economy was growing moderately and the job market was solid, but both overall and core inflation were below 2%, aiming to prevent economic slowdown, especially in light of the tense trade situation and slowing global growth. Before the global outbreak in 2020, the US economy was operating stably as a whole, with indicators such as manufacturing PMI and core PCE rebounding. From August to October 2019, the Federal Reserve cut interest rates three times in a row, a total of 75 BP, and the upper limit of the policy interest rate dropped from 2.5% to 1.75%.
March 2020 (recessionary rate cut)
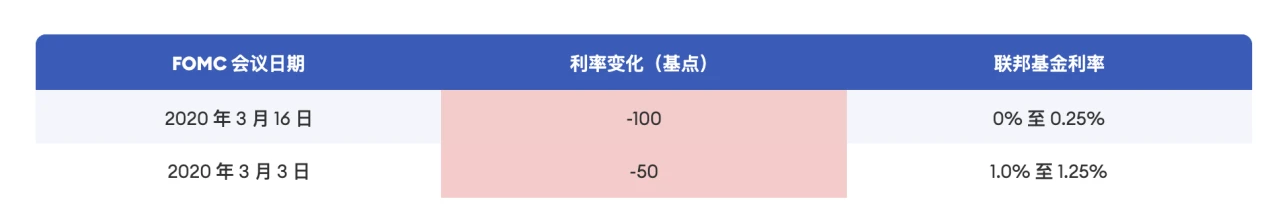
The COVID-19 pandemic spread across the globe in 2020. In March 2020, the Federal Open 市場 Committee slashed interest rates twice at an unscheduled emergency meeting, restoring the federal funds target rate range to 0 to 0.25%.
III. Asset Prices in a Rate Cutting Cycle


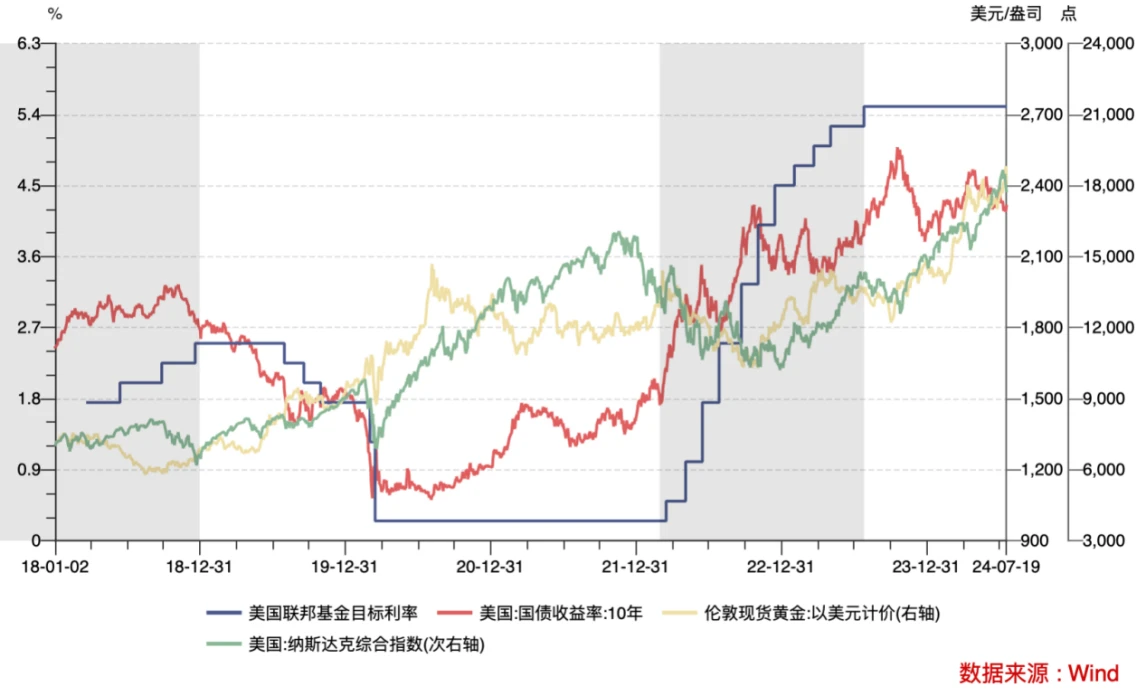
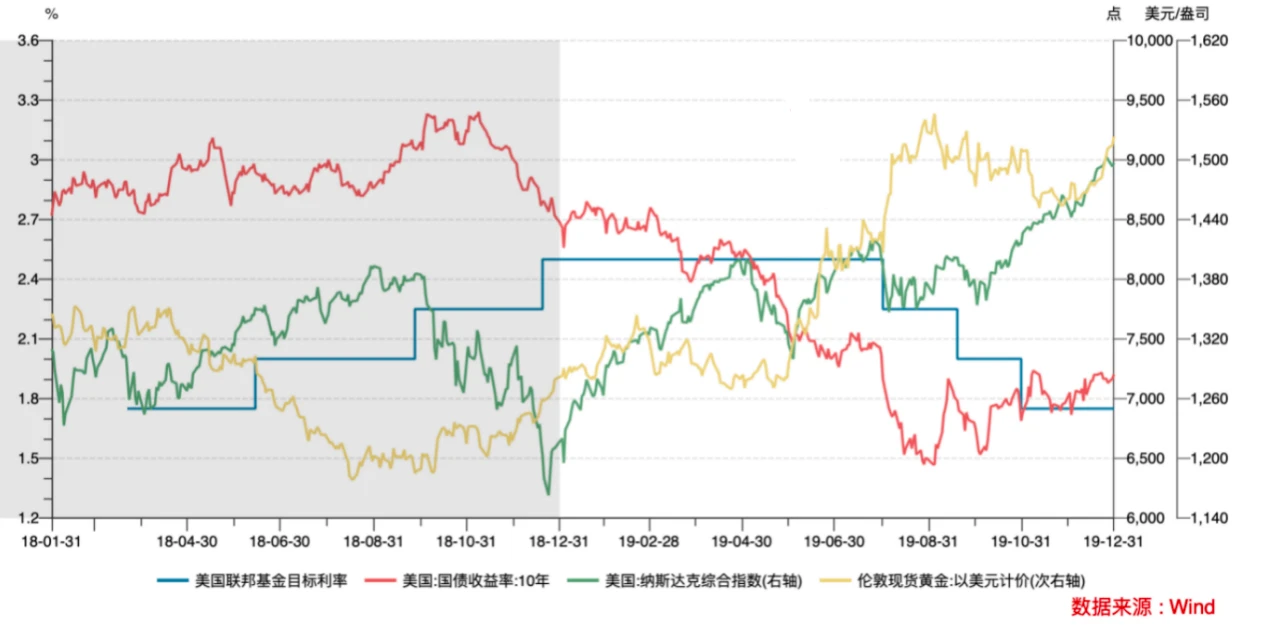
The change in asset prices after a rate cut has a lot to do with whether the macroeconomic environment at the time is in recession. We believe that the current US economic data does not support the conclusion of a recession. Under the premise of a soft landing of the US economy, we should pay more attention to the trend of asset prices during the preventive rate cuts, which are mainly during the period of 19 to 20 years, which is relatively close to the present time.
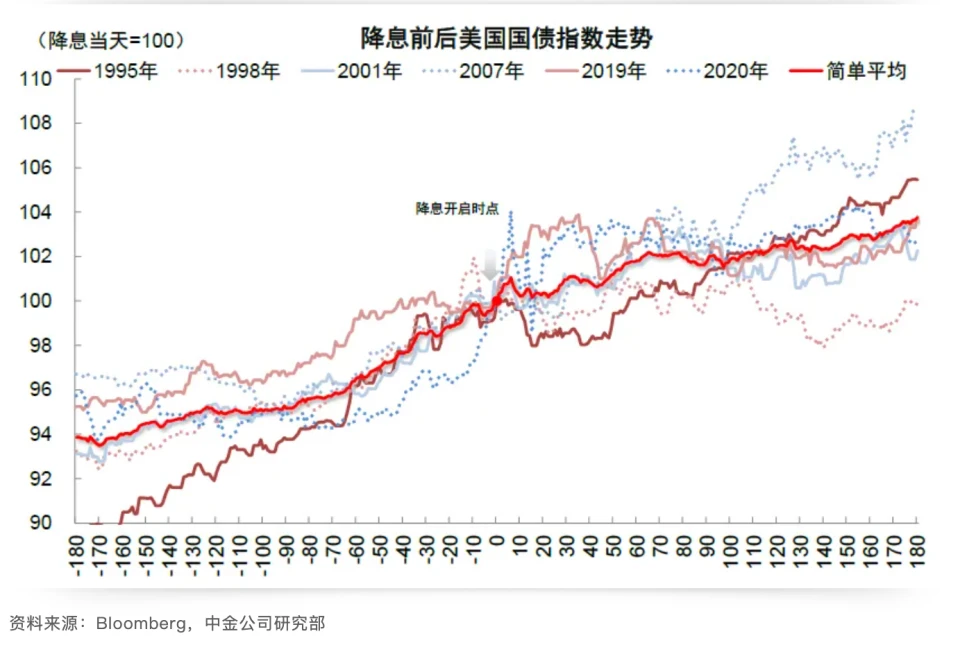
美國國債
Before and after the rate cut, the overall US Treasury bond was on an upward trend. The rise before the rate cut was more certain and larger. The average frequency of increase in the 1, 3, and 6 months before the rate cut was 100%, and it decreased after the rate cut. At the same time, the average increase in the 1, 3, and 6 months before the rate cut was 13.7%, 22%, and 20.2%, and after the rate cut was 12.2%, 7.1%, and 4.6%, which clearly shows the markets early price-in behavior. The volatility intensified about a month before and after the rate cut. In the later period of the rate cut, due to different economic recovery situations, the interest rate trends in different periods diverged.
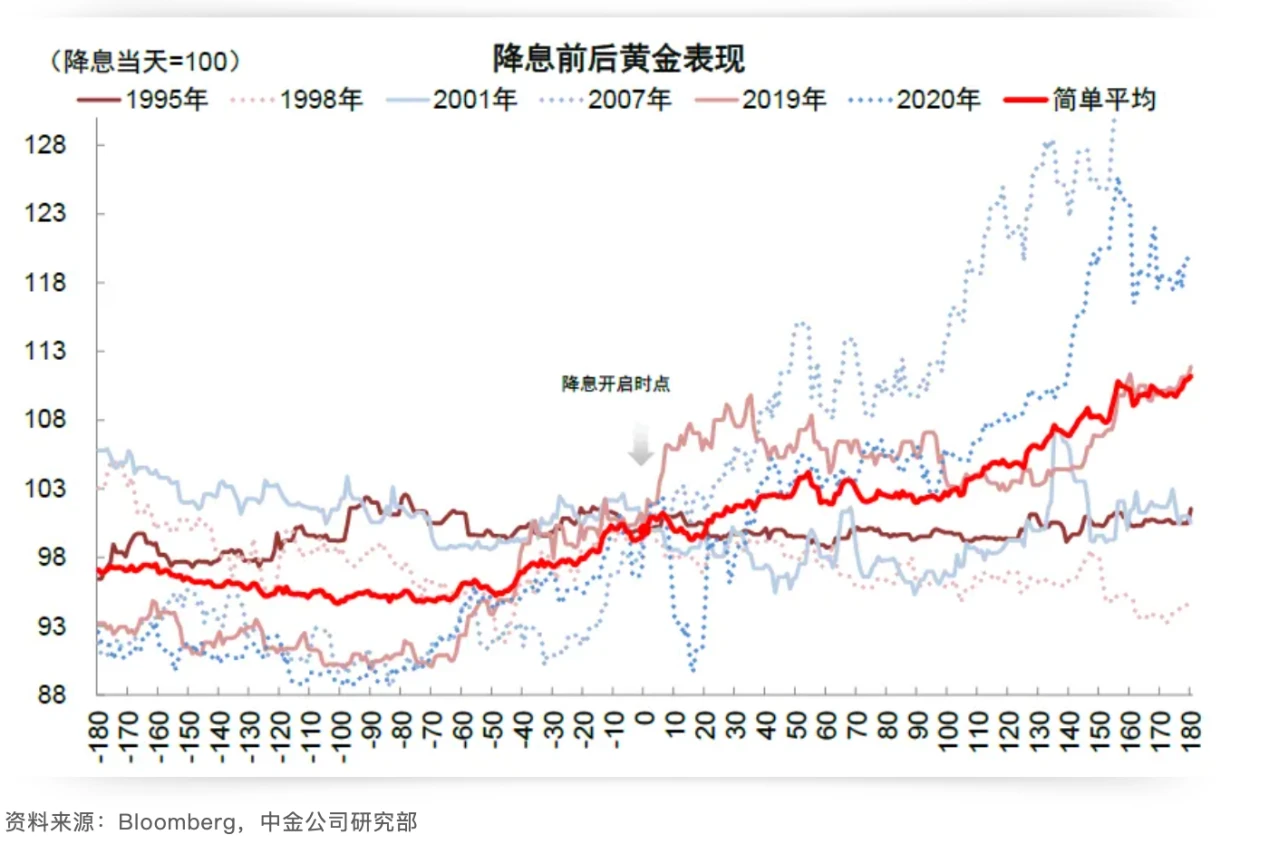
金子
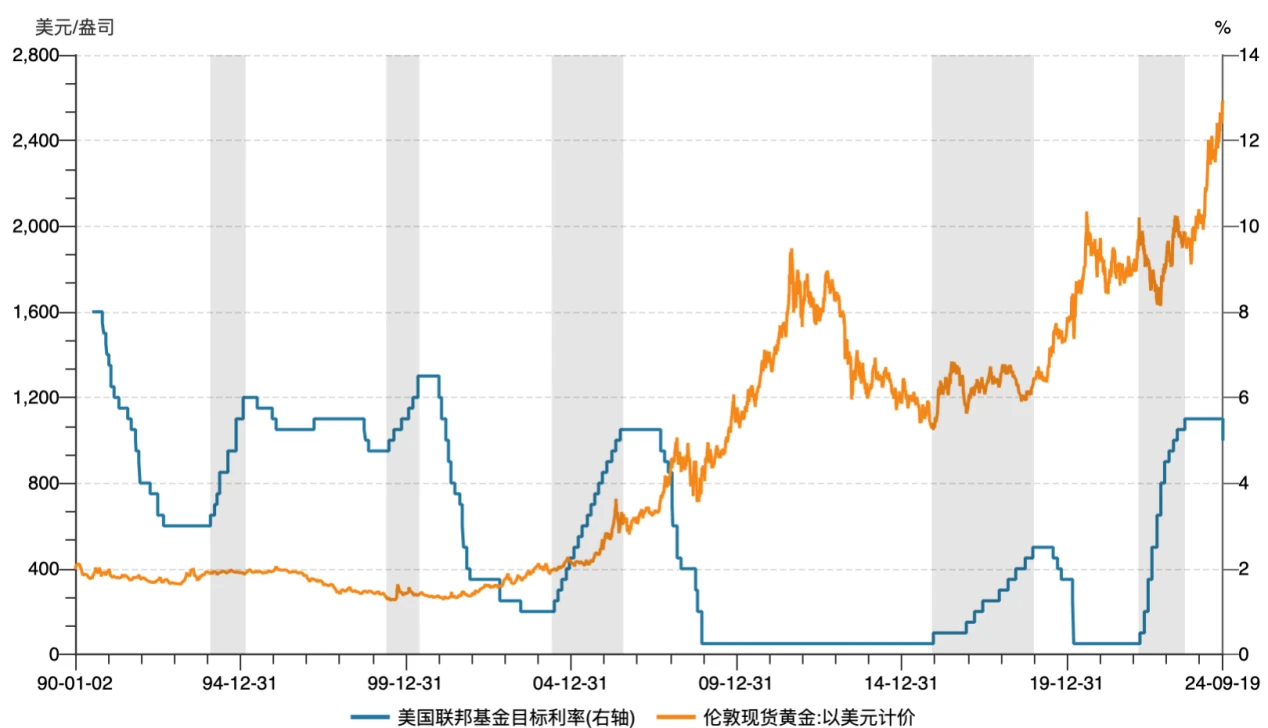
Similar to US bonds, the probability and magnitude of gold rising before the rate cut is generally greater. Benefiting from the risk aversion demand in critical situations, the correlation between the trend of gold and whether there is a soft landing is relatively unclear. From a trading perspective, the best trading time for assets on the denominator side is before the rate cut. Due to the full inclusion of expectations and the limited rate cut, after the rate cut is realized, more attention can be paid to the assets on the numerator side that benefit from the rate cut.
Based on the gold ETF dividing line, the correlation between gold prices and interest rate cuts was not clear before the 21st century. In 2004, the US SEC approved the first globally traded gold ETF. The rise of gold ETFs has driven a surge in demand for gold investment, attracted a large number of retail investors and institutional investors, and the continuous inflow of funds has provided a strong impetus for the rise in gold prices. Until it peaked in 2011, this round of rising cycles lasted for 7 years. During this period, the Federal Reserve experienced a sharp interest rate hike from 2004 to 2006 and a sharp interest rate cut from 2007 to 2008. Gold maintained an overall upward trend. Excluding the impact of gold ETFs, the only meaningful interest rate cut cycle that can be referenced is 2019. In the short term, in the interest rate cut cycle from August to October 2019, gold rose sharply after the first interest rate cut, and then fluctuated and pulled back in the next two months. In the long term, gold still showed an upward trend after the interest rate cut.
The Fed鈥檚 interest rate cycle and gold prices
納斯達克
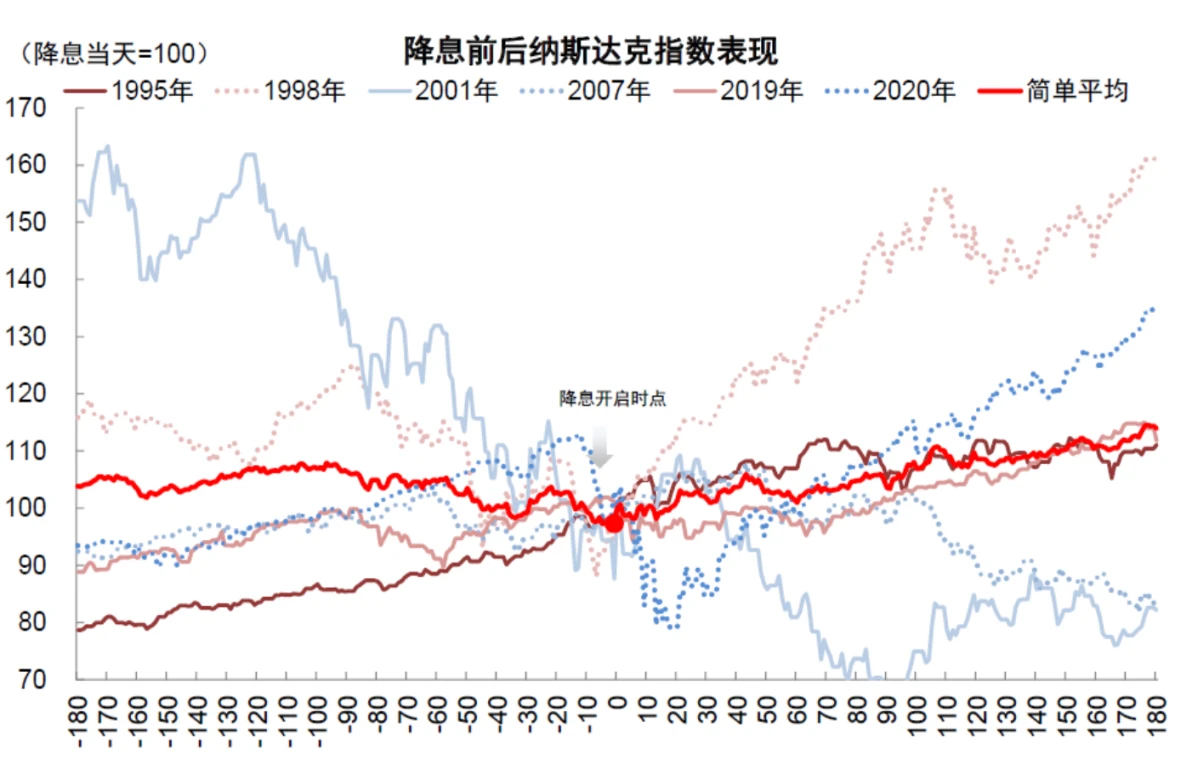
The performance of the Nasdaq in a recessionary rate cut depends on the fundamental repair. In a recessionary rate cut cycle, the Nasdaq as a whole mostly shows a decline, except for a 28% increase in the ultra-long rate cut cycle in 1989. In the rate cut cycles of 2001, 2007, and 2020, it fell by 38.8%, 40%, and 20.5%, respectively. The short-term performance of the Feds first preventive rate cut in different years varies, but in the long run, it has all risen. Intuitive preventive rate cuts can often have a positive effect on the economy, reverse signs of weakness, and drive the stock market up. Therefore, the key to judging the trend of the Nasdaq index lies in the grasp of the recession. In the 2019 rate cut, the Nasdaq fell back after the first and second rate cuts, and showed an overall oscillating trend within three months of the rate cut, and started to rise around the third rate cut.
比特幣
In the interest rate cut cycle in 2019, BTC prices rose briefly after the first interest rate cut, and then the overall downward channel was opened. The overall retracement from the top lasted 175 days, and the retracement was about 50% (excluding the impact of the subsequent epidemic). What is different from the last interest rate cut cycle is that due to the swing in the expectations of interest rate cuts, BTCs retracement came earlier this year. After the high point in March this year, BTC has been fluctuating and retracement for a total of 189 days, with a maximum retracement of about 33%. From historical experience, the long-term bullish market outlook is likely to fluctuate or retrace in the short term, but the intensity and time of the retracement will be smaller and shorter than in 2019.
This article is sourced from the internet: Cycle Trading: Changes in asset prices after interest rate cuts
Original article from crypto research company Tiger Research Compiled by Nan Zhi ( @Assassin_Malvo ) New Cryptocurrency Regulations in South Korea Since the first ban in 2018, the South Korean governments approach to regulating virtual assets has changed a lot. Eventually, South Korea incorporated virtual assets into the current regulatory framework. The key moment of this transformation was the entry into force of the Virtual Asset User Protection Act on July 19, 2024 , which emphasized the high importance attached to investor protection. (Odaily Note: South Korea banned any form of ICO in 2017 and considered closing crypto exchanges in 2018.) This regulatory shift aims to address persistent problems of arbitrage, fraud and illegal solicitation, which are not adequately addressed by the existing anti-money laundering-focused framework, with incidents involving illegal…