Task
Ranking
已登录
Bee登录
Twitter 授权
TG 授权
Discord 授权
去签到
下一页
关闭
获取登录状态
My XP
0

關鍵指標(香港時間8月26日下午4:00 -> 9月2日下午4:00) :
BTC/美元 -9.8% ($63, 600 -> $57,400),ETH/美元 -12.2% ($2,735 -> $2,400)
BTC/USD 12月(年底)ATM波動率-1.4 v (62.2->60.8),12月25日風險逆轉波動率+0.2 v (2.1->2.3)
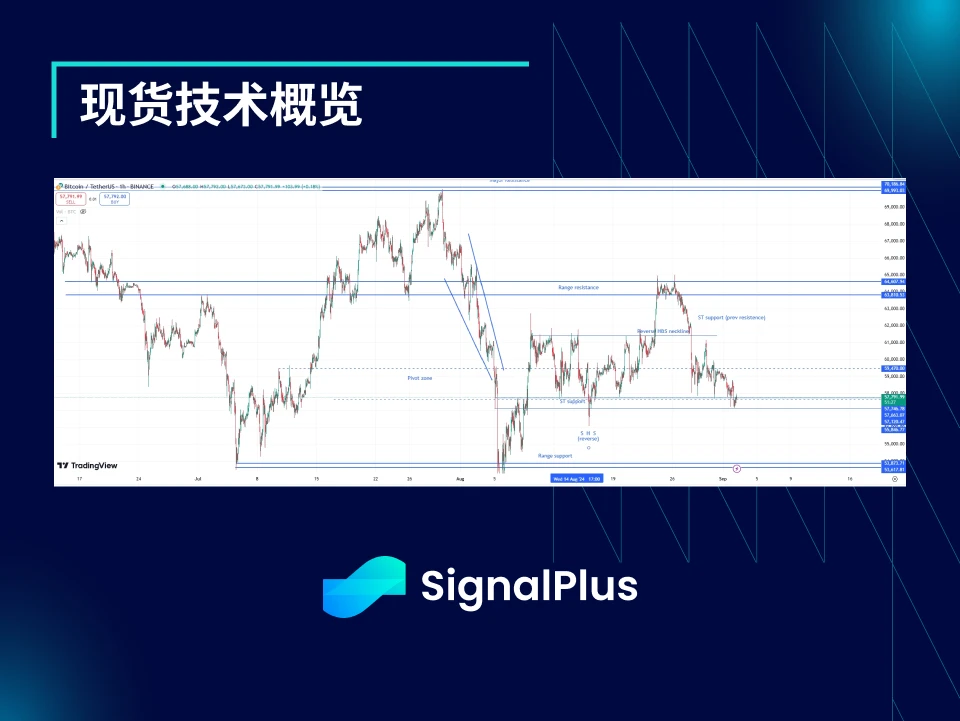
在嘗試突破$64-65k區間阻力未果後,BTC價格迅速回落至短期支撐位$57k。
跌破 $57k 可能會引發更大幅度的下跌,挑戰 $53-54k 價格區間支撐。我們認為,短期內風險回報可能會進一步走低,但強烈的逆轉訊號可能會形成堅實的底部,為下次聯邦公開市場委員會會議和美國大選奠定上行勢頭。
市集活動:
總體而言,本週市場相對平靜,市場參與者仍在消化月初的劇烈波動,享受美國大選和年底繁忙日程之前的夏季最後幾天。
加密貨幣價格缺乏上漲動力,美元仍受惠於其較高的收益率,市場已消化聯準會降息預期。 BTC/美元在$64-65k阻力位遭遇阻力,回落至$60k下方。接下來可能會挑戰$50-70k區間的下限。同時,ETH/USD持續表現疲軟,未能突破$2800附近的賣壓。
美國的投注賠率顯示,川普和哈里斯幾乎持平,這削弱了川普持續看漲言論所產生的樂觀情緒(儘管哈里斯陣營最初發表了一些支持加密貨幣的言論)。
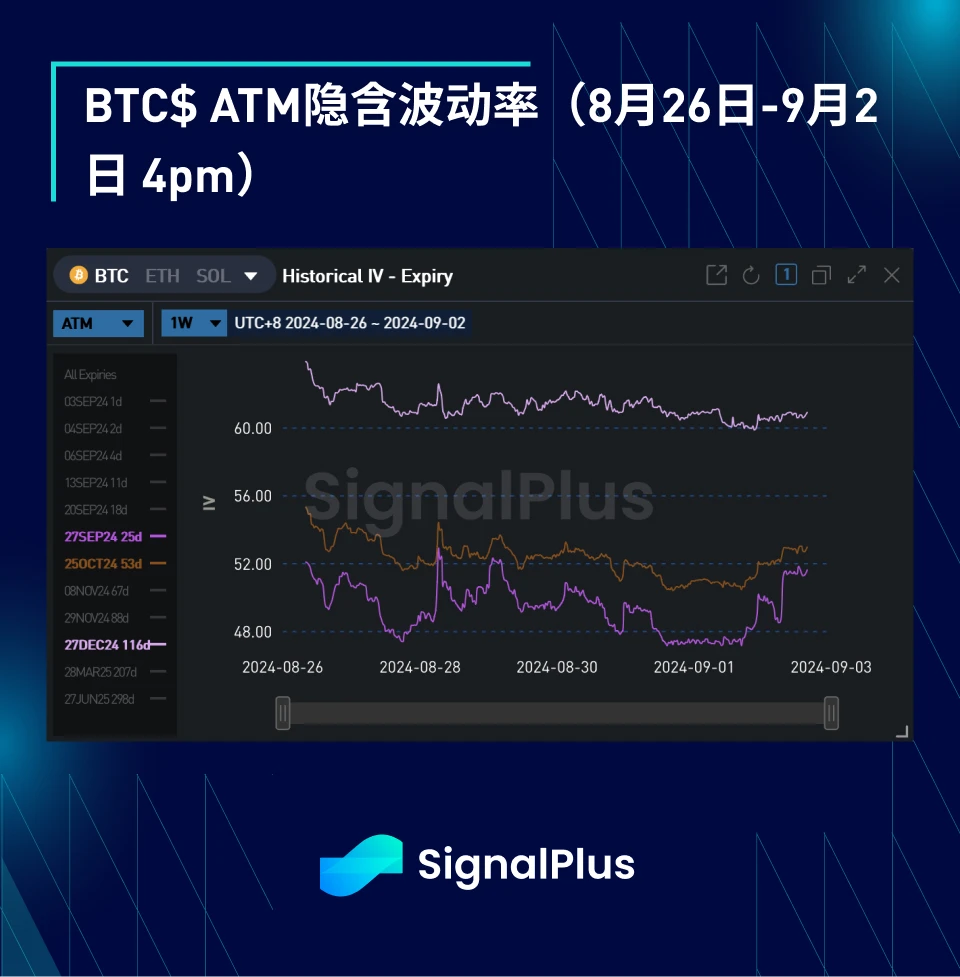
本週隱含波動率較弱,主要是由於現貨價格上漲,市場參與者賣出買權獲利。
儘管 9 月發生了許多重要事件,但在快速回落至 $60k 後,實際波動率總體平靜,這導致曲線前端的波動率大幅下降。然而,週一早晨,前端隱含波動率的幾乎所有跌幅都完全逆轉,現貨價格挑戰該區間近期低點$57k。
對美國大選相關選擇權的需求持續存在,主要是將 9 月/10 月看漲期權滾動至 11/12 月。人們對 9 月 18 日至 19 日的 FOMC 會議選擇權也有一些興趣,購買了一些 9 月 13 日與 9 月 20 日的日曆價差選擇權。
偏度/凸度:
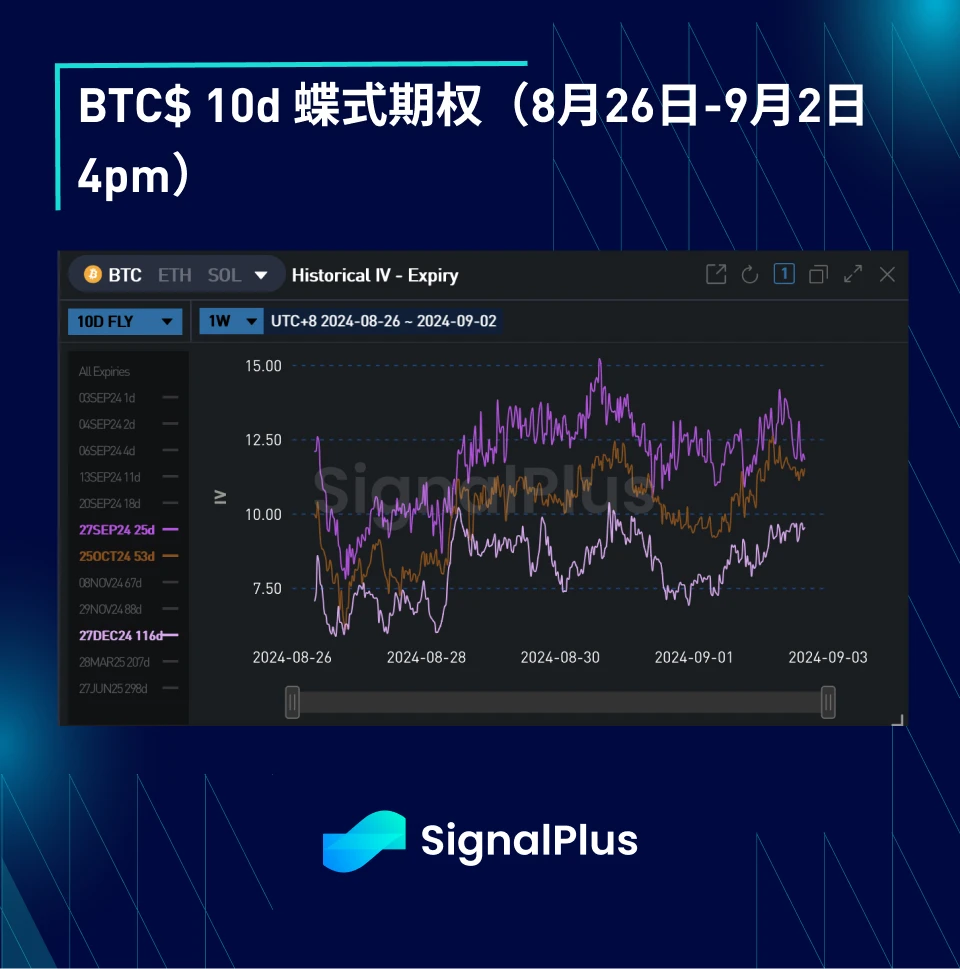
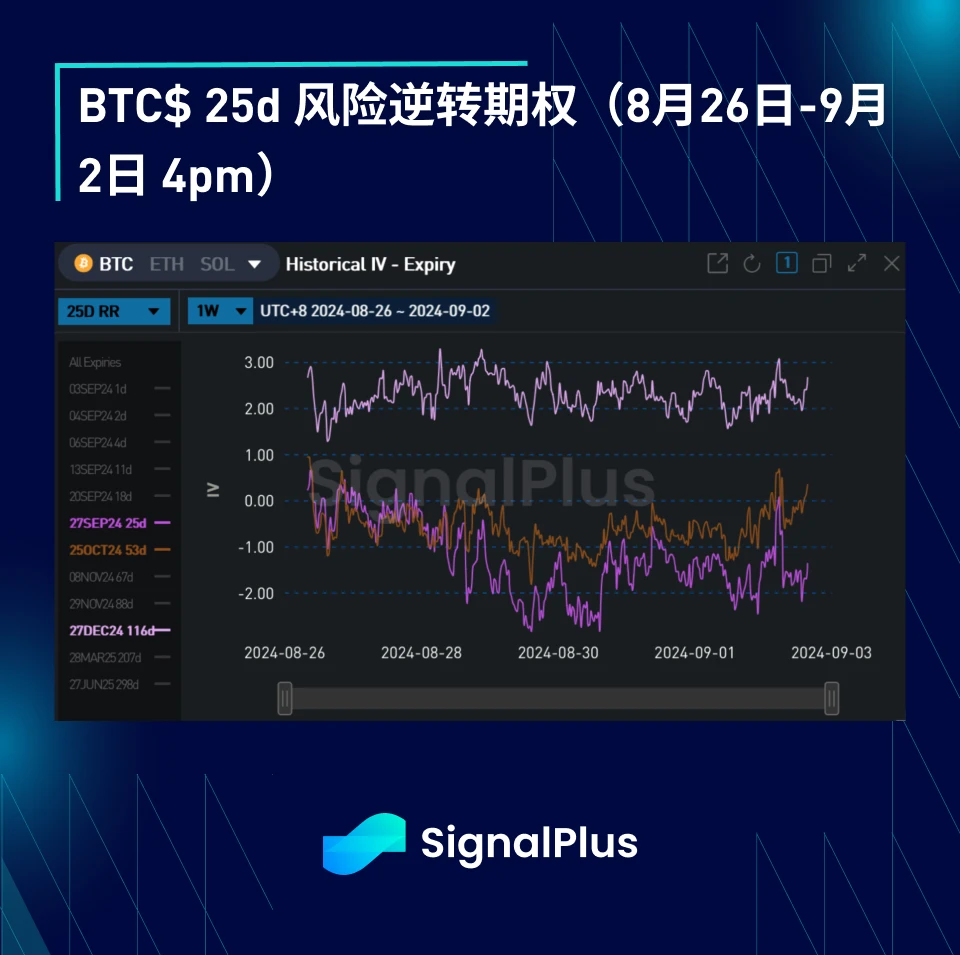
經過上週的大幅調整後,本週偏度已趨於穩定;現貨回檔導致隱含波動率下降,而由於現貨價格向下調整,週末看漲期權拋售壓力有所緩解,緩解了上偏和蝶式期權的壓力。
蝴蝶四號繼上週暴跌後整體反彈;我們仍然認為,隨著 BTC 挑戰或突破 $50-70k 價格區間,波動性將會上升。
祝您本週交易順利!

您可以使用t.signalplus.com的SignalPlus交易風向標功能來獲取更多即時加密貨幣資訊。如果您想在第一時間收到我們的更新,請關注我們的推特帳號@SignalPlusCN,或加入我們的微信群(新增助手微信:SignalPlus 123)、Telegram 群和 Discord 社區,與更多朋友交流互動。
SignalPlus 官方網站:https://www.signalplus.com
本文來源於網路:BTC波動性:2024年8月26日-9月2日一週回顧
原作者:浩天 最近,FUD以太坊和@VitalikButerin的聲音越來越強。尤其是海外KOL就Blob空間利用率、Layer 2收入等主題進行了非常有趣的討論。撇開二級市場的情緒,單純看數據我們該如何評價以太坊的 Layer 2 策略呢?接下來我想表達一下我的看法:讓我們回到以太坊坎昆升級之前。大家都熱衷於RaaS和DA戰爭,因為二層鏈下一鍵增發如雨後春筍般湧現,這將直接帶動二層批量交易對以太坊主網DA能力的需求,進而掀起Blobs 空間的價格戰。然後大量的ETH就被銷毀了…


