原創| Odaily星球日報( @Odaily中國 )
 Although the overall market cooled down from April to June, the price of SOL experienced a roller coaster ride, and the market value dropped by 25% month-on-month to US$68 billion, but returning to the fundamental analysis, the Solana ecosystem still has impressive data performance (most of the data in this article is selected from Messaris Solana Second Quarter Report ):
-
In the second quarter, although Solanas DeFi TVL fell 9% month-on-month to US$4.5 billion in US dollars, ranking fourth in the network, DeFi TVL denominated in SOL increased by 26% month-on-month, indicating that capital still had confidence in Solana in the second quarter and there was no large-scale outflow.
-
The amount of SOL pledged also rebounded at the end of the second quarter, increasing by 5% month-on-month to 378 million SOL.
-
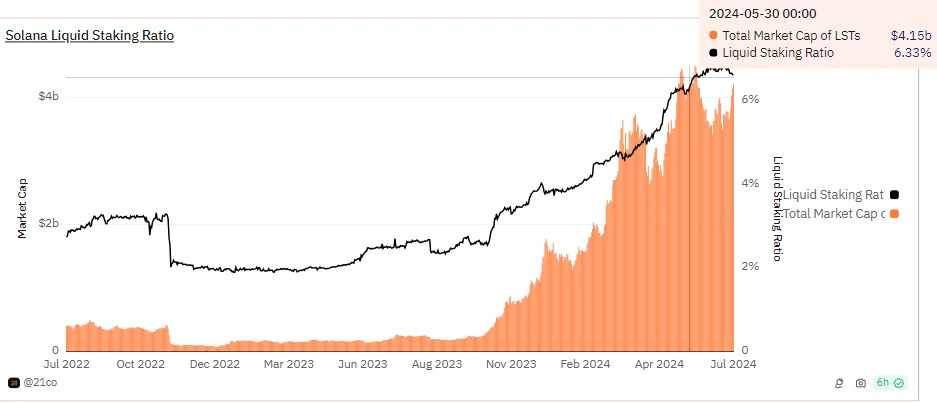
Solana’s liquidity staking rate (the percentage of SOL staked that is liquid) increased 22% month-over-month to 6.4%.
-
Solana’s total economic value (transaction fees and MEV) denominated in SOL grew 41% month-over-month to 967K SOL ($151M). 56% of this came from transaction fees, and the rest came from MEV tips.
-
Network activity (measured by non-voting transactions and fee payers) also remained elevated throughout Q2’24. Average daily fee payers increased 51% year-over-year to 900,000, and average daily new fee payers increased 114% year-over-year to 247,000.
The Solana ecosystem continued to develop actively in the second quarter. So what are the main protocols in the ecosystem that support Solanas rapid development in the second quarter? Will the Blinks function that appeared at the end of the second quarter have a bright performance in the third quarter? In this article, Odaily Planet Daily will explore these issues from a data perspective.
5 protocols supporting Solana Q2 development
pump.fun: Meme coin craze drives Solana on-chain activity
pump.fun is a Meme coin launch platform on Solana, where users can easily create Meme tokens on the platform without providing liquidity. In May, several celebrities launched their own tokens on pump.fun, triggering a celebrity Meme coin craze on Solana. According to DefiLlama data, pump.fun generated $48 million in revenue in the second quarter, an average of $525,000 per day.
pump.fun also directly promoted the activity on the Solana chain . According to Dune data, in the second quarter, the number of transactions deploying Meme coins on the Pump.fun platform alone exceeded 1 million; the number of active addresses and new addresses on the platform also increased throughout the second quarter, and the average number of daily active addresses exceeded 60,000 in June.
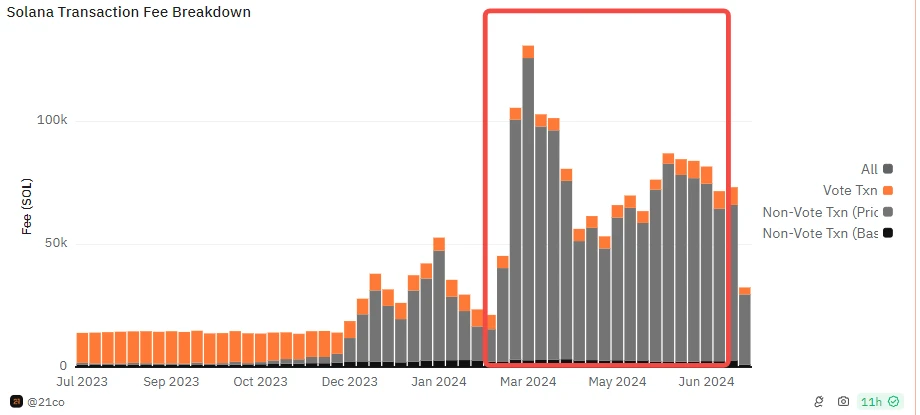
Correspondingly, in the second quarter, the proportion of fees generated by non-voting transactions in Solana network transaction fees increased significantly.
Raydium: The main contributor to Solana DeFi TVL growth
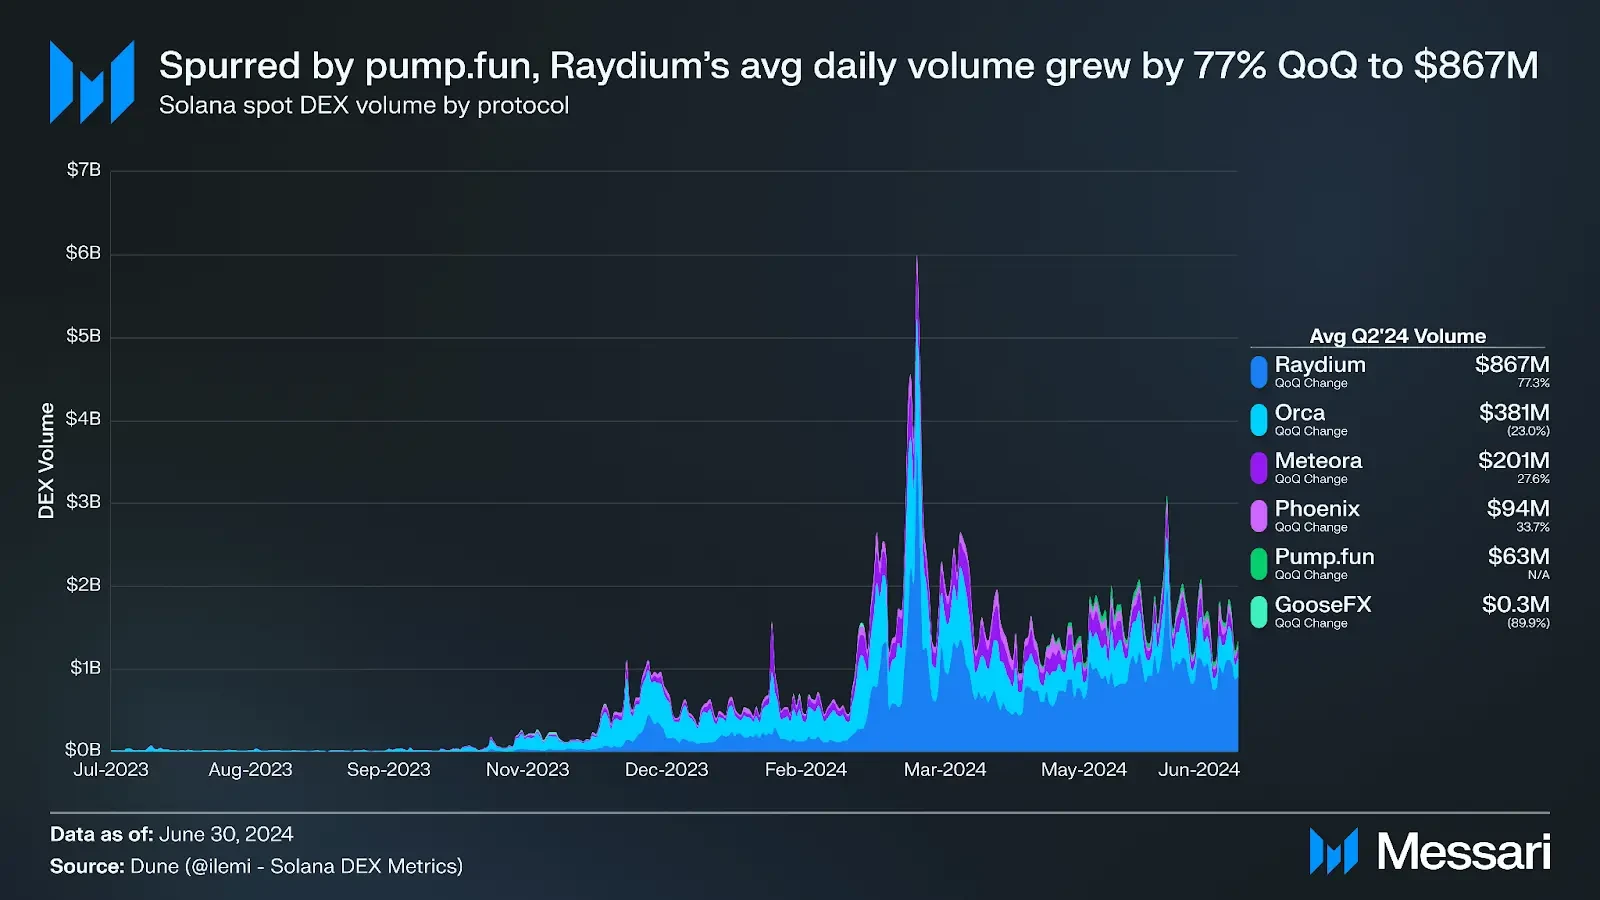
In the second quarter, DEX trading volume on Solana was also affected by the Meme coin craze, with the average daily trading volume of spot DEX increasing by 32% month-on-month to US$1.6 billion.
Raydium has been the biggest beneficiary of meme coin startup pump.fun , as all liquidity on the pump.fun bonding curve moved to Raydium once the token reached a market cap threshold of $69,000. Raydium’s average daily volume grew 77% quarter-over-quarter to $867 million, increasing its market share to 54% from 40% in Q1.
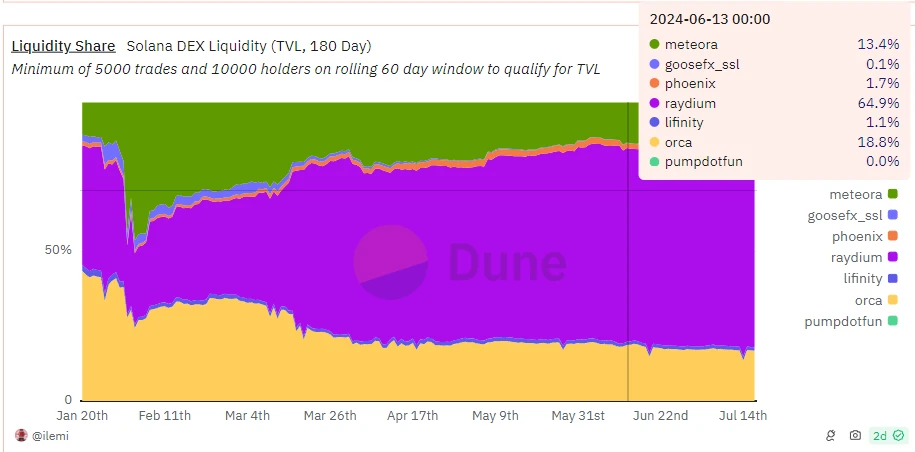
Raydiums TVL also increased by 46% month-on-month to $991 million, becoming Solanas top DeFi protocol. At the same time, according to Dune data, Raydiums share of DeFi TVL on Solana further expanded in the second quarter, accounting for about 65%, and Raydium became the main driving force for the growth of Solanas DeFi TVL.
Compared with Uniswap, the leading DEX on Ethereum, according to DefiLlama data, although Raydiums fees for the entire second quarter (about US$71 million) are not as good as Uniswaps fees for the second quarter (US$239 million), Raydiums fees have exceeded Uniswap 在 the past 30 days (at the end of the second quarter), and according to Coin 98 Analytics data , Raydiums global number of independent active addresses in the past 30 days also leads Uniswap with 6 million to 4.4 million.
The comparison of top protocols within the ecosystem often best reflects the gap between chains. From this, it can be seen that the gap between the Solana ecosystem and Ethereum in DeFi is narrowing.
Jupiter: Spot trading volume and derivatives TVL ranked first
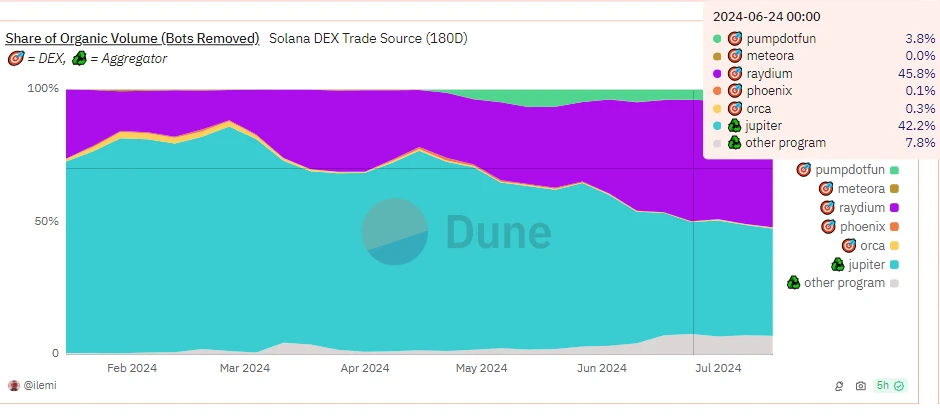
From Q1 to mid-Q2, Jupiter was the main trading venue on Solana, accounting for more than 50% of DEX trading volume, but with the rise of Raydium, by the end of Q2, Jupiters market share was almost on par with Raydium, and the once unified landscape has now become a two-way split.
Despite this, Jupiter is still the core protocol supporting Solanas development in the second quarter . In addition to ranking first in DEX trading volume throughout the second quarter, Jupiter perps average daily perpetual trading volume was US$370 million, a 13% increase from the previous quarter. According to DefiLlama data, at the end of the second quarter, Jupiter perps TVL surpassed Drift to become the first in Solanas derivatives market TVL.
Therefore, whether in the spot trading or derivatives market areas, Jupiters contribution to the growth of the Solana ecosystem in the second quarter was huge.
Zeta Markets: Q2 derivatives trading volume achieved significant growth
Zeta Markets is a perpetual DEX on the Solana ecosystem. Zeta Markets average daily perpetual contract trading volume in the second quarter increased by 212% month-on-month to $82 million, while Drifts average daily perpetual trading volume decreased by 11% month-on-month to $127 million. At the same time, according to Dune data, in terms of daily active addresses on Solanas perpetual market, Jupiter perps far exceeds other exchanges by 1 to 2 times, while Zeta Markets and Drifts daily active addresses are not much different.
Therefore, according to DefiLlama data, when the TVL growth of Zeta Markets and Drift in the second quarter was relatively slow, even though Drifts TVL was higher than Zeta Markets, from the perspective of transaction volume growth, Zeta Markets contributed more to the Solana ecosystem in the second quarter. However, it is still unclear from the data perspective whether the growth of Zeta Markets transactions is due to real ecological needs or superficial airdrop incentives. (From the users perspective, it is also exciting.)
TVL growth curve of Zeta Markets, Drift, and Jupiter perps
Sanctum: Bringing New Life to Solana LST
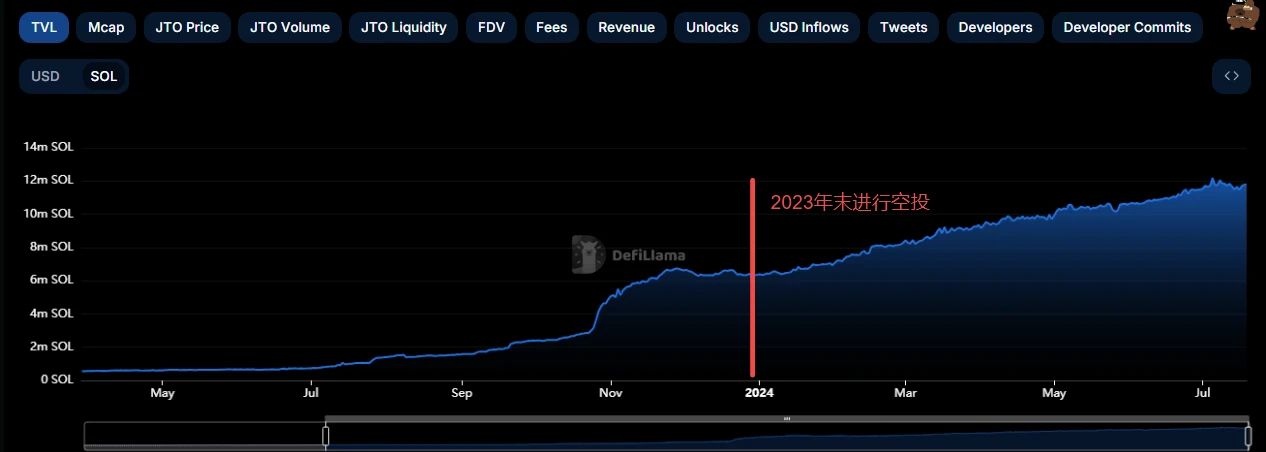
Solana’s LST performed quite well in the second quarter, mainly due to Sanctum and Jito. Jito is the Solana native protocol launched last year, while Sanctum was the dark horse of the second quarter.
Sanctum is the LST liquidity aggregation protocol in the Solana ecosystem. It was launched at the end of the previous quarter, but has grown rapidly since its launch. In the second quarter, a total of 44 LSTs were launched, accounting for nearly 14% of Solanas LST market share, a month-on-month increase of 3,700%, and a TVL of over 5.77 million SOLs. At the same time, Jitos jitoSOL is still Solanas LST leader, with a market share of 47%. It also grew by 22% month-on-month this quarter, with a TVL of over 11.49 million SOLs. Marinade, which ranks second in market share, saw its mSOL supply fall by 13% month-on-month.
However, Sanctum’s rapid growth may also be due to the airdrop. In addition, there are some controversies in the community regarding the airdrop distribution of Sanctum. It is unknown whether the rapid growth can be maintained. However, the market had the same concerns when Jito airdropped last year, but the fact is that even after the airdrop, Jito’s TVL denominated in SOL is still on an upward trend.
This proves that even without the airdrop hunters, the Solana LST narrative still holds true . Since the launch of Sanctum, Solana’s liquidity pledge rate has increased to 6.4%, a 22% increase from the previous month. Although there is still a gap with Ethereum’s liquidity pledge rate of over 40%, the addition of Sanctum may make Solana LST more likely to catch up with Ethereum in scale.
Outlook for Q3: Can the five tigers of the protocol expand into the six gentlemen of the ecosystem?
In summary, the Solana ecosystem has seen varying degrees of growth in DeFi, LST, and on-chain activities in the second quarter, but there are still shortcomings in other areas.
NFT trading volume declined in the second quarter, with average daily NFT trading volume down 56% month-on-month to US$3.4 million, and average daily minted NFTs down 70% month-on-month to 858,000.
It is worth noting that at the end of the second quarter, Dialect and the Solana Foundation launched Solana Actions and Blinks, which aim to change the way users interact with the blockchain. It supports users to preview and execute on-chain transactions directly in various digital environments without jumping to web pages, minimizing users links to Web3.
On July 3, 100,000 SEND IT series NFTs minted for free on the X platform using the Blinks function were quickly sold out, and the price has since risen to 0.6 SOL. The nearly 100-fold return rate has made the sale of NFTs on the X platform combined with the Blinks function suddenly popular, and Solana Lianchuang has even become an artificial BOT to cheer for many projects.
Although the popularity has faded in the past few days, it has at least demonstrated the powerful functionality, dissemination and empowerment capabilities of Blinks , which can stir up some waves in the stagnant NFT market. Currently, many Solana projects have created Blinks , including Jupiter, Tensor, Sphere and TipLink.
So in the third quarter of Solana, can Blinks become a new drug to promote development , truly save the NFT market, or push Meme coins to a climax? Or other newer ways to play? Lets wait and see.
This article is sourced from the internet: Solana ecosystem performed well in Q2, decoding the 5 protocols that contributed the most
Related: 2024 Ethereum Staker Report: What issues do independent stakers care about?
Original author: nixo Original translation: TechFlow Summary We surveyed independent operators (often broadly referred to as solo stakers) to better understand their profiles, demographics, pain points, and motivations. We noticed that while respondents were beginning to feel structurally disenfranchised and worried about the pressures of validator centralization, they still had high confidence in validators and resilience. The purpose of this data is to provide the perspectives of a group of very privacy-conscious participants, in their own words, in order to accurately reflect their needs. This survey will be conducted annually and feedback on the question set is welcome. method Collection and distribution Survey results were collected using LimeSurvey software. To ensure questions remain relevant to respondents, branching display logic was used. Cookies were used to prevent duplicate participation and CAPTCHA…


