My XP
0
Login
TRUMP meme coin plummeted 20% on Tuesday, with its market cap falling to around $2.5 billion and trading volume dropping more than 50% over the same period. The sharp decline follows a failed attempt to sustain its rally after the US mật mã strategic reserve announcement, reinforcing bearish sentiment.
With key support at $11, TRUMP risks trading below this level for the first time since its launch if selling pressure continues. However, the upcoming White House Crypto Summit on March 7 could act as a potential catalyst for a rebound, with a breakout above $17.47 potentially sending TRUMP toward $20.7 or even $24.5.
The Relative Strength Index (RSI) for TRUMP has dropped to 40.1, a steep decline from 74.7 just two days ago, reflecting a significant shift in momentum as Donald Trump confirmed tariffs on products from Mexico, Canada, and China.
This rapid fall indicates that TRUMP has moved out of the overbought territory, where bullish pressure was dominant, and is now approaching lower levels that suggest weakening demand.
Given that TRUMP is currently trading very close to its historical lowest levels, the declining RSI suggests that sellers have taken control, and the asset is struggling to regain upward momentum. If the downtrend continues, TRUMP could remain under pressure, potentially testing new lows unless buyers step in to support the price.

RSI is a momentum oscillator that ranges from 0 to 100, with values above 70 indicating overbought conditions and below 30 signaling oversold territory.
When an asset’s RSI drops toward 30, it suggests that selling may be overextended, increasing the probability of a price rebound. At 40.1, TRUMP is still above oversold conditions, but the current downtrend places it in a precarious position.
If RSI continues to fall and breaks below 30, it could signal further downside, potentially driving TRUMP to new historical lows. However, if RSI stabilizes or rebounds from these levels, it may indicate a period of consolidation before any potential recovery.
The BBTrend indicator for TRUMP is currently at -6.18 and has been steadily declining in the last hours since yesterday, signaling increasing bearish momentum.
This drop follows a brief attempt at bullish strength when BBTrend touched 3.25 two days ago, but that move quickly reversed as selling pressure took over.
TRUMP has struggled to build sustained upward momentum. Its highest BBTrend reading in recent weeks was only 12.4 on February 18, followed by a much lower peak of 3.38 on February 25. This pattern suggests that each bullish attempt has been weaker than the previous one, reinforcing the difficulty of maintaining an uptrend.

BBTrend (Bollinger Band Trend) measures trend strength and direction using price volatility within the Bollinger Bands. Positive values indicate growing bullish momentum, while negative values suggest an increasing downtrend.
With BBTrend now at -6.18 and continuing to decline, TRUMP remains in a bearish phase, struggling to find stability.
The consistent failure to sustain positive momentum since mid-February suggests that buyers have been unable to build strength, keeping TRUMP vulnerable to further downside unless the trend reverses soon.
TRUMP, like many other coins, surged following the U.S. crypto strategic reserve announcement, but the rally didn’t last long as it quickly entered a sharp correction.
The TRUMP meme coin is currently down 20% in just one day, erasing much of its recent gains and reinforcing bearish sentiment in the market. A critical support level now sits at $11, and if it is lost, TRUMP could drop below this level for the first time since its launch day.
With such a steep decline in a short period, sellers remain in control, and the price action suggests further downside could be possible if demand does not return soon.
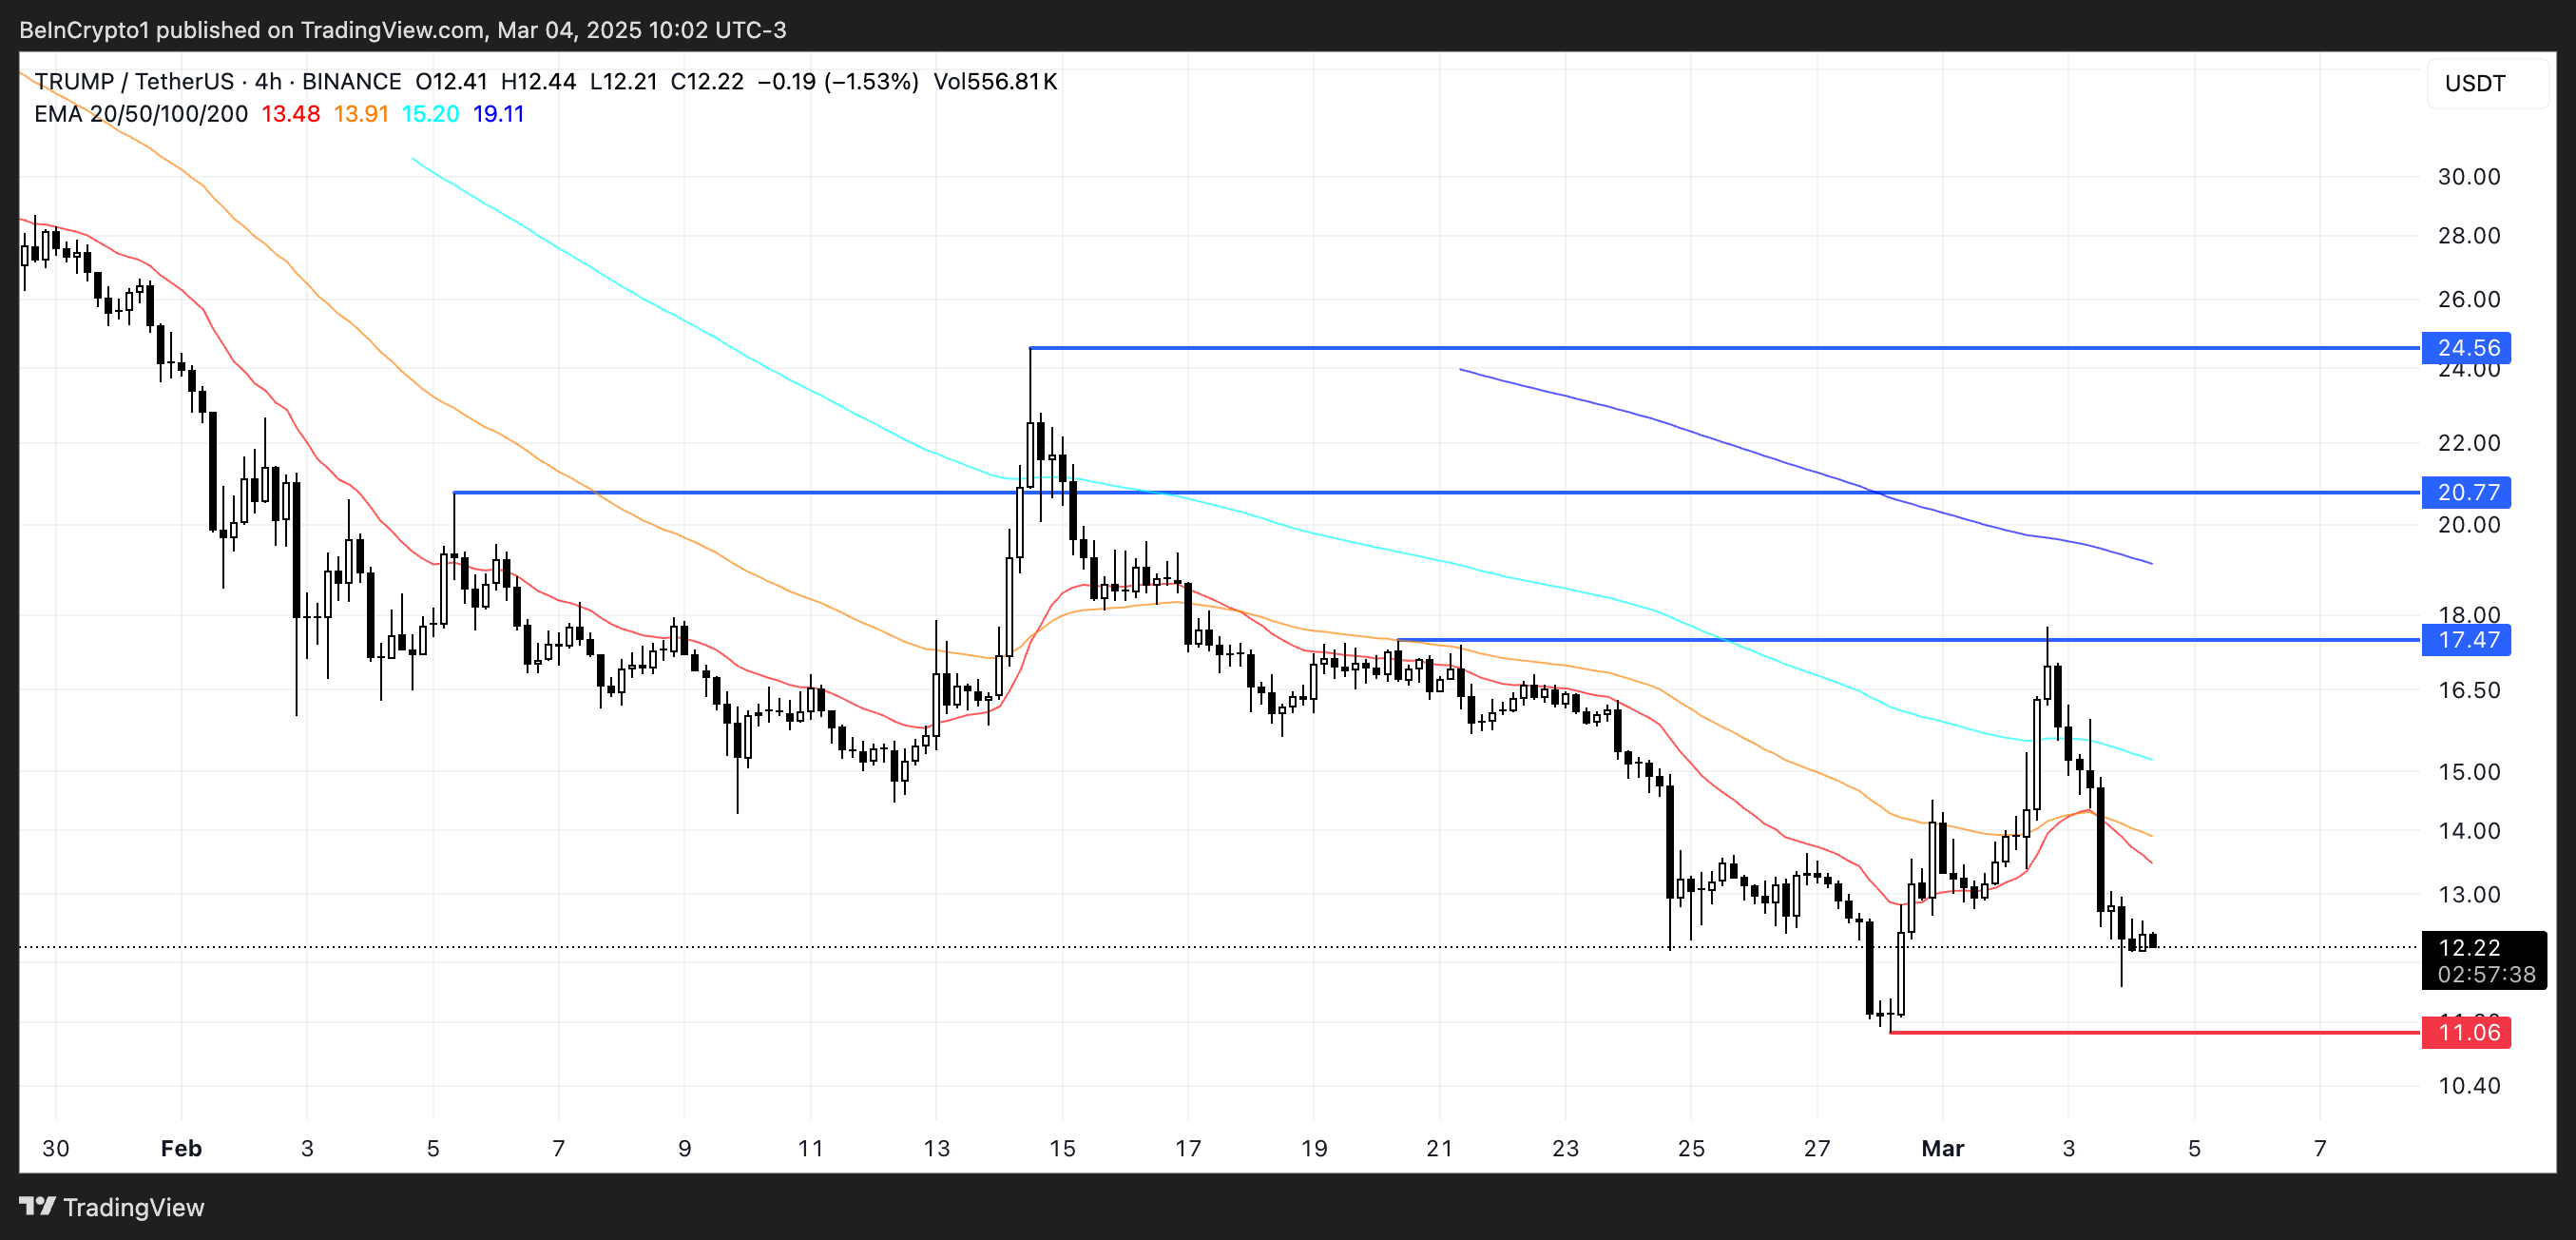
However, TRUMP could find renewed momentum with the upcoming first White House Crypto Summit on March 7, which could serve as a catalyst for a potential recovery.
If an uptrend materializes, the first key level to watch is $17.47. A breakout above this resistance could send it rallying toward $20.7.
If bullish momentum strengthens further, the price could even test $24.5, marking an almost 100% upside from current levels.
Bài viết này được lấy từ internet: TRUMP Drops 20% Following US Tariffs Announcement
Related: BTC Volatility Weekly Review (February 10-17)
Key technical indicators: (February 10, 4pm -> February 17, 4pm Hong Kong time) BTC/USD fell 1.4% (97.5k USD -> 96.15k USD), ETH/USD rose 1.9% (2.64k USD -> 2.69k USD) Spot technical indicators at a glance The market has been very quiet this week, trading in a narrow channel (which was converted from the initial wedge pattern). Support is firmly held below $95.75k, extending to $94-95k; while selling continues to be seen at $98k and above. Given the strong support below, we still think that prices will move out of the current range in the next few trading days. But as realized volatility continues to move deep lower, it may take some time for implied volatility to move into the 40s. Resistance is currently between $98-99k, and higher above $100k; if…


