Task
Ranking
已登录
Bee登录
Twitter 授权
TG 授权
Discord 授权
去签到
下一页
关闭
获取登录状态
My XP
0
Original author: Research institution ASXN
Bản dịch gốc: Felix, PANews
There has been a lot of discussion around long ETH beta trades, with most people believing that with the successful passage of the ETH ETF, ETH will rise again, opening up room for ETH beta to rise. While this is a logical idea, does the data support this view?
Research data from research firm ASXN shows that during the observation period, ETH beta underperformed ETH in absolute terms and after risk adjustment. In addition, all observed tokens, except SOL and ENS, underperformed BTC in relative and risk-adjusted terms. Asset performance varies more across cycles, and altcoins have generally performed poorly in this cycle, making asset selection more important than ever.
prerequisites:
The observation period is from May 1 to July 23, 2024. The odds of ETF approval were revised on May 6, so the ETH ETF transaction has been at the center of market discussions since then.
Past performance is not indicative of future performance.
Asset Selection: Assets have been categorized and price performance has been equally weighted. A few representative altcoins have been selected here, but changing this asset mix could drastically affect the overall results (e.g. adding PEPE).
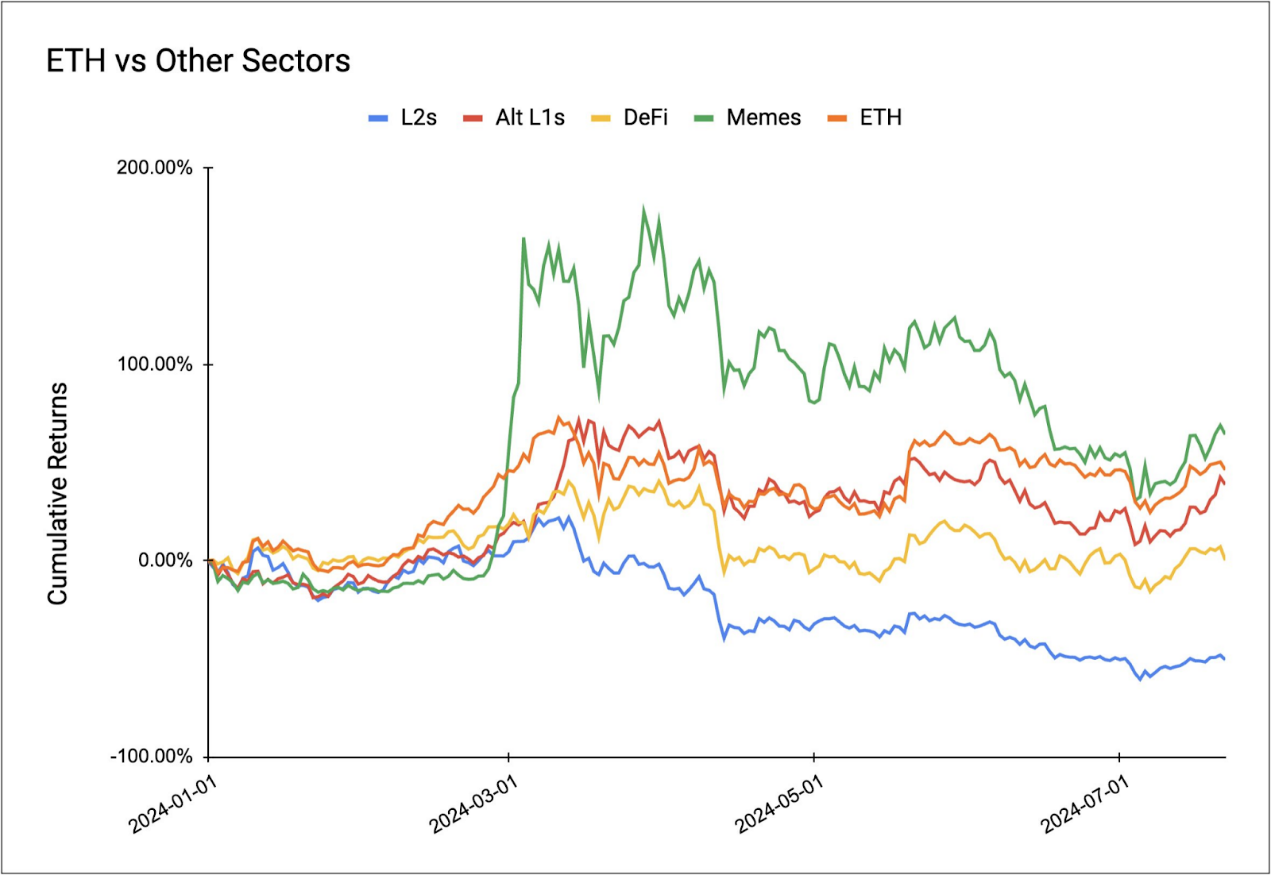
Memecoins are the only sector to outperform ETH so far this year, thanks in large part to the exceptional liquidity created by the memecoin craze, albeit a relatively short-lived one on the Ethereum mainnet. Alt L1, ETH DeFi, and L2 underperform ETH, with L2 performing the worst.

A closer look at the performance of each track and asset during this period shows the same trend: all tracks underperformed ETH, including memecoin. Similar to the situation year-to-date, L2s are the worst performers. Interestingly, ENS performed well, with a return rate of 77%. The top three assets during this period were ENS (+77%), SOL (+32%), and ETH (+15%).
Given their relationship to ETH, L2 and DeFi are more aligned with ETH beta than memecoins or Alt L1s. Diving deeper into the performance of individual assets in the sector, no L2s outperformed ETH during this period. On average, L2s fell 36%, with the gap between the best performing L2 (Matic) and ETH being 40%, a significant difference.

Compared to ETH, DeFi performed slightly better, with an average return of +11.32% during the observation period. However, this performance was mainly boosted by ENS, with the average performance without ENS being -4.33%. Among all L2 and DeFi, the only asset that performed better than ETH was ENS, and AAVE also had a considerable return, only 4% lower than ETH.
The correlation coefficient shows the degree of linear relationship between the observed value and ETH. The correlation coefficient ranges from -1 to 1. The closer the correlation coefficient is to 1, the stronger the positive relationship is. Conversely, the closer it is to -1, the stronger the negative relationship is.
All tokens are positively correlated with ETH, indicating that their prices tend to move in sync with Ethereum. The highest correlations are ARB (0.83), OP (0.8), and SNX (0.8), indicating that these assets have a strong positive correlation with ETH. On the other hand, AEVO has a relatively low correlation (0.4), indicating that AEVO has a weaker relationship with ETH than other assets.
The beta value measures the volatility of observations relative to ETH. Beta is a metric that indicates the sensitivity of an assets price movements relative to a benchmark (in this case, ETH). A beta value of 1 means that the asset moves in line with ETH. A beta greater than 1 indicates that the asset is more volatile than ETH, meaning it tends to amplify ETHs movements. Conversely, a beta less than 1 indicates that the asset is less volatile than ETH.
Most tokens have a Beta value of about 1, indicating a tendency to fluctuate in sync with ETH. Notably, PENDLE has the highest Beta value of 1.5, indicating that its volatility is significantly higher than ETH and tends to amplify ETHs volatility. On the other hand, BNB has a lower Beta value of 0.6, indicating that its volatility is less than ETH and tends to suppress ETHs volatility.
The Sharpe Ratio value provides insight into the risk-adjusted performance of the observed asset relative to ETH. The higher the Sharpe Ratio, the better the risk-adjusted performance. For this calculation, the Dai Savings Rate (DSR) of 7% is used as the risk-free rate.
ENS has the highest Sharpe ratio of 2.45, indicating that it provides the best risk-adjusted returns among the assets analyzed, followed by SOL with a Sharpe ratio of 1.86. On the other hand, STRK has the lowest Sharpe ratio of -3.22, indicating that it performs poorly on a risk-adjusted basis. Only ENS and SOL provide better risk-adjusted returns than ETH (1.24).
Some tokens have negative Sharpe ratios, including OP (-1.58), ARB (-1.35), and MATIC (-1.63). This suggests that their returns do not compensate for the risk taken.
When one evaluates Beta vs ETH, one should also evaluate how these assets compare to BTC, which is an often overlooked metric. In BTC terms, L2s are down 67%, Alt L1s are down 9.2%, DeFi is down 34%, Memes are down 2.4%, and ETH is down 4.4%.
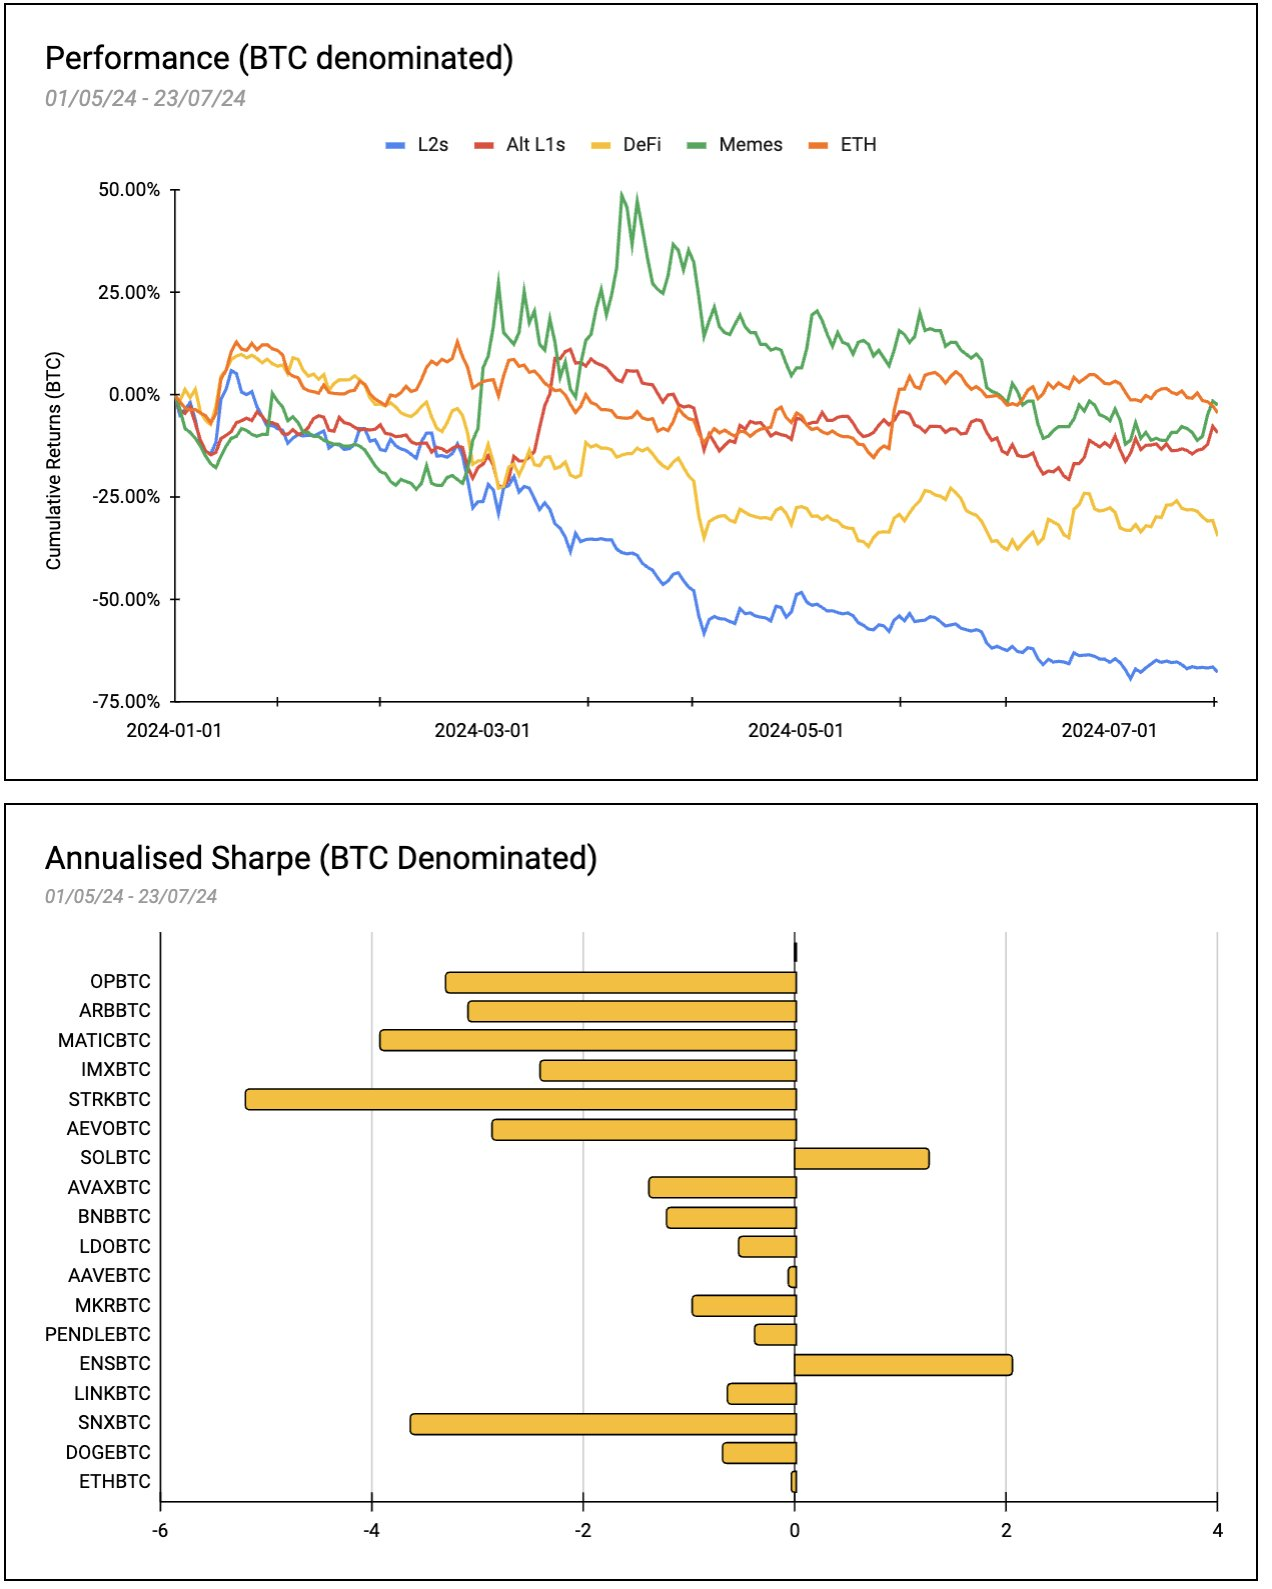
The Sharpe ratios in the above chart provide insight into the risk-adjusted performance of various tokens relative to BTC over the observation period. ENSBTC stands out with an annualized Sharpe ratio of 2.05, followed by SOLBTC with an annualized Sharpe ratio of 1.26 and ETHBTC with a Sharpe ratio of -0.02. All remaining tokens have negative Sharpe ratios and do not provide more positive returns than BTC.
This article is sourced from the internet: ETH Beta earnings review: MEME performed best, but collectively failed to outperform BTC
Next weeks highlights io.net: Daily block rewards for IO Workers will start on June 25th . Blast: The airdrop will start on June 26 ; Blur Season 3 will follow the Blast airdrop on June 26 ; Optimism will launch OP Governance Season 6 on June 27 ; Next Friday, this quarters options will be settled: BTC options with a total of 6.65 billion positions will expire, and ETH options with a total of 3.56 billion positions will expire ; LayerZero CEO: The final list of witches will be announced next week at the latest . From June 24 to June 30, more noteworthy events in the industry are previewed below. June 24 Upbit plans to maintain the staking service system on June 24, which is expected to last for…


