Nghiên cứu 10x: Tại sao chúng tôi bán khống ETH và mua dài BTC
This article comes from: 10 lần Research; original author: Markus Thielen; translated by: Odaily Planet Daily Azuma
Editors note: This article is a compilation of two market analysis articles published by the well-known investment research institution Nghiên cứu 10 lần last night Và this morning . In the first article, Nghiên cứu 10 lần mainly analyzed the reasons for pessimism about the future market of ETH; in the second article, 10 lần Research predicted that BTC is about to reach a new high.
The following is an excerpt of the core content of two articles from Nghiên cứu 10 lần , translated by Odaily Planet Daily.

About ETH: Why are we firmly bearish?
Over the past month, Ethereum’s market cap has grown 22% to $454 billion, while Ethereum’s fee revenue has fallen 33% to just $128 million. Fundamentally, this is because Ethereum has become relatively “insignificant” in terms of transaction activity, and most of the meme activity has moved to Solana or Layer 2 networks, which may not be new to deep value investors.
From a technical analysis point of view, if ETH falls below $3,725, a large number of stop-loss trades may be triggered. ETHs current trend appears very fragile and has failed to rise further. Many newly established long positions have reached or fallen below the break-even point. Cryptocurrency enthusiasts generally call this technical pattern Bart, that is, the price of a certain token needs to be sorted after a sharp rise, at which time the price of the currency may fall sharply due to the triggering of stop-loss trades. All three of our reversal indicators have turned bearish.
Historically, June is ETH’s second worst month, with an average return of just -7% (September was the worst, at -12%), while the average returns of the other ten months were all positive.
In summary, from the perspectives of fundamentals, technical analysis, cycle conventions, etc., now is not the best time to hold ETH. Another evidence of this conclusion is that the positions in the futures market are overstretched (biased towards longs).
-
Odaily Note: In financial market terms, overstretched positions are usually used to describe a phenomenon in the market, that is, there are a large number of positions in a certain direction (long or short) in a certain asset or investment product. When most participants in the market tend to take the same trading direction, overstretched positions implies the risk of being overly biased in this direction.
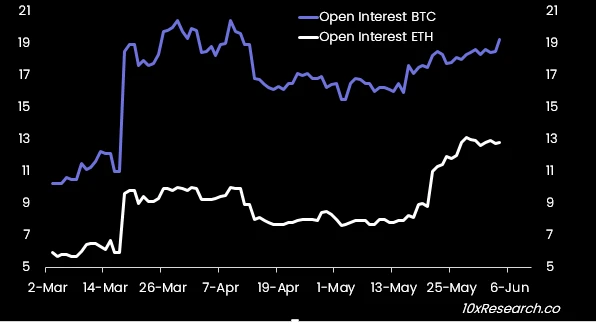
Futures open interest has increased from $8 billion in mid-May to $12.8 billion. Funding rates were over 20% on some days, but have now fallen to 11.9%. As no new longs are being deployed, the cost of holding longs is very expensive. Due to the uncertainty of the timing of ETF approval, more traders may choose to close their positions.

Net inflows to the spot Ethereum ETF may also be disappointing. Similar to the situation with GBTC, we may see 50% ($4-5 billion) of outflows on Grayscales ETHE, while the inflow level of other ETFs may only reach 20% of the BTC ETF ($13.5 billion in five months), or about $2.7 billion. The $2.7 billion in inflows against the $4 billion outflows from ETHE may put pressure on the price of ETH.
For institutions or asset managers, there is no sufficient reason to add ETH to their multi-asset portfolios. ETH is not positioned as digital gold, and its trading volume accounts for only a small part of Bitcoin, which has certain liquidity risks. The current risk-free interest rate of traditional finance is about 5.2%, while the staking income of ETH is only 2.6%. Therefore, there is little incentive for traditional finance to buy ETH ETFs, not to mention that current ETFs do not allow staking.
It is still uncertain when the SEC will finally approve the spot Ethereum ETF (S-1), and US President Biden just vetoed Congresss resolution to overturn SAB-121, reaffirming the governments opposition to cryptocurrencies. ETFs must wait until the S-1 forms are effective before they can begin trading, but the timeline for the SEC to approve these S-1s has not yet been determined (it could be today or in a few months). On the positive impact of the 19 b-4 approval on May 23, ETH jumped from $3,000 to $3,600 and climbed to $3,800 in the following days. Considering that the US government has just conveyed a new message that is not so friendly to crypto (Bidens veto), is this more than 25% increase justified?
We prefer Bitcoin. Even if S-1 is approved, the conversion outflow of ETHE will cause selling pressure on ETH. On the whole, long Bitcoin, short Ethereum and sell Ethereum call options, buy Bitcoin call options may be more winning trading strategies.
For ETH, $3,725 will be an extremely critical point (at this point we will close all long Ethereum positions). If ETH falls below this level, we may see a large number of stop-loss trades being triggered, pushing the price of ETH further down, which may even drag down Bitcoin from setting new highs.
About BTC: Will new highs come?
We have emphasized our bullish reasons for BTC in three reports on May 21, May 26, and May 30.
For traders, now is the time to take risks to get bigger beta. As we predicted, Bitcoin mining related stocks are also rising. Bitdeer rebounded 13% last night, influenced by Tethers $100 million financing (with the possibility of another $50 million), and Bitfarms, one of the major players in the industry, also rebounded.
The US economy is slowing, but that is a good thing right now. GDP growth is just over 1%; the ISM manufacturing index has been in contraction for several months; employment is weakening, which is having a negative impact on consumer spending; and last night there was a significant slowdown in job openings, another key and forward-looking employment indicator. All of this will lead to lower inflation.
We will get more employment data this Friday and the CPI inflation report next week. Bitcoins trend will adjust direction based on the high and low changes of CPI (CPI rises, Bitcoin is bearish; CPI falls, it is bullish), and if the CPI growth rate is 3.3% or lower, it is likely to push Bitcoin to a new historical high.

We turned bullish on May 15th when inflation reached 3.4%, down from 3.5% the previous month, with Bitcoin near $62,000. This price also coincides with our model, which originally predicted that Bitcoin could reach $65,000 on May 16th, turning bullish, and a close above $71,500 (recent price $70,500) would trigger another buy signal.
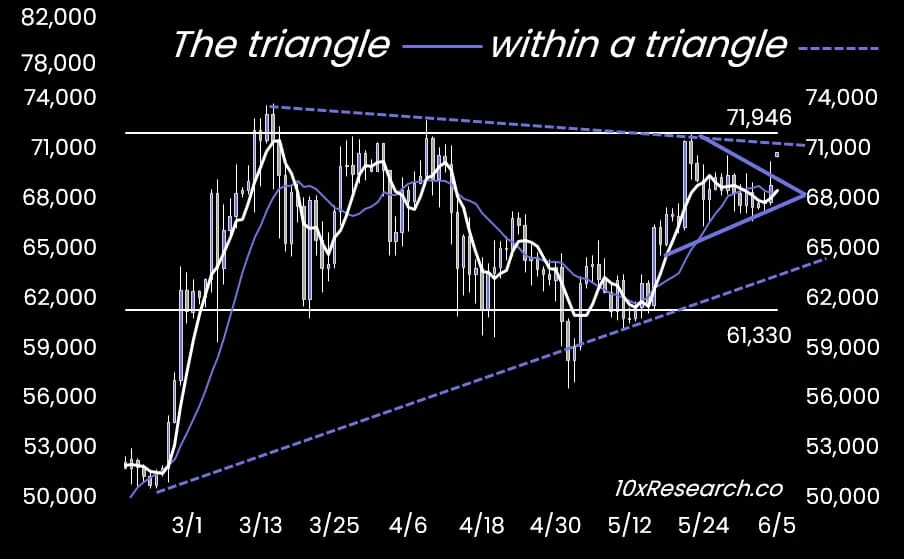
Bitcoin has currently broken through the smaller triangle range (purple line) in the figure below, and the larger triangle range (purple dotted line) may also be broken at around $71,500. If the decline in US employment or the reduction in inflation can make the price of Bitcoin close above this line, we will firmly set the target price at a new high, which may be achieved between this Friday and next Wednesday. Therefore, we expect Bitcoin to hit a new historical high (over $73,500) by the end of next week.

The SEC recently issued a risk warning about cryptocurrencies, a pattern that has previously occurred before the approval of Bitcoin spot ETFs and other SEC-regulated crypto products, which may mean that the S-1 form for the spot Ethereum ETF will be approved soon. Despite this, we still prefer Bitcoin and our positions will return to Bitcoin again.
Since Saturday, additional exposure to Bitcoin futures contracts has increased by $1.6 billion. Last night, Fidelitys spot Bitcoin ETF received $378 million, Arks ETF received $140 million, and BlackRock received $275 million (a total of $880 million in one day), the second highest in history.
The options market expects Bitcoins volatility to be around ± 6.6% by the end of next week, with a target price of $76,000 if it rises. Implied volatility is still relatively expensive at around 52-53%. Building long leverage through perpetual futures or Bitcoin mining companies may be a better strategy.
All in all, Bitcoin may soon hit a new all-time high, and now is the time to take more risk and build a larger position.
This article is sourced from the internet: 10x Research: Why we are short ETH and long BTC
Lần đầu tiên trong năm nay, dữ liệu việc làm thấp hơn dự kiến (không có sự gia tăng bất ngờ), với sự thay đổi việc làm chung là +175.000 (mức tăng trung bình trước đó là khoảng 275.000) và tỷ lệ thất nghiệp cũng bất ngờ tăng từ 3,83% lên 3,87%. Các chỉ số thị trường việc làm có tần suất cao hơn khác cũng bắt đầu cho thấy dấu hiệu chậm lại, chẳng hạn như báo cáo JOLTS gần đây cho thấy tỷ lệ việc làm mở ra so với người thất nghiệp thấp hơn và việc tuyển dụng và nghỉ việc của khu vực tư nhân ở mức thấp nhất trong nhiều năm. Ngoài ra, xu hướng tuyển dụng trong các doanh nghiệp nhỏ đã suy yếu đáng kể, với cả hai thành phần việc làm của ISM và PMI đều cho thấy sự yếu kém và tỷ lệ tuyển dụng của các công ty dịch vụ và sản xuất giảm xuống mức thường thấy trong thời kỳ suy thoái. Thứ sáu tuần trước, chúng tôi đã chỉ ra rằng dữ liệu bảng lương phi nông nghiệp có nhiều khả năng…


