کرپٹو مارکیٹ سینٹیمنٹ ریسرچ رپورٹ (2024.08.23-08.30): اگست کے جھٹکے کی اصلاح، انتظار کرو اور نئے رجحانات دیکھیں
The market fluctuated and corrected in August, and we are waiting to see the new trend of the market
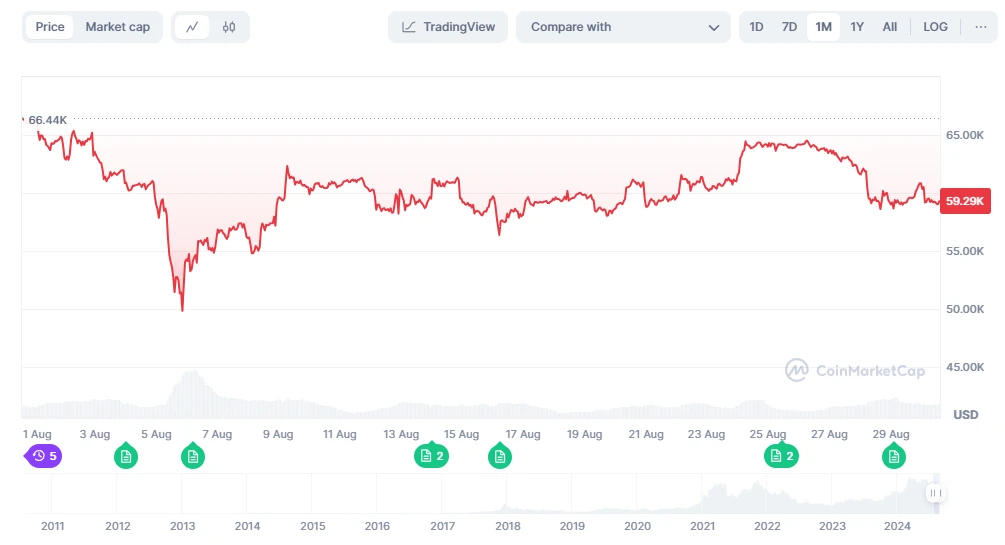
ڈیٹا کا ذریعہ: coinmarketcap
After the release of non-agricultural data in early August, the mainstream currency market experienced a sharp drop in price. Subsequently, the market has repeatedly experienced a trend of rising and falling, and the implied volatility has gradually declined from the highest level on August 5, and the overall market has shown a wide range of fluctuations. The current market urgently needs the guidance of a new round of economic data to promote the development of the next stage of the market.
The market generally expects the Fed to announce a rate cut at its meeting on September 19. However, the new non-farm payrolls data to be released on September 6 will be key. If the data is strong, it will significantly reduce the probability of the Fed cutting interest rates in mid-September. In addition, the PPI and CPI data to be released on September 11 and September 12 will also be closely watched. If these inflation indicators do not show a significant decline, it will also reduce the possibility of the Fed cutting interest rates. Therefore, investors need to pay close attention to the upcoming economic data to judge future market trends.
There are about 19 days until the next Federal Reserve interest rate meeting (September 19, 2024)
https://hk.investing.com/economic-calendar/interest-rate-decision-168
مارکیٹ تکنیکی اور جذباتی ماحول کا تجزیہ
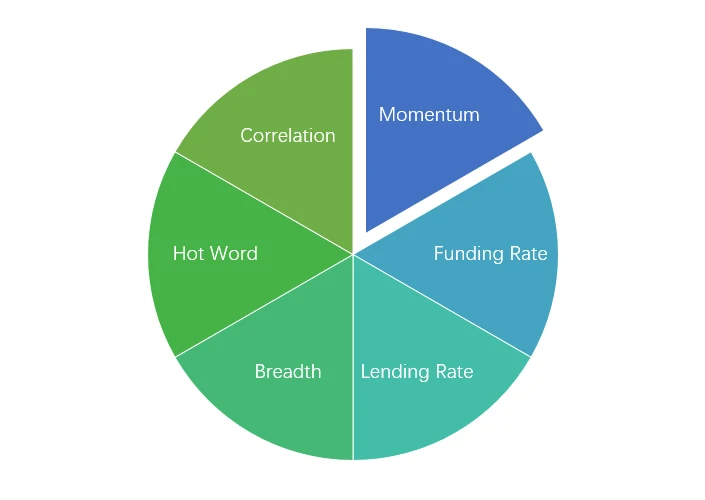
جذباتی تجزیہ کے اجزاء
تکنیکی اشارے
قیمت کے رجحانات
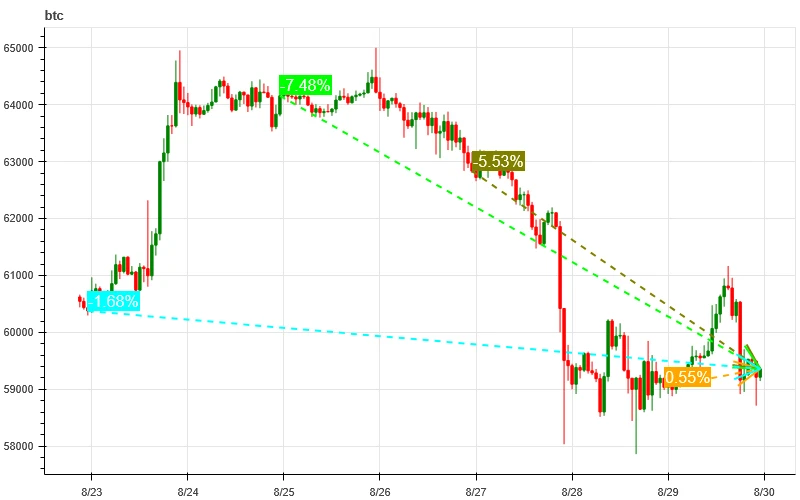
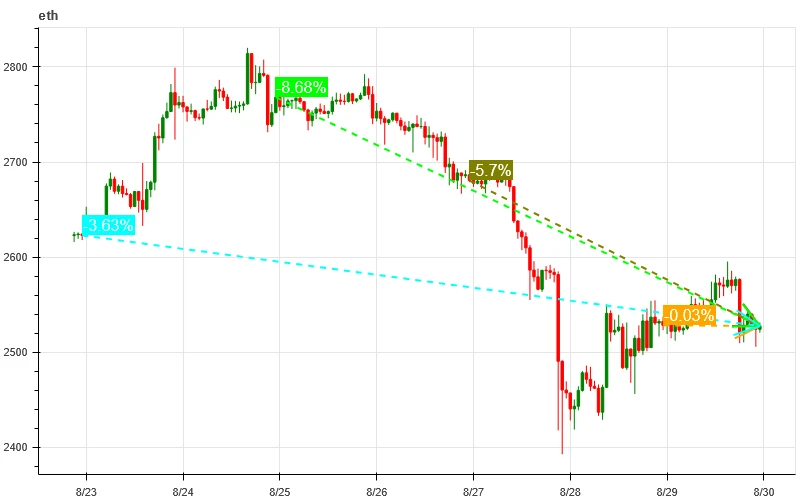
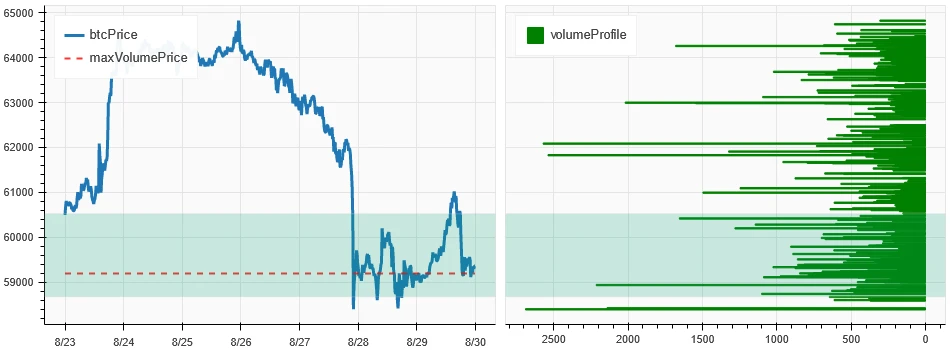
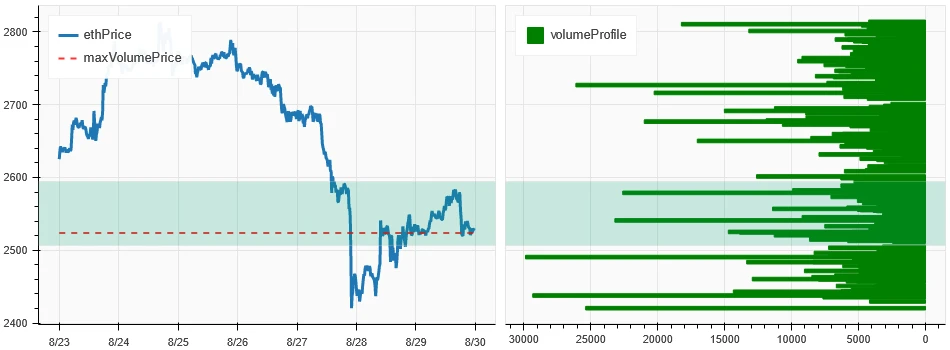
BTC price fell -1.68% and ETH price fell -3.63% over the past week.
مندرجہ بالا تصویر گزشتہ ہفتے میں بی ٹی سی کی قیمت چارٹ ہے.
اوپر کی تصویر گزشتہ ہفتے میں ETH کی قیمت کا چارٹ ہے۔
جدول گزشتہ ہفتے کے دوران قیمت کی تبدیلی کی شرح کو ظاہر کرتا ہے۔
pctChange1Day3Day5Day7Daybtc_pctChange0.55% -5.53% -7.48% -1.68% eth_pctChange-0.03% -5.7% -8.68% -3.63%
قیمت کے حجم کی تقسیم کا چارٹ (سپورٹ اور مزاحمت)
In the past week, both BTC and ETH hit a high point and then fell back to a high-volume trading area.
مندرجہ بالا تصویر گزشتہ ہفتے میں BTCs کے گھنے تجارتی علاقوں کی تقسیم کو ظاہر کرتی ہے۔
مندرجہ بالا تصویر گزشتہ ہفتے میں ETHs کے گھنے تجارتی علاقوں کی تقسیم کو ظاہر کرتی ہے۔
ٹیبل گزشتہ ہفتے میں BTC اور ETH کی ہفتہ وار گہری تجارتی حد کو ظاہر کرتا ہے۔
حجم اور کھلی دلچسپی
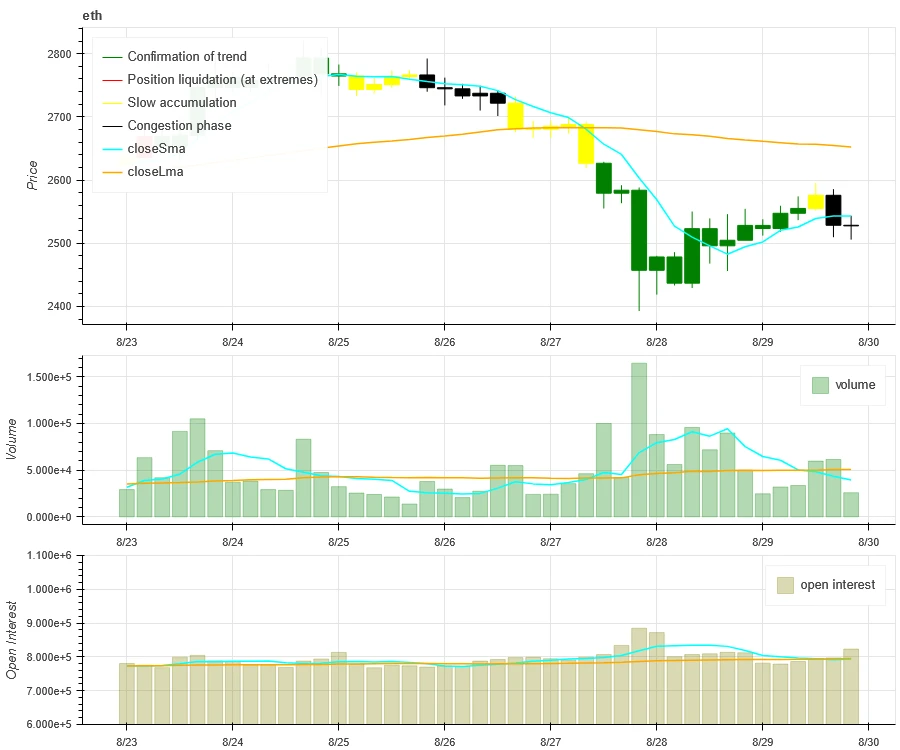
In the past week, the trading volume of BTC and ETH was the largest when they plummeted to 8.27; the open interest of BTC and ETH did not change significantly.
اوپر دی گئی تصویر کا اوپری حصہ BTC کی قیمت کا رجحان دکھاتا ہے، درمیانی حصہ تجارتی حجم دکھاتا ہے، نیچے کھلی دلچسپی ظاہر کرتا ہے، ہلکا نیلا 1 دن کی اوسط، اور نارنجی 7 دن کی اوسط ہے۔ K-لائن کا رنگ موجودہ حالت کی نمائندگی کرتا ہے، سبز کا مطلب ہے قیمت میں اضافے کو تجارتی حجم، سرخ کا مطلب ہے بند ہونے والی پوزیشنز، پیلے کا مطلب ہے آہستہ آہستہ جمع ہونا، اور سیاہ کا مطلب ہے پرہجوم حالت۔
اوپر کی تصویر کا اوپری حصہ ETH کی قیمت کا رجحان دکھاتا ہے، درمیانی حصہ تجارتی حجم، نیچے کھلی دلچسپی، ہلکا نیلا 1 دن کی اوسط، اور نارنجی 7 دن کی اوسط ہے۔ K-لائن کا رنگ موجودہ حالت کی نمائندگی کرتا ہے، سبز کا مطلب ہے کہ قیمتوں میں اضافے کو تجارتی حجم کی حمایت حاصل ہے، سرخ رنگ کی پوزیشنیں بند ہو رہی ہیں، پیلا آہستہ آہستہ پوزیشنیں جمع کر رہا ہے، اور سیاہ ہجوم ہے۔
تاریخی اتار چڑھاؤ بمقابلہ مضمر اتار چڑھاؤ
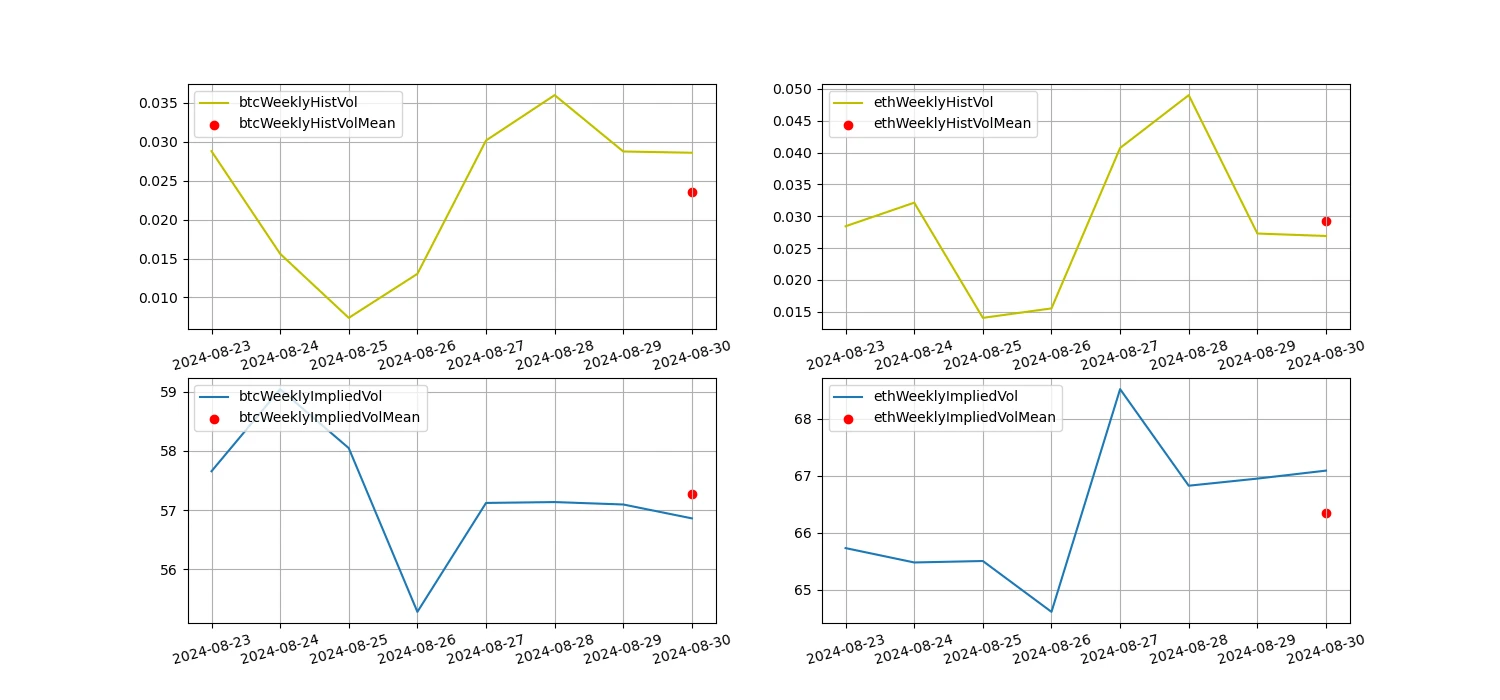
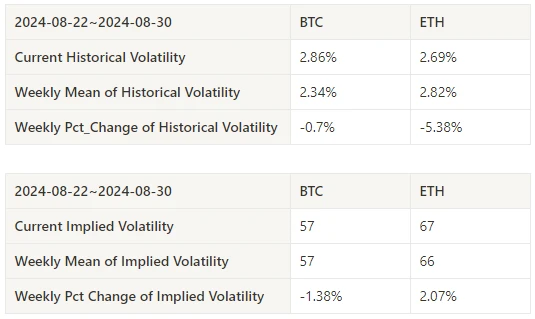
Historical volatility for BTC and ETH was highest this past week at 8.27; implied volatility for BTC fell while ETH rose.
پیلی لکیر تاریخی اتار چڑھاؤ ہے، نیلی لائن مضمر اتار چڑھاؤ ہے، اور سرخ نقطہ اس کی 7 دن کی اوسط ہے۔
واقعہ پر مبنی
No major data was released in the past week, and we are waiting for the release of non-farm data on 09.06.
Emotional indicators
Momentum Sentiment
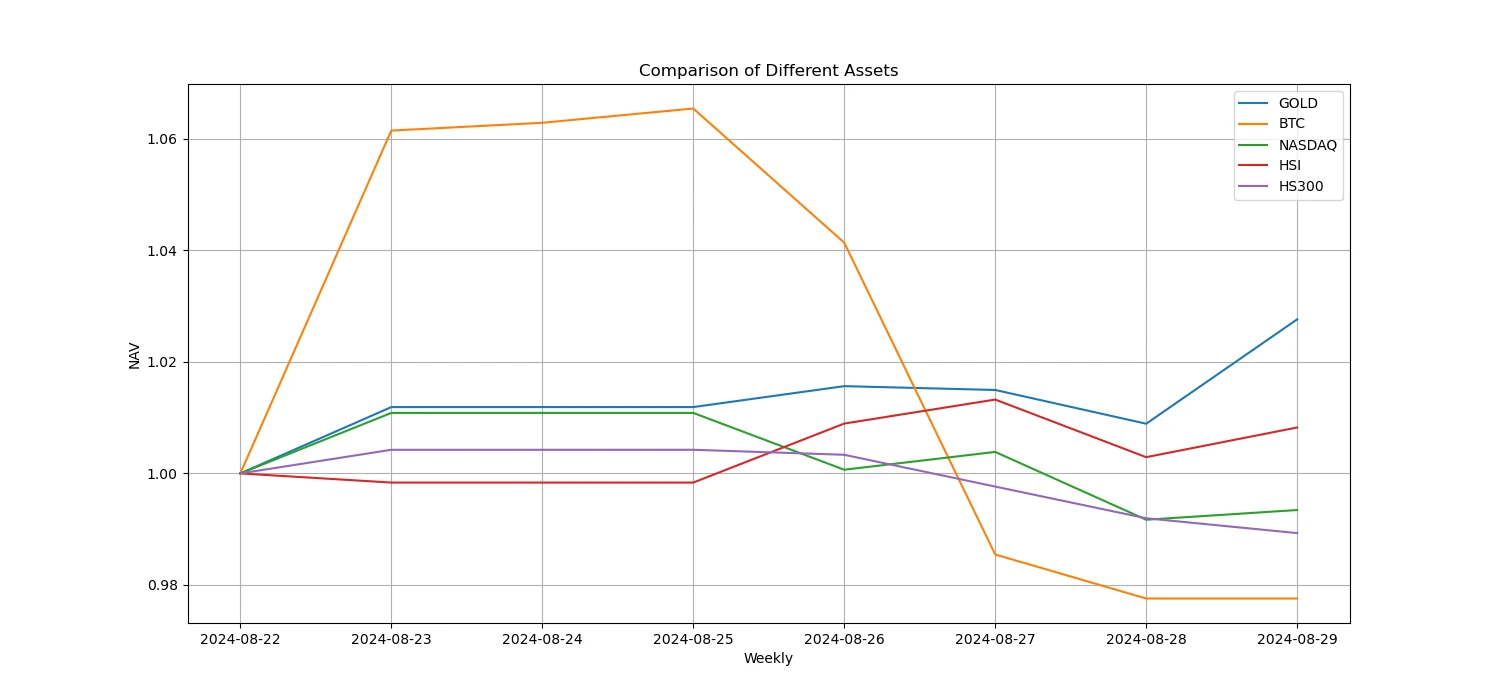
پچھلے ہفتے، Bitcoin/Gold/Nasdaq/Hang Seng Index/SSE 300 کے درمیان، سونا سب سے مضبوط تھا، جبکہ Bitcoin نے بدترین کارکردگی کا مظاہرہ کیا۔
مندرجہ بالا تصویر پچھلے ہفتے میں مختلف اثاثوں کے رجحان کو ظاہر کرتی ہے۔
قرضے کی شرح_قرضے کا جذبہ
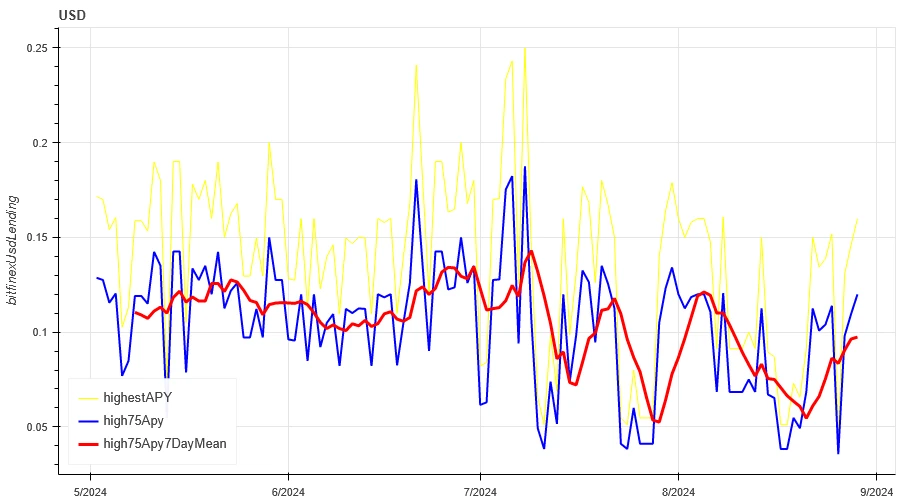
The average annualized return on USD lending over the past week was 9.9%, and short-term interest rates rose to 12%.
پیلی لکیر USD شرح سود کی سب سے زیادہ قیمت ہے، نیلی لائن سب سے زیادہ قیمت کی 75% ہے، اور سرخ لکیر سب سے زیادہ قیمت کی 75% کی 7 دن کی اوسط ہے۔
جدول ماضی میں مختلف ہولڈنگ دنوں میں USD کی شرح سود کے اوسط منافع کو ظاہر کرتا ہے۔
فنڈنگ ریٹ_کنٹریکٹ لیوریج کا جذبہ
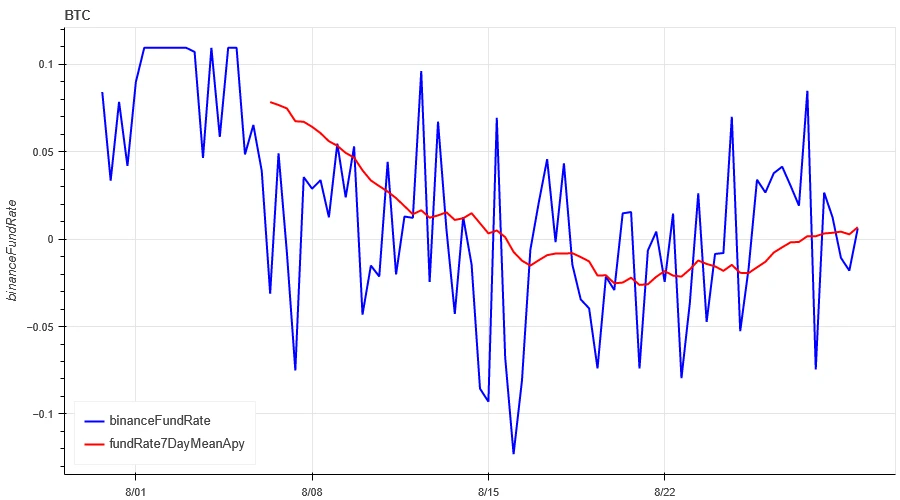
The average annualized return on BTC fees in the past week was 0.3%, and contract leverage sentiment remained low.
بلیو لائن بائننس پر BTC کی فنڈنگ کی شرح ہے، اور سرخ لکیر اس کی 7 دن کی اوسط ہے
جدول ماضی میں مختلف انعقاد کے دنوں کے لیے BTC فیس کی اوسط واپسی کو ظاہر کرتا ہے۔
مارکیٹ کا ارتباط_اتفاق رائے
The correlation among the 129 coins selected in the past week was around 0.8, and the consistency between different varieties was high.
اوپر کی تصویر میں، نیلی لائن بٹ کوائن کی قیمت ہے، اور سبز لائن ہے [1000 floki, 1000 lunc, 1000 pepe, 1000 shib, 100 0x ec, 1inch, aave, ada, agix, algo, ankr, ant, Ape، apt، arb، ar، astr، ایٹم، آڈیو، avax، axs bal, band, bat, bch, bigtime, blur, bnb, btc, celo, cfx, chz, ckb, comp, cv, cvx, cyber, dash, doge, dot, dydx, egld, enj, ens, eos, etc ایتھ، فیٹ، فل، فلو، ایف ٹی ایم، ایف ایکس ایس، گالا، جی ایم ٹی، جی ایم ایکس، grt, hbar, hot, icp, icx, imx, inj, iost, iotx, jasmy, kava, klay, ksm, ldo, link, loom, lpt, lqty, lrc, ltc, luna 2, magic, mana, matic, meme , mina, mkr, near, neo, ocean, one, ont, op, pendle qnt, qtum, rndr, rose, rune, rvn, sand, sei, sfp, skl, snx, sol, ssv, stg, storj, stx, sui, sushi, sxp, theta, tia, trx, t, uma, uni vet, waves, wld, woo, xem, xlm, xmr, xrp, xtz، yfi، zec، zen، zil، zrx] مجموعی ارتباط
مارکیٹ کی وسعت_مجموعی جذبات
Among the 129 coins selected in the past week, 41% of the coins were priced above the 30-day moving average, 48% of the coins were priced above the 30-day moving average relative to BTC, 18% of the coins were more than 20% away from the lowest price in the past 30 days, and 10% of the coins were less than 10% away from the highest price in the past 30 days. The market breadth indicator in the past week showed that most coins in the overall market returned to a downward trend.
اوپر کی تصویر یہ ہے [bnb, btc, sol, eth, 1000 floki, 1000 lunc, 1000 pepe, 1000 sats, 1000 shib, 100 0x ec, 1inch, aave, ada, agix, ai, algo, alt, anpekr apt، arb، ar، astr، ایٹم، avax، axs، bal، band، bat، bch، bigtime، blur، cake، celo، cfx، chz، ckb، comp، cv، cvx، سائبر، ڈیش، ڈوج، ڈاٹ، dydx، egld، enj، ens، eos وغیرہ، فیٹ، فل، فلو، ایف ٹی ایم، ایف ایکس ایس، گالا، جی ایم ٹی، جی ایم ایکس، grt, hbar, hot, icp, icx, idu, imx, inj, iost, iotx, jasmy, jto, jup, kava, klay, ksm, ldo, link, loom, lpt, lqty, lrc, ltc, luna 2, magic ، من، مانتا، ماسک، میٹک، میمی، مینا، ایم کے آر، قریب، نو، nfp, ocean, one, ont, op, ordi, pendle, pyth, qnt, qtum, rndr, robin, rose, run, rvn, sand, sei, sfp, skl, snx, ssv, stg, storj, stx, sui, سشی، ایس ایکس پی، تھیٹا، ٹیا، ٹی آر ایکس، ٹی، اوما، یونی، vet, waves, wif, wld, woo, xai, xem, xlm, xmr, xrp, xtz, yfi, zec, zen, zil, zrx ] ہر چوڑائی کے اشارے کا 30 دن کا تناسب
خلاصہ کریں۔
In the past week, the prices of Bitcoin (BTC) and Ethereum (ETH) fell by -1.68% and -3.63% after a short-term surge. After a short-term surge, the prices of both fell back to a low-level dense trading area. On August 27, the prices of both fell sharply, and the trading volume on that day reached a peak, while the open interest did not change significantly. In terms of volatility, the historical volatility reached its highest point on the decline on August 27, however, the implied volatility performance was differentiated: BTC implied volatility fell, while ETH rose. In the performance comparison of different assets, gold was the strongest among Bitcoin, Nasdaq, Hang Seng Index and CSI 300, while Bitcoin performed the weakest. The average annualized yield of USD lending is 9.9%. The average annualized return of BTC funding rate is 0.3%, indicating that the leverage sentiment of the contract is still low. The correlation between the selected 129 currencies remains around 0.8, showing a high consistency between different varieties. Market breadth indicators show that most cryptocurrencies in the overall market have returned to a downward trend.
ٹویٹر: @ https://x.com/CTA_ChannelCmt
ویب سائٹ: channelcmt.com
This article is sourced from the internet: Crypto Market Sentiment Research Report (2024.08.23-08.30): August shock correction, wait-and-see new trends
Related: Interpreting the new proposal ACP-77, how to unlock Avalanche L1?
Original author: Eden Au , The Block Original translation: Felix, PANews Key points: ACP-77 is a community proposal that will change the validator dynamics for Avalanche L1 (formerly known as subnets). Avalanche L1 validators will no longer need to validate the main network and stake at least 2,000 AVAX. Instead, they will follow the requirements set by the sovereign Avalanche L1. Avalanche L1 validators will pay an ongoing dynamic fee to register information on the P-Chain. The proposal benefits both institutional and retail Avalanche L1 as regulatory compliance and low barriers to entry for validators can be achieved. Avalanche has long been a proponent of horizontal scaling using “subnets,” which are now being rebranded as Avalanche Layer 1 (L1). Avalanche L1s are sovereign, often application-specific blockchains that can be individually…
