Crypto Market Sentiment Research Report (2024.06.21-06.28): SOL میں 7% اضافہ ہوا، VanEck نے سولانا ٹرسٹ فنڈ کی درخواست جمع کرائی
SOL rises 7%, VanEck submits Solana Trust fund application
June 28, 2024 Solana cryptocurrency price surged nearly 10% after multiple sources provided verified information about VanEck (VanEck Solana Trust) application for Solana-based spot ETF. VanEck is an asset management company with more than $89 billion in assets under management. This is the first such application filed with the U.S. Securities and Exchange Commission (SEC). Solana immediately rose after the news about the spot ETF application, but soon encountered some resistance and profit-taking. Bitcoin reacted to the news by jumping nearly $1,400 from $60,800 to $62,200, but the price is currently below $62,000 again.
There are about 31 days until the next Federal Reserve interest rate meeting (2024.08.01)
https://hk.investing.com/economic-calendar/interest-rate-decision-168
مارکیٹ تکنیکی اور جذباتی ماحول کا تجزیہ
جذباتی تجزیہ کے اجزاء
تکنیکی اشارے
قیمت کا رجحان
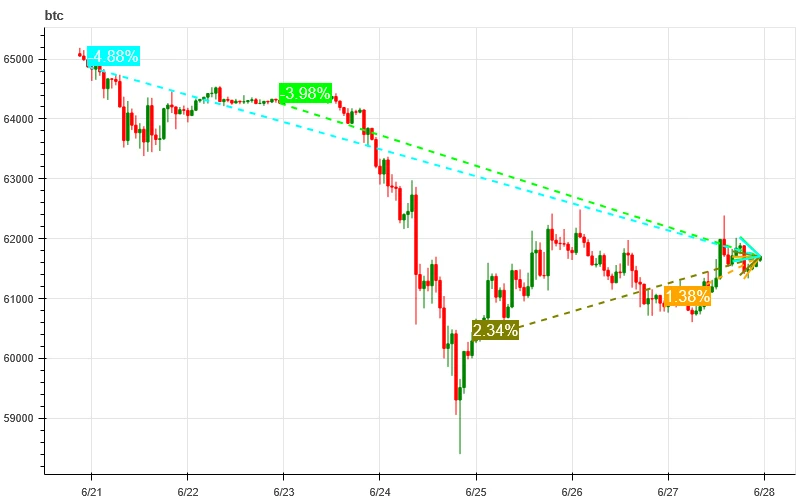
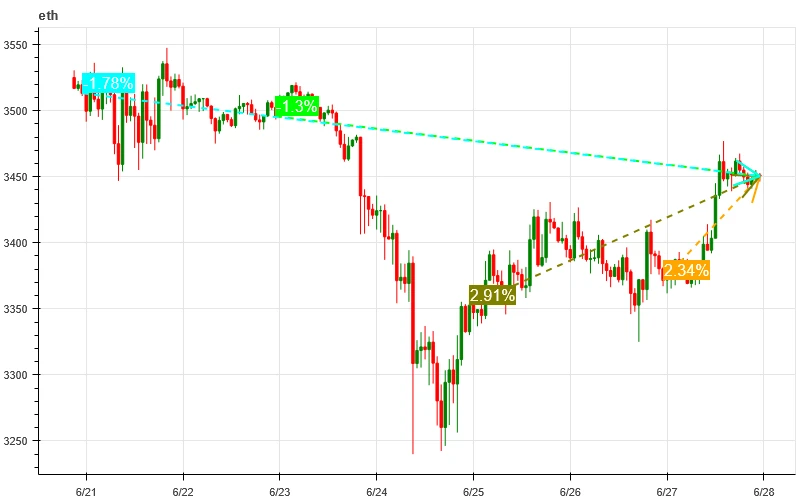
BTC price fell -4.88% and ETH price fell -1.78% in the past week.
مندرجہ بالا تصویر گزشتہ ہفتے میں بی ٹی سی کی قیمت چارٹ ہے.
اوپر کی تصویر گزشتہ ہفتے میں ETH کی قیمت کا چارٹ ہے۔
جدول گزشتہ ہفتے کے دوران قیمت کی تبدیلی کی شرح کو ظاہر کرتا ہے۔
قیمت کے حجم کی تقسیم کا چارٹ (سپورٹ اور مزاحمت)
In the past week, BTC and ETH fell to 6.24 and formed a dense trading area at a low level before fluctuating widely.
مندرجہ بالا تصویر گزشتہ ہفتے میں BTCs کے گھنے تجارتی علاقوں کی تقسیم کو ظاہر کرتی ہے۔
مندرجہ بالا تصویر گزشتہ ہفتے میں ETHs کے گھنے تجارتی علاقوں کی تقسیم کو ظاہر کرتی ہے۔
ٹیبل گزشتہ ہفتے میں BTC اور ETH کی ہفتہ وار گہری تجارتی حد کو ظاہر کرتا ہے۔
حجم اور کھلی دلچسپی
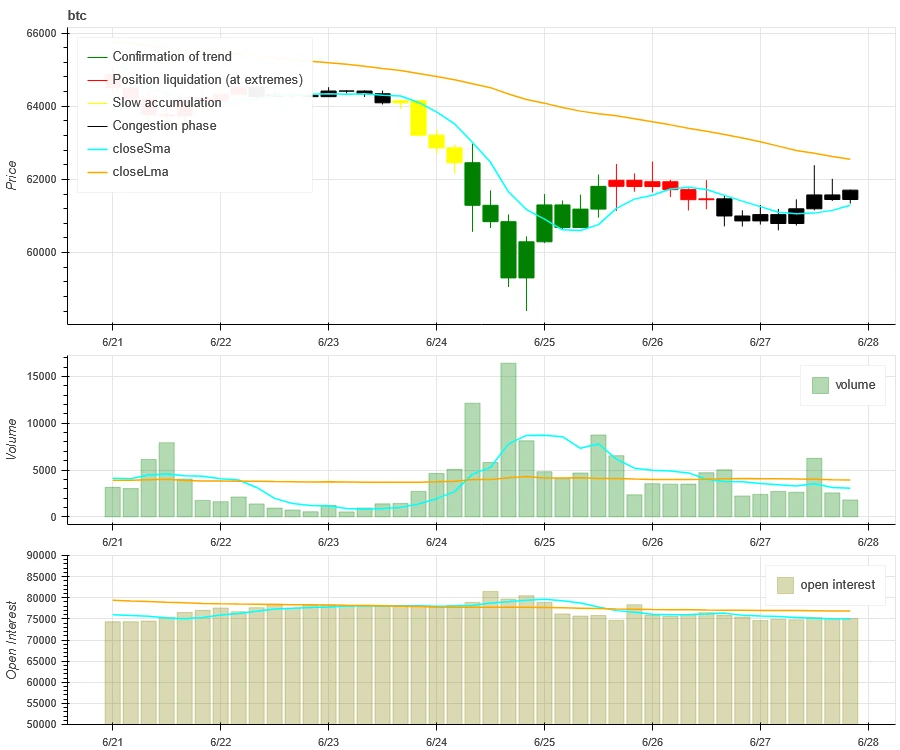
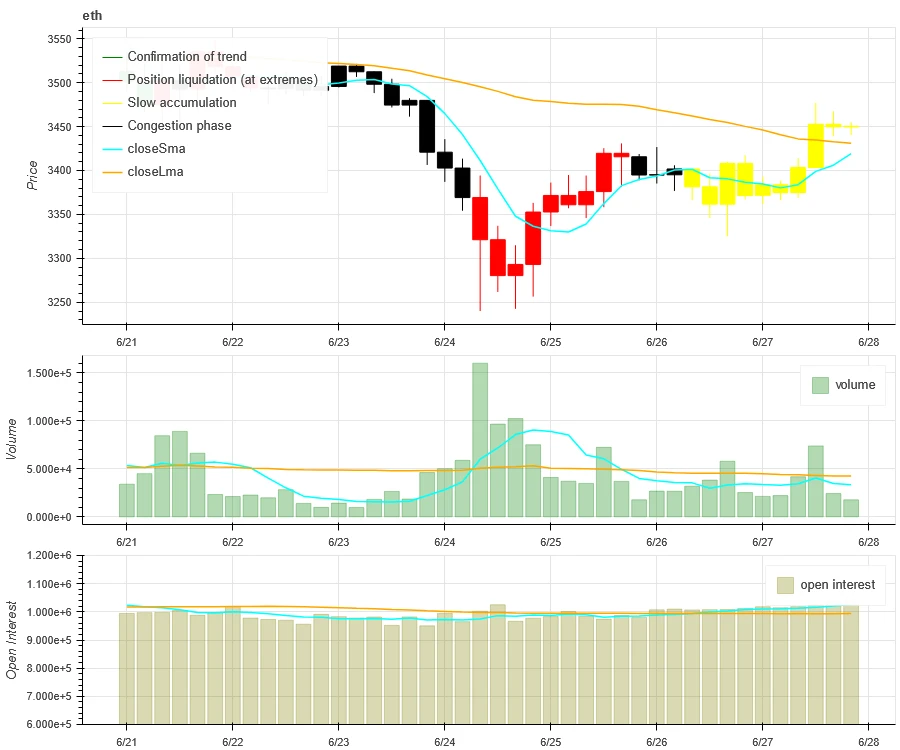
BTC and ETH had the largest trading volume this past week when they fell on June 24; open interest for both BTC and ETH rose slightly.
اوپر دی گئی تصویر کا اوپری حصہ BTC کی قیمت کا رجحان دکھاتا ہے، درمیانی حصہ تجارتی حجم دکھاتا ہے، نیچے کھلی دلچسپی ظاہر کرتا ہے، ہلکا نیلا 1 دن کی اوسط، اور نارنجی 7 دن کی اوسط ہے۔ K-لائن کا رنگ موجودہ حالت کی نمائندگی کرتا ہے، سبز کا مطلب ہے قیمت میں اضافے کو تجارتی حجم، سرخ کا مطلب ہے بند ہونے والی پوزیشنز، پیلے کا مطلب ہے آہستہ آہستہ جمع ہونا، اور سیاہ کا مطلب ہے پرہجوم حالت۔
اوپر کی تصویر کا اوپری حصہ ETH کی قیمت کا رجحان دکھاتا ہے، درمیانی حصہ تجارتی حجم، نیچے کھلی دلچسپی، ہلکا نیلا 1 دن کی اوسط، اور نارنجی 7 دن کی اوسط ہے۔ K-لائن کا رنگ موجودہ حالت کی نمائندگی کرتا ہے، سبز کا مطلب ہے کہ قیمتوں میں اضافے کو تجارتی حجم کی حمایت حاصل ہے، سرخ رنگ کی پوزیشنیں بند ہو رہی ہیں، پیلا آہستہ آہستہ پوزیشنیں جمع کر رہا ہے، اور سیاہ ہجوم ہے۔
تاریخی اتار چڑھاؤ بمقابلہ مضمر اتار چڑھاؤ
In the past week, historical volatility of BTC and ETH was highest at 6.24; implied volatility of BTC rose slightly while ETH fell slightly.
The yellow line is the historical volatility, the blue line is the implied volatility, and the red dot is its 7-day average.
واقعہ پر مبنی
No data was released in the past week.
جذبات کے اشارے
Momentum Sentiment
پچھلے ہفتے، Bitcoin/Gold/Nasdaq/Hang Seng Index/SSE 300 میں، Nasdaq سب سے مضبوط تھا، جبکہ Bitcoin نے بدترین کارکردگی کا مظاہرہ کیا۔
مندرجہ بالا تصویر پچھلے ہفتے میں مختلف اثاثوں کے رجحان کو ظاہر کرتی ہے۔
قرضے کی شرح_قرضے کا جذبہ
Over the past week, the average annualized return on USD lending was 13.3%, and short-term interest rates remained around 12.4%.
پیلی لکیر USD شرح سود کی سب سے زیادہ قیمت ہے، نیلی لائن سب سے زیادہ قیمت کی 75% ہے، اور سرخ لکیر سب سے زیادہ قیمت کی 75% کی 7 دن کی اوسط ہے۔
جدول ماضی میں مختلف ہولڈنگ دنوں کے لیے USD کی شرح سود کا اوسط ریٹرن دکھاتا ہے۔
فنڈنگ ریٹ_کنٹریکٹ لیوریج کا جذبہ
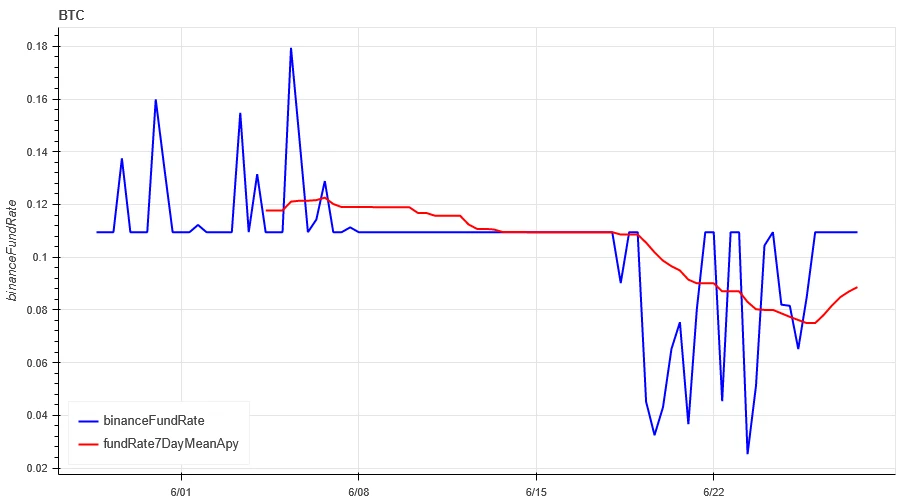
The average annualized return on BTC fees in the past week was 8.8%, and contract leverage sentiment remained at a low level.
بلیو لائن بائننس پر BTC کی فنڈنگ کی شرح ہے، اور سرخ لکیر اس کی 7 دن کی اوسط ہے
جدول ماضی میں مختلف انعقاد کے دنوں کے لیے BTC فیس کی اوسط واپسی کو ظاہر کرتا ہے۔
مارکیٹ کا ارتباط_اتفاق رائے
The correlation among the 129 coins selected in the past week dropped to around 0.45, and the consistency between different varieties dropped significantly.
In the above picture, the blue line is the price of Bitcoin, and the green line is [1000 floki, 1000 lunc, 1000 pepe, 1000 shib, 100 0x ec, 1inch, aave, ada, agix, algo, ankr, ant, ape, apt, arb, ar, astr, atom, audio, avax, axs, bal, band, bat, bch, bigtime, blur, bnb, btc, celo, cfx, chz, ckb, comp, crv, cvx, cyber, dash, doge, dot, dydx, egld, enj, ens, eos,etc, eth, fet, fil, flow, ftm, fxs, gala, gmt, gmx, grt, hbar, hot, icp, icx, imx, inj, iost, iotx, jasmy, kava, klay, ksm, ldo, link, loom, lpt, lqty, lrc, ltc, luna 2, magic, mana, matic, meme, mina, mkr, near, neo, ocean, one, ont, op, pendle, qnt, qtum, rndr, rose, rune, rvn, sand, sei, sfp, skl, snx, sol, ssv, stg, storj, stx, sui, sushi, sxp, theta, tia, trx, t, uma, uni, vet, waves, wld, woo, xem, xlm, xmr, xrp, xtz, yfi, zec, zen, zil, zrx] overall correlation
مارکیٹ کی وسعت_مجموعی جذبات
Among the 129 coins selected in the past week, 5.5% of the coins were priced above the 30-day moving average, 25% of the coins were priced above the 30-day moving average relative to BTC, 4% of the coins were more than 20% away from the lowest price in the past 30 days, and 6.3% of the coins were less than 10% away from the highest price in the past 30 days. The market breadth indicator in the past week showed that most coins in the overall market continued to fall.
مندرجہ بالا تصویر دکھاتی ہے [bnb, btc, sol, eth, 1000 floki, 1000 lunc, 1000 pepe, 1000 sats, 1000 shib, 100 0x ec, 1inch, aave, ada, agix, ai, algo, alt, an apt، arb، ar، astr، atom، avax، axs، bal، band، bat، bch، bigtime، blur، cake، celo، cfx، chz، ckb، comp، cv، cvx، سائبر، ڈیش، ڈوج، ڈاٹ dydx, egld, enj, ens, eos, etc, fet, fil, flow, ftm, fxs, gala, gmt, gmx, grt, hbar, hot, icp, icx, idu, imx, inj, iost, iotx, jasmy jto, jup, kava, klay, ksm, ldo, link, loom, lpt, lqty, lrc, ltc, luna 2, Magic, Mana, Manta, mask, matic, meme, mina, mkr, near, neo, nfp, ocean , one, ont, op, ordi, pendle, pyth, qnt, qtum, rndr, robin, rose, rune, rvn, sand, sei, sfp, skl, snx, ssv, stg, storj, stx, sui, sushi, sxp , theta, tia, trx, t, uma, uni, vet, waves, wif, wld, woo, xai, xem, xlm, xmr, xrp, xtz, yfi, zec, zen, zil, zrx] کا 30 دن کا تناسب ہر چوڑائی اشارے
خلاصہ کریں۔
Over the past week, Bitcoin (BTC) and Ethereum (ETH) prices have experienced wide range fluctuations after the decline, while the volatility and trading volume of these two cryptocurrencies reached the highest level during the decline on June 24. The open interest of Bitcoin and Ethereum has increased slightly. In addition, the implied volatility of Bitcoin has increased slightly, while the implied volatility of Ethereum has decreased slightly. The funding rate of Bitcoin has remained at a low level, which may reflect the continued low leverage sentiment of market participants towards Bitcoin. The market breadth indicator shows that most cryptocurrencies continue to fall, indicating that the overall market has maintained a weak trend over the past week.
ٹویٹر: @ https://x.com/CTA_ChannelCmt
ویب سائٹ: channelcmt.com
This article is sourced from the internet: Crypto Market Sentiment Research Report (2024.06.21-06.28): SOL rose 7%, VanEck submitted Solana Trust Fund application
Hong Kong Virtual Asset Spot ETF On April 30, a total of 6 virtual asset spot ETFs under Bosera HashKey, China Asset Management and Harvest Asset Management officially rang the bell and were listed on the Hong Kong Stock Exchange and opened for trading, including Bosera HashKey Bitcoin ETF (3008.HK), Bosera HashKey Ethereum ETF (3009.HK), China Asset Management Bitcoin ETF (3042.HK), China Asset Management Ethereum ETF (3046.HK), Harvest Bitcoin Spot ETF (3439.HK) and Harvest Ethereum Spot ETF (3179.HK). Li Yimei, CEO of China Asset Management, said in an interview with Bloomberg TV that the launch of Hong Kong spot Bitcoin and Ethereum ETFs opens the door for many RMB holders to seek alternative investments. As the opening-up develops, hopefully there will be new opportunities for mainland Chinese investors to participate…
