Kripto Piyasası Duygu Araştırma Raporu (2024.08.16–08.23): Bitcoin, yaklaşan faiz indirimine karşı ılımlı bir tutum sergilerken yükseliyor
Bitcoin rises as dovish stance turns to imminent rate cut
At 10 a.m. Eastern Time on Friday, August 23, Federal Reserve Chairman Powell made an important speech at the Jackson Hole Global Central Bank Annual Meeting.
**It is worth noting that Powell stated quite clearly: The time for policy adjustment has come. The policy direction is clear, and the timing and pace of interest rate cuts will depend on subsequent data, changes in the outlook and the balance of risks.
Some analysts said that although Powell confirmed the markets widespread expectation of starting interest rate cuts in September, this speech was also dovish, providing a certain clarity to the financial market in the short term, but did not provide many clues about how the Fed will act after the September meeting.
For example, if there is another negative employment report, whether there will be a sharp 50 basis point rate cut, and whether rate cuts will continue in the coming months. However, Powells speech at least confirmed that the Feds fight against inflation over the past two years is about to reach a critical turning point.
After the annual meeting, Bitcoin rose from US$61,000 to a high of US$65,000, an increase of 6.5%.
There are about 26 days until the next Federal Reserve interest rate meeting (September 19, 2024)
https://hk.investing.com/economic-calendar/interest-rate-decision-168
Piyasa teknik ve duyarlılık ortamı analizi
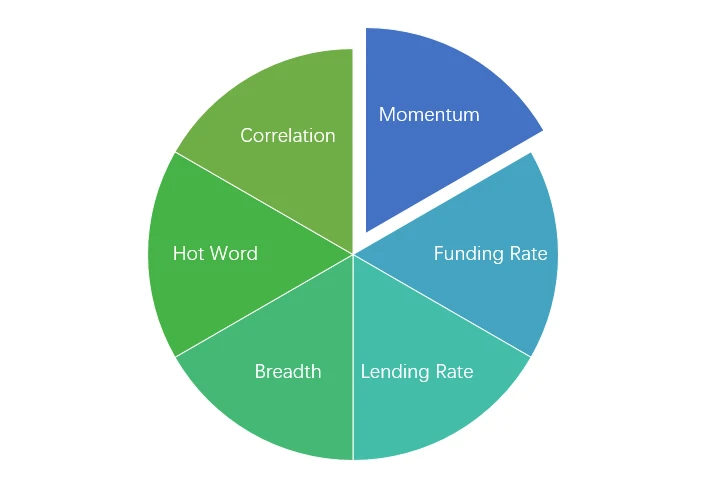
Duygu Analizi Bileşenleri
Teknik göstergeler
Price Trends
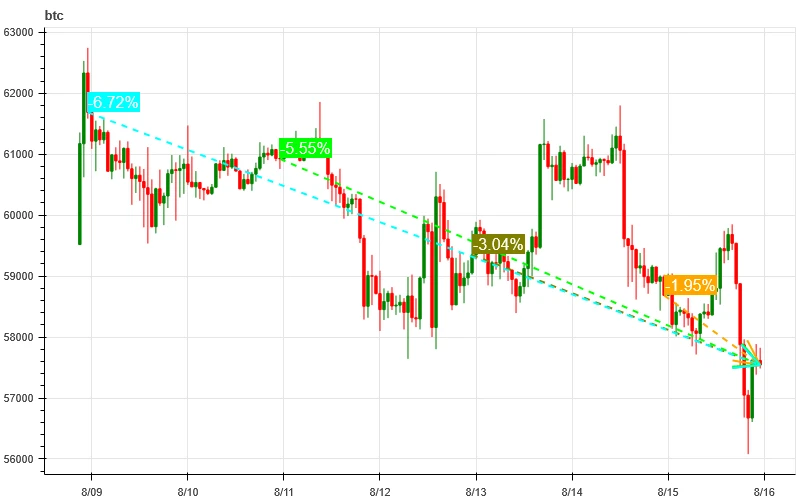
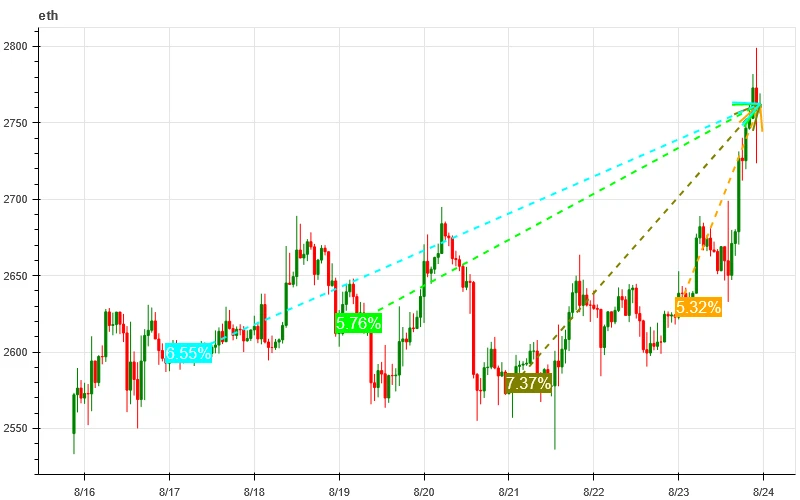
In the past week, BTC prices rose 8.77% and ETH prices rose 6.55%.
Yukarıdaki resim BTC'nin geçen haftaki fiyat tablosudur.
Yukarıdaki resim ETH'nin geçen haftaki fiyat tablosudur.
Tabloda geçtiğimiz haftadaki fiyat değişim oranları gösterilmektedir.
Fiyat Hacim Dağılım Grafiği (Destek ve Direnç)
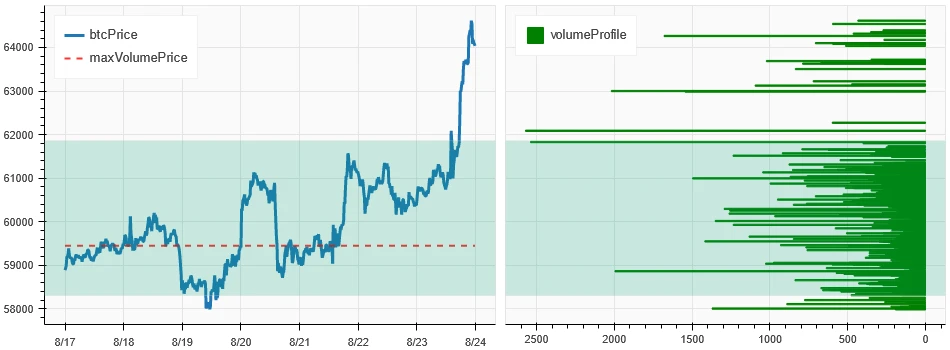
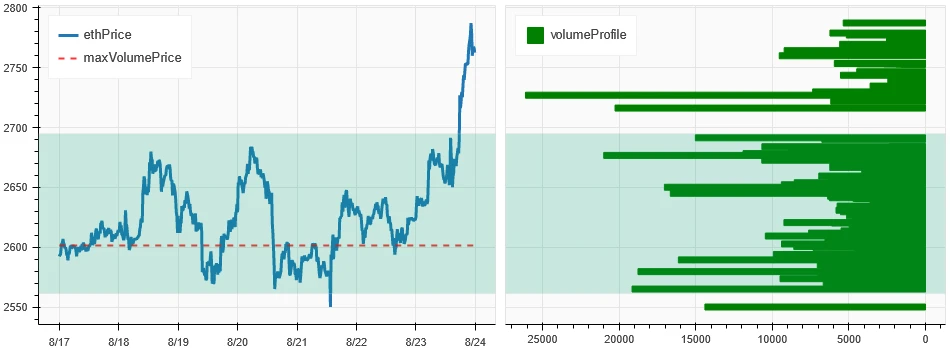
In the past week, both BTC and ETH broke through the concentrated trading area and formed an upward trend.
Yukarıdaki resim, geçtiğimiz hafta BTC'lerin yoğun işlem alanlarının dağılımını göstermektedir.
Yukarıdaki resim, geçtiğimiz hafta ETH'lerin yoğun işlem alanlarının dağılımını gösteriyor.
Tablo, geçen hafta BTC ve ETH'nin haftalık yoğun işlem aralığını gösteriyor.
Hacim ve Açık Faiz
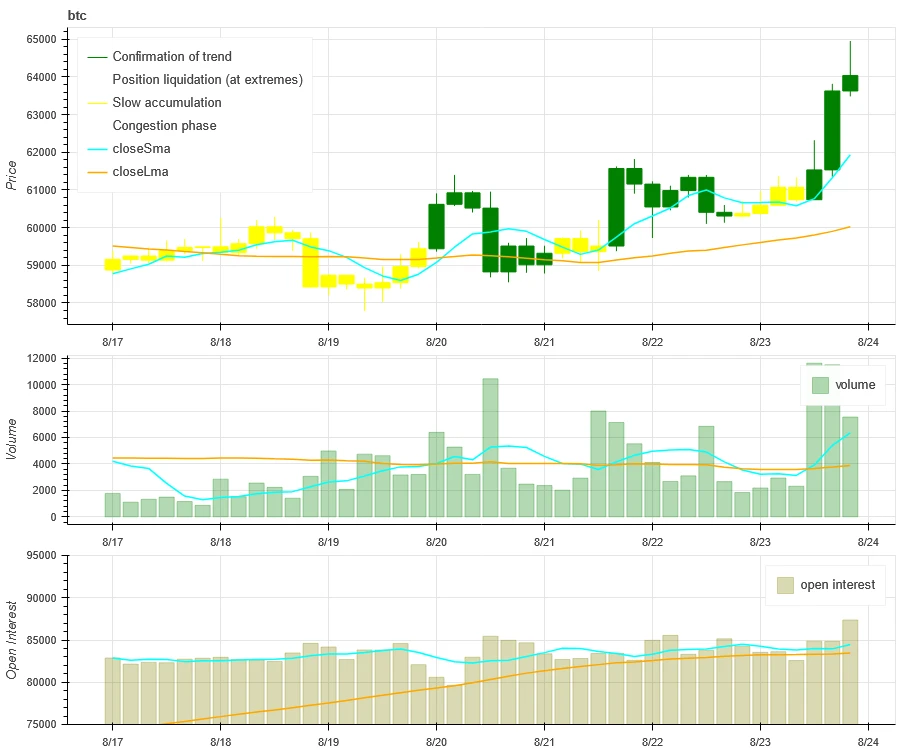
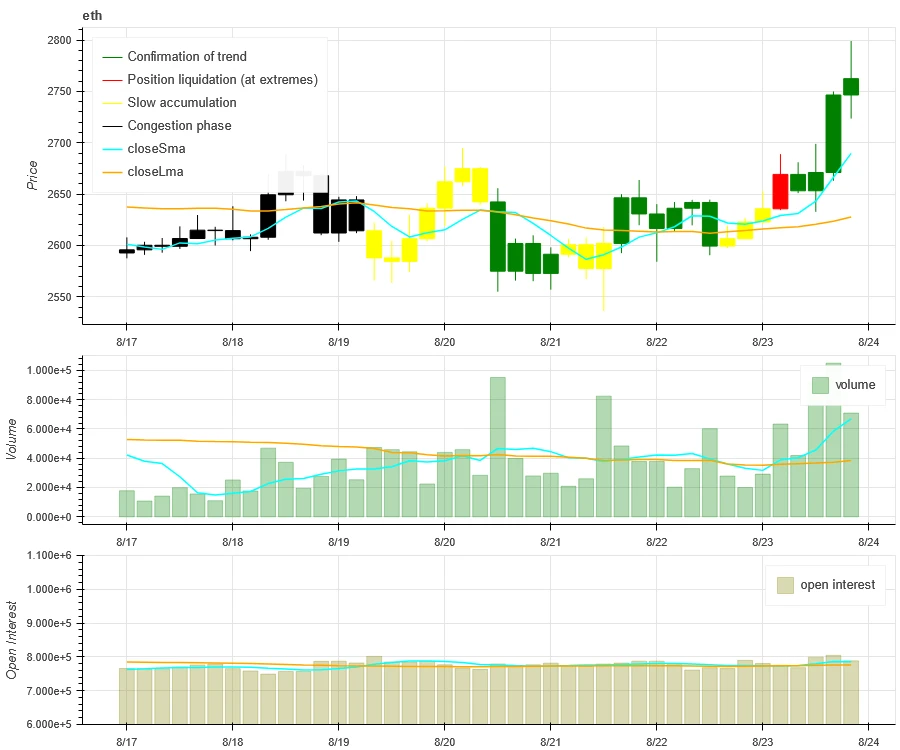
In the past week, the trading volume of BTC and ETH was the largest when they rose to 8.23; the open interest of BTC and ETH both increased slightly.
Yukarıdaki resmin üst kısmı BTC'nin fiyat eğilimini, ortası işlem hacmini, alt kısmı açık pozisyonları, açık mavi 1 günlük ortalamayı, turuncu ise 7 günlük ortalamayı göstermektedir. K çizgisinin rengi mevcut durumu temsil eder, yeşil fiyat artışının işlem hacmi tarafından desteklendiğini, kırmızı pozisyonların kapatıldığını, sarı yavaş yavaş biriken pozisyonları, siyah ise kalabalık durumu ifade eder.
Yukarıdaki resmin üst kısmı ETH'nin fiyat eğilimini, ortası işlem hacmini, alt kısmı açık pozisyonları, açık mavi 1 günlük ortalamayı ve turuncu ise 7 günlük ortalamayı göstermektedir. K çizgisinin rengi mevcut durumu temsil eder, yeşil fiyat artışının işlem hacmi tarafından desteklendiğini, kırmızı pozisyonların kapandığını, sarı yavaş yavaş pozisyonların toplandığını ve siyah ise kalabalık olduğunu gösterir.
Tarihsel Volatilite ve İma Edilen Volatilite
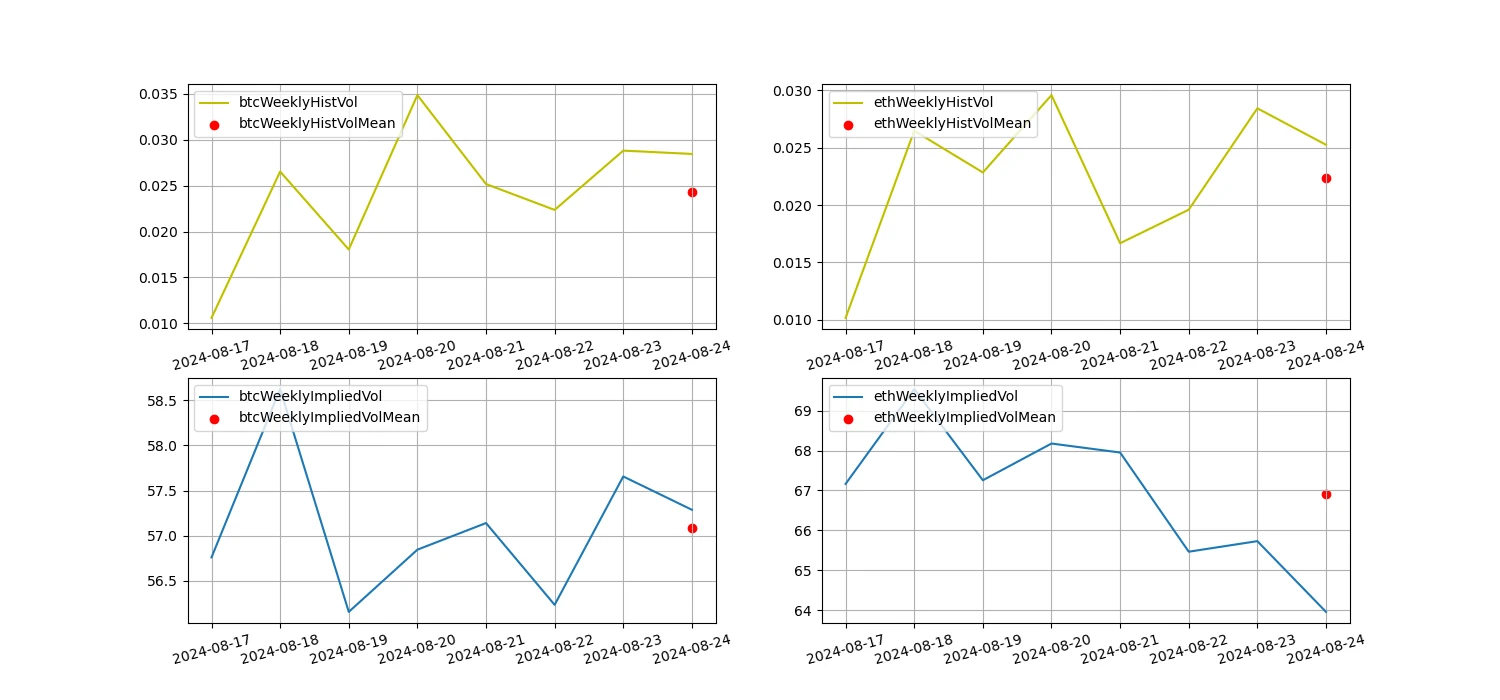
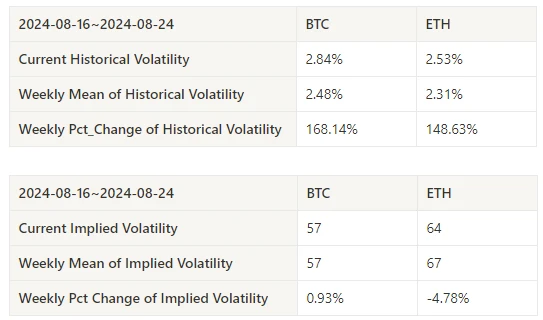
In the past week, the historical volatility of BTC and ETH was highest when they fluctuated in a wide range of 8.20; the implied volatility of BTC increased while that of ETH decreased.
Sarı çizgi tarihsel oynaklığı, mavi çizgi ima edilen oynaklığı, kırmızı nokta ise 7 günlük ortalamayı gösteriyor.
Olay odaklı
This past week, the Federal Reserve’s annual meeting hinted at an upcoming rate cut, and Bitcoin rose 6.5% in response.
Duygu Göstergeleri
Momentum Duyarlılığı
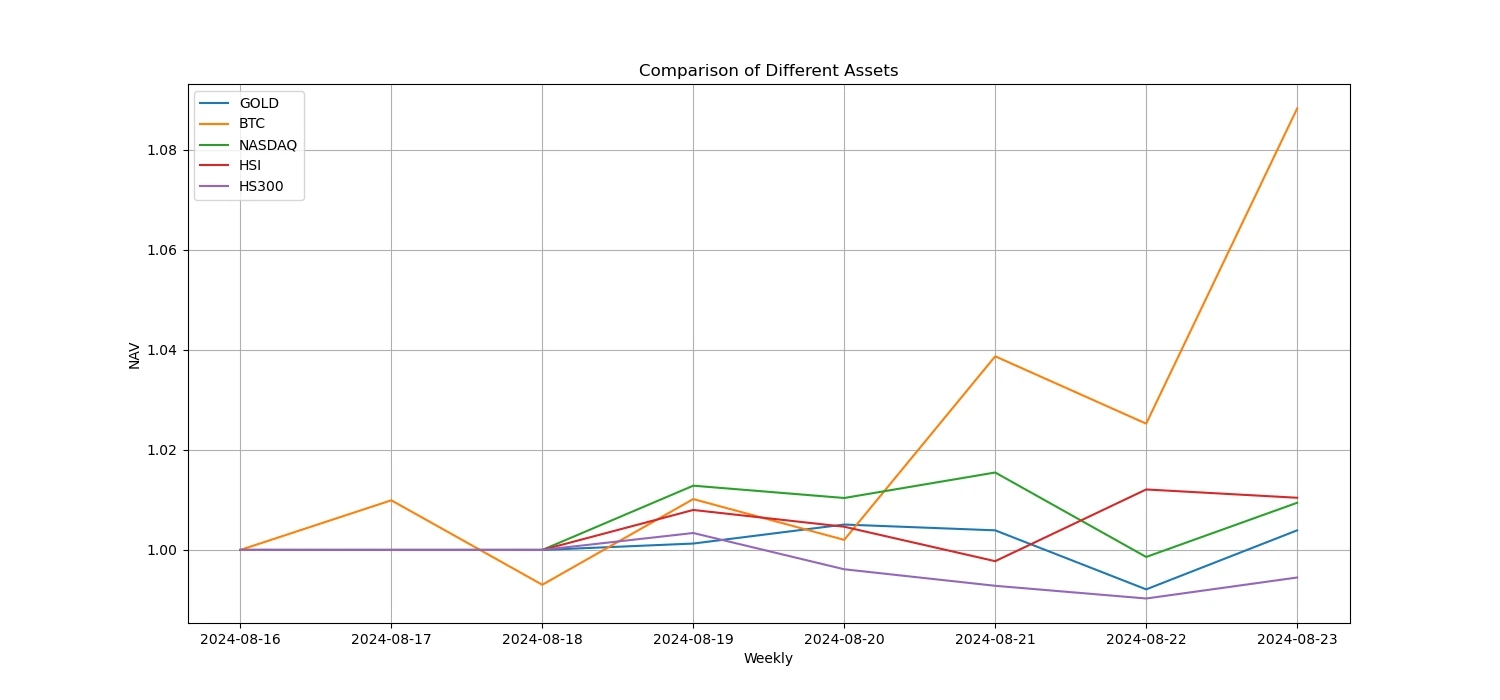
Geçtiğimiz hafta Bitcoin/Altın/Nasdaq/Hang Seng Endeksi/CSI 300 endeksleri arasında Bitcoin en güçlü performansı gösterirken, CSI 300 en kötü performansı gösterdi.
Yukarıdaki resim farklı varlıkların geçen haftaki eğilimini göstermektedir.
Borç Verme Oranı_Kredi Verme Duyarlılığı
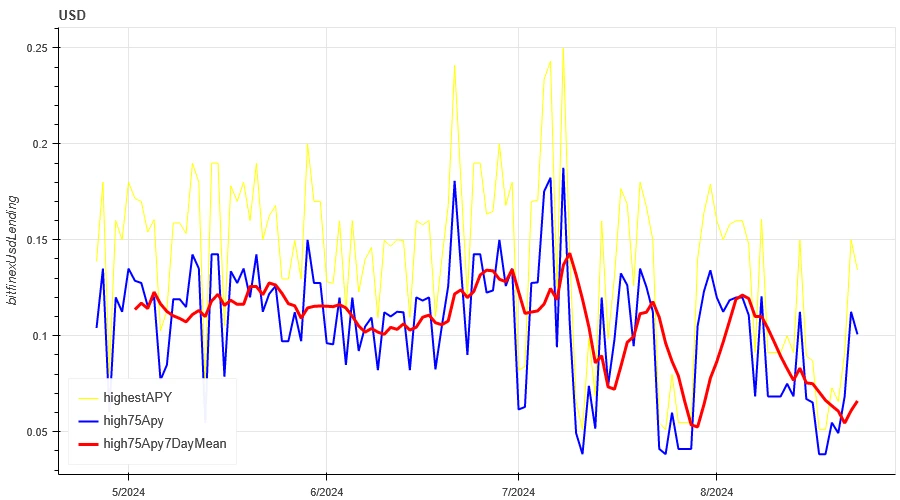
The average annualized return on USD lending over the past week was 6.6%, and short-term interest rates rose to 10.1%.
Sarı çizgi USD faiz oranının en yüksek fiyatı, mavi çizgi en yüksek fiyat olan 75%, kırmızı çizgi ise en yüksek fiyat olan 75%'nin 7 günlük ortalamasıdır.
Tablo, geçmişteki farklı elde tutma günlerinde ABD doları faiz oranlarının ortalama getirisini göstermektedir
Fonlama Oranı_Sözleşme Kaldıraç Duyarlılığı
The average annualized return on BTC fees in the past week was -1.4%, and contract leverage sentiment is turning pessimistic.
Mavi çizgi BTC'nin Binance'teki fonlama oranı, kırmızı çizgi ise 7 günlük ortalamasıdır
Tablo, geçmişteki farklı tutma günleri için BTC ücretlerinin ortalama getirisini göstermektedir.
Piyasa Korelasyonu_Konsensüs Duyarlılığı
The correlation among the 129 coins selected in the past week was around 0.85, and the consistency between different varieties has increased from a low level.
In the above picture, the blue line is the price of Bitcoin, and the green line is [1000 floki, 1000 lunc, 1000 pepe, 1000 shib, 100 0x ec, 1inch, aave, ada, agix, algo, ankr, ant, ape, apt, arb, ar, astr, atom, audio, avax, axs, bal, band, bat, bch, bigtime, blur, bnb, btc, celo, cfx, chz, ckb, comp, crv, cvx, cyber, dash, doge, dot, dydx, egld, enj, ens, eos,etc, eth, fet, fil, flow, ftm, fxs, gala, gmt, gmx, grt, hbar, hot, icp, icx , imx, inj, iost, iotx, jasmy, kava, klay, ksm, ldo, link, loom, lpt, lqty, lrc, ltc, luna 2, magic, mana, matic, meme, mina, mkr, near, neo, ocean, one, ont, op, pendle, qnt, qtum, rndr, rose, rune, rvn, sand, sei, sfp, skl, snx , sol, ssv, stg, storj, stx, sui, sushi, sxp, theta, tia, trx, t, uma, uni, vet, waves, wld, woo, xem, xlm, xmr, xrp, xtz, yfi, zec, zen, zil, zrx] overall correlation
Pazar Genişliği_Genel Duygu
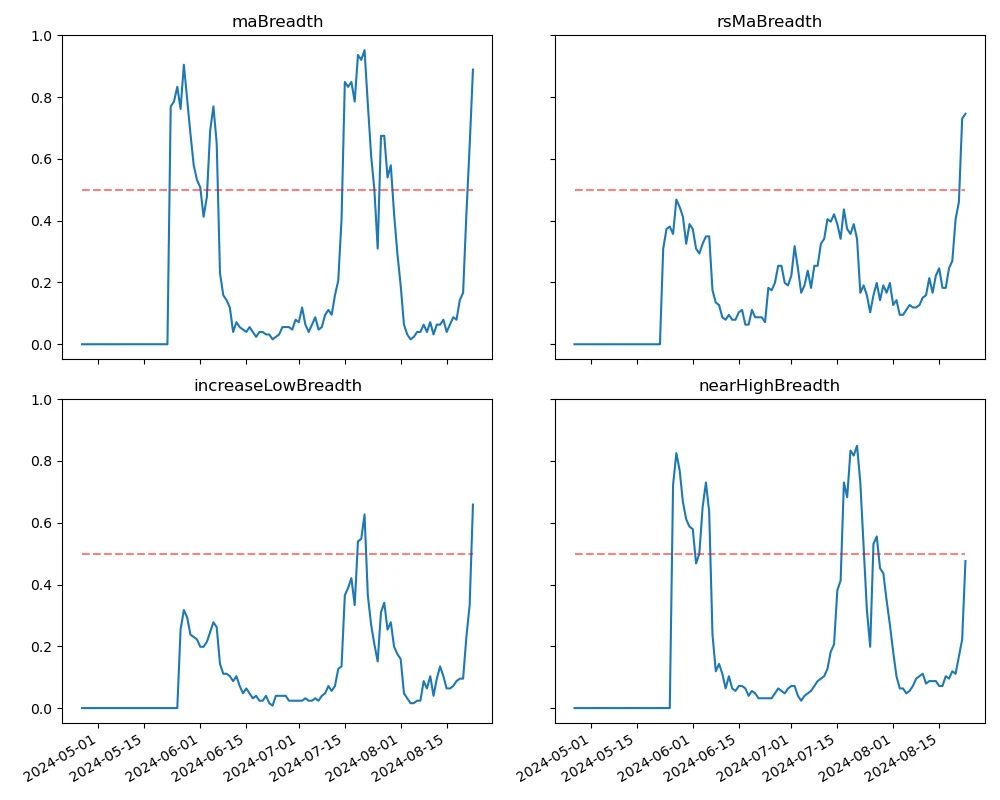
Among the 129 coins selected in the past week, 89% of them were priced above the 30-day moving average, 75% of them were above the 30-day moving average relative to BTC, 66% of them were more than 20% away from the lowest price in the past 30 days, and 48% of them were less than 10% away from the highest price in the past 30 days. The market breadth indicator in the past week showed that most coins in the overall market returned to an upward trend.
The picture above is [bnb, btc, sol, eth, 1000 floki, 1000 lunc, 1000 pepe, 1000 sats, 1000 shib, 100 0x ec, 1inch, aave, ada, agix, ai, algo, alt, ankr, ape, apt, arb, ar, astr, atom, avax, axs, bal, band, bat, bch, bigtime, blur, cake, celo, cfx, chz, ckb, comp, crv, cvx, cyber, dash, doge, dot, dydx, egld, enj, ens, eos,etc, fet, fil, flow, ftm, fxs, gala, gmt, gmx, grt, hbar, hot , icp, icx, idu, imx, inj, iost, iotx, jasmy, jto, jup, kava, klay, ksm, ldo, link, loom, lpt, lqty, lrc, ltc, luna 2, magic, mana, manta, mask, matic, meme, mina, mkr, near, neo, nfp, ocean, one, ont, op, ordi, pendle, pyth, qnt, qtum, rndr, robin, rose, rune, rvn, sand, sei, sfp, skl, snx, ssv, stg, storj, stx, sui, sushi, sxp, theta, tia, trx, t, uma, uni, vet, waves, wif, wld, woo,xai, xem, xlm, xmr, xrp, xtz, yfi, zec, zen, zil, zrx ] 30-day proportion of each width indicator
Özetle
In the past week, the price of Bitcoin (BTC) and Ethereum (ETH) fluctuated and then rose. The historical volatility peaked on August 20 when the market fluctuated widely, and the trading volume peaked on August 23 when the market rose. The open interest of both BTC and ETH increased. The implied volatility of BTC increased while that of ETH decreased. Bitcoin performed the best in comparison with gold, Nasdaq, Hang Seng Index and CSI 300, while CSI 300 performed the weakest. Bitcoins funding rate fell to negative, reflecting the pessimistic sentiment of market participants. The correlation between the selected 129 currencies remained at around 0.85, showing that the consistency between different varieties has risen from a low level. The market breadth indicator shows that most cryptocurrencies in the overall market are still back to an upward trend. The Federal Reserves annual meeting hinted at an upcoming rate cut, and Bitcoin rose 6.5% in response.
Twitter: @ https://x.com/CTA_ChannelCmt
İnternet sitesi: kanalcmt.com
This article is sourced from the internet: Crypto Market Sentiment Research Report (2024.08.16–08.23): Bitcoin rises as dovish turn to impending rate cut
Related: How crypto hedge funds generate excess returns: Actively manage risks and invest in BTC
Original author: Crypto, Distilled Original translation: TechFlow Coinbase just released a report on how crypto hedge funds generate excess returns. Here are the most valuable insights. Report Overview The report reveals the main strategies used by active crypto hedge funds. It provides valuable insights for any investor looking to: Better manage risk Capturing excess returns Deepen your understanding of encryption Provided valuable insights. Passive or active strategy? Regardless of your experience level, always compare your performance to $BTC. If you can’t outperform $BTC for a year or more, consider a passive strategy. For most investors, DCAing $BTC on a regular basis is usually the best option during a bear market. Bitcoin – Benchmark $BTC is the preferred benchmark for crypto market beta. Since 2013, $BTC has had an annualized return…
