Kripto Piyasası Duygu Araştırma Raporu (2024.06.21-06.28): SOL 7% yükseldi, VanEck Solana Trust Fund başvurusunu sundu
SOL rises 7%, VanEck submits Solana Trust fund application
June 28, 2024 Solana cryptocurrency price surged nearly 10% after multiple sources provided verified information about VanEck (VanEck Solana Trust) application for Solana-based spot ETF. VanEck is an asset management company with more than $89 billion in assets under management. This is the first such application filed with the U.S. Securities and Exchange Commission (SEC). Solana immediately rose after the news about the spot ETF application, but soon encountered some resistance and profit-taking. Bitcoin reacted to the news by jumping nearly $1,400 from $60,800 to $62,200, but the price is currently below $62,000 again.
There are about 31 days until the next Federal Reserve interest rate meeting (2024.08.01)
https://hk.investing.com/economic-calendar/interest-rate-decision-168
Piyasa teknik ve duyarlılık ortamı analizi
Duygu Analizi Bileşenleri
Teknik göstergeler
Fiyat eğilimi
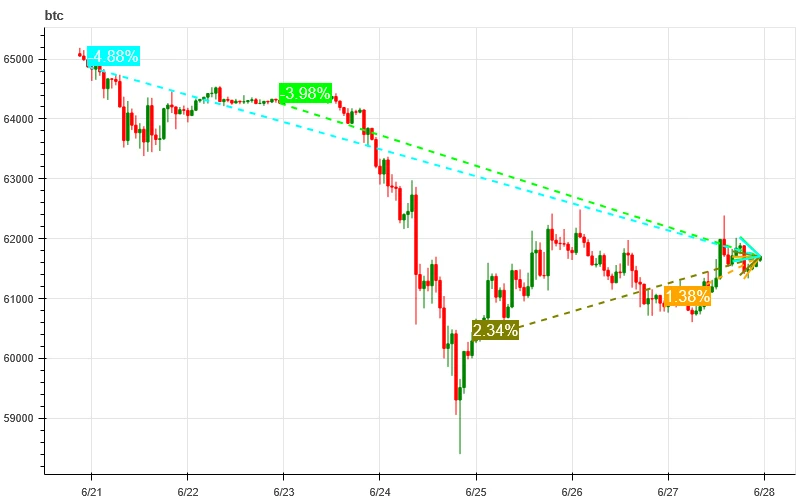
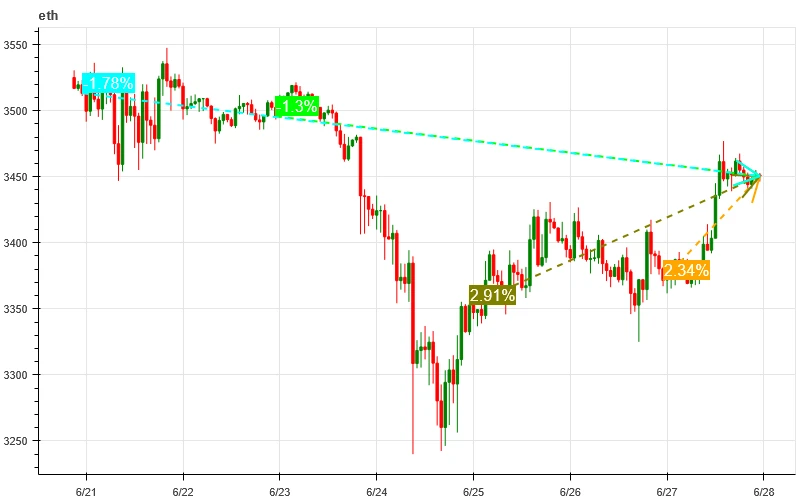
BTC price fell -4.88% and ETH price fell -1.78% in the past week.
Yukarıdaki resim BTC'nin geçen haftaki fiyat tablosudur.
Yukarıdaki resim ETH'nin geçen haftaki fiyat tablosudur.
Tabloda geçtiğimiz haftadaki fiyat değişim oranları gösterilmektedir.
Fiyat Hacim Dağılım Grafiği (Destek ve Direnç)
In the past week, BTC and ETH fell to 6.24 and formed a dense trading area at a low level before fluctuating widely.
Yukarıdaki resim, geçtiğimiz hafta BTC'lerin yoğun işlem alanlarının dağılımını göstermektedir.
Yukarıdaki resim, geçtiğimiz hafta ETH'lerin yoğun işlem alanlarının dağılımını gösteriyor.
Tablo, geçen hafta BTC ve ETH'nin haftalık yoğun işlem aralığını gösteriyor.
Hacim ve Açık Faiz
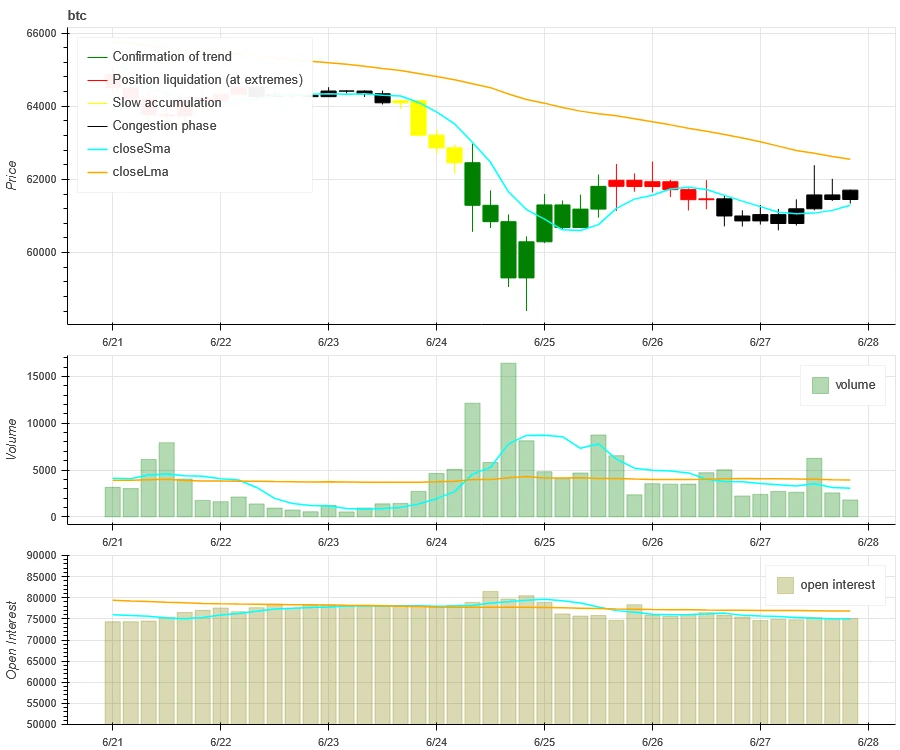
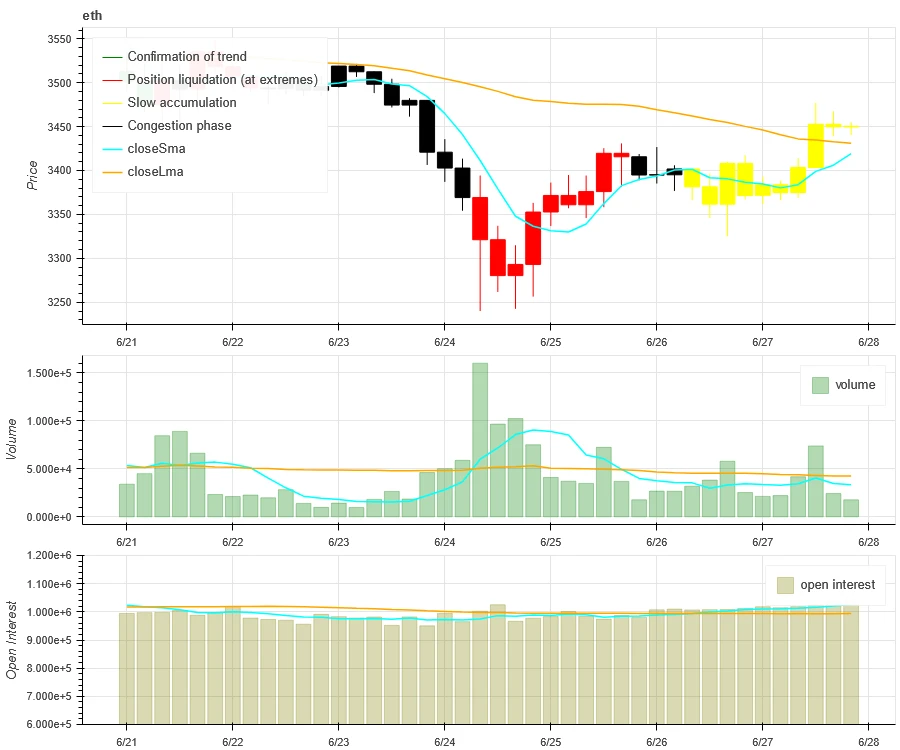
BTC and ETH had the largest trading volume this past week when they fell on June 24; open interest for both BTC and ETH rose slightly.
Yukarıdaki resmin üst kısmı BTC'nin fiyat eğilimini, ortası işlem hacmini, alt kısmı açık pozisyonları, açık mavi 1 günlük ortalamayı, turuncu ise 7 günlük ortalamayı göstermektedir. K çizgisinin rengi mevcut durumu temsil eder, yeşil fiyat artışının işlem hacmi tarafından desteklendiğini, kırmızı pozisyonların kapatıldığını, sarı yavaş yavaş biriken pozisyonları, siyah ise kalabalık durumu ifade eder.
Yukarıdaki resmin üst kısmı ETH'nin fiyat eğilimini, ortası işlem hacmini, alt kısmı açık pozisyonları, açık mavi 1 günlük ortalamayı ve turuncu ise 7 günlük ortalamayı göstermektedir. K çizgisinin rengi mevcut durumu temsil eder, yeşil fiyat artışının işlem hacmi tarafından desteklendiğini, kırmızı pozisyonların kapandığını, sarı yavaş yavaş pozisyonların toplandığını ve siyah ise kalabalık olduğunu gösterir.
Tarihsel Volatilite ve İma Edilen Volatilite
In the past week, historical volatility of BTC and ETH was highest at 6.24; implied volatility of BTC rose slightly while ETH fell slightly.
The yellow line is the historical volatility, the blue line is the implied volatility, and the red dot is its 7-day average.
Olay odaklı
No data was released in the past week.
Duygu Göstergeleri
Momentum Duyarlılığı
In the past week, among Bitcoin/Gold/Nasdaq/Hang Seng Index/SSE 300, Nasdaq was the strongest, while Bitcoin performed the worst.
Yukarıdaki resim farklı varlıkların geçen haftaki eğilimini göstermektedir.
Borç Verme Oranı_Kredi Verme Duyarlılığı
Over the past week, the average annualized return on USD lending was 13.3%, and short-term interest rates remained around 12.4%.
Sarı çizgi USD faiz oranının en yüksek fiyatı, mavi çizgi en yüksek fiyat olan 75%, kırmızı çizgi ise en yüksek fiyat olan 75%'nin 7 günlük ortalamasıdır.
Tablo, geçmişteki farklı elde tutma günleri için USD faiz oranlarının ortalama getirisini göstermektedir
Fonlama Oranı_Sözleşme Kaldıraç Duyarlılığı
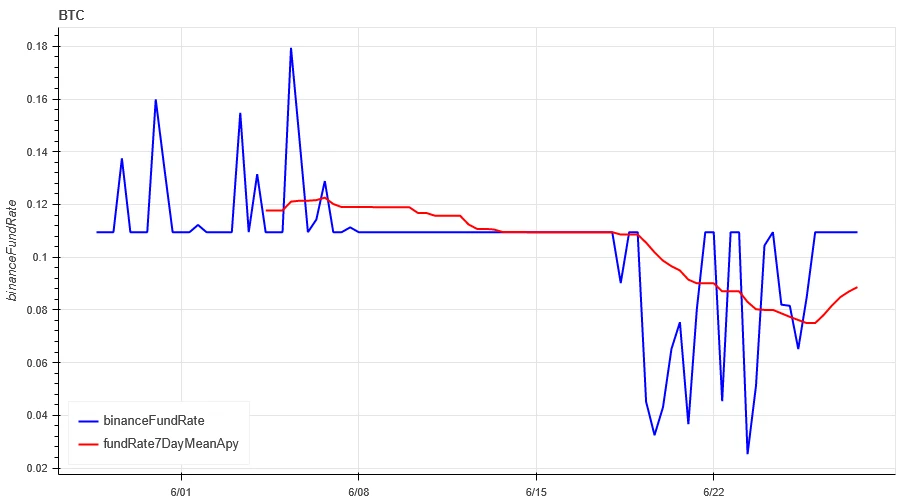
The average annualized return on BTC fees in the past week was 8.8%, and contract leverage sentiment remained at a low level.
Mavi çizgi BTC'nin Binance'teki fonlama oranı, kırmızı çizgi ise 7 günlük ortalamasıdır
Tablo, geçmişteki farklı tutma günleri için BTC ücretlerinin ortalama getirisini göstermektedir.
Piyasa Korelasyonu_Konsensüs Duyarlılığı
The correlation among the 129 coins selected in the past week dropped to around 0.45, and the consistency between different varieties dropped significantly.
In the above picture, the blue line is the price of Bitcoin, and the green line is [1000 floki, 1000 lunc, 1000 pepe, 1000 shib, 100 0x ec, 1inch, aave, ada, agix, algo, ankr, ant, ape, apt, arb, ar, astr, atom, audio, avax, axs, bal, band, bat, bch, bigtime, blur, bnb, btc, celo, cfx, chz, ckb, comp, crv, cvx, cyber, dash, doge, dot, dydx, egld, enj, ens, eos,etc, eth, fet, fil, flow, ftm, fxs, gala, gmt, gmx, grt, hbar, hot, icp, icx, imx, inj, iost, iotx, jasmy, kava, klay, ksm, ldo, link, loom, lpt, lqty, lrc, ltc, luna 2, magic, mana, matic, meme, mina, mkr, near, neo, ocean, one, ont, op, pendle, qnt, qtum, rndr, rose, rune, rvn, sand, sei, sfp, skl, snx, sol, ssv, stg, storj, stx, sui, sushi, sxp, theta, tia, trx, t, uma, uni, vet, waves, wld, woo, xem, xlm, xmr, xrp, xtz, yfi, zec, zen, zil, zrx] overall correlation
Pazar Genişliği_Genel Duygu
Among the 129 coins selected in the past week, 5.5% of the coins were priced above the 30-day moving average, 25% of the coins were priced above the 30-day moving average relative to BTC, 4% of the coins were more than 20% away from the lowest price in the past 30 days, and 6.3% of the coins were less than 10% away from the highest price in the past 30 days. The market breadth indicator in the past week showed that most coins in the overall market continued to fall.
Yukarıdaki resim [bnb, btc, sol, eth, 1000 floki, 1000 lunc, 1000 pepe, 1000 sats, 1000 shib, 100 0x ec, 1inch, aave, ada, agix, ai, algo, alt, ankr, ape, apt, arb, ar, astr, atom, avax, axs, bal, band, bat, bch, bigtime, blur, cake, celo, cfx, chz, ckb, comp, crv, cvx, cyber, dash, doge, dot, dydx, egld, enj, ens, eos, vb., fet, fil, flow, ftm, fxs, gala, gmt, gmx, grt, hbar, hot, icp, icx, idu, imx, inj, iost, iotx, jasmy, jto, jup, kava, klay, ksm, ldo, link, loom, lpt, lqty, lrc, ltc, luna 2, magic, mana, manta, mask, matic, meme, mina, mkr, near, neo, nfp, ocean, one, ont, op, ordi, pendle, pyth, qnt, qtum, rndr, robin, rose, rune, rvn, sand, sei, sfp, skl, snx, ssv, stg, storj, stx, sui, suşi, sxp, theta, tia, trx, t, uma, uni, veteriner, dalgalar, wif, wld, woo,xai, xem, xlm, xmr, xrp, xtz, yfi, zec, zen, zil, zrx ] Her genişlik göstergesinin 30 günlük oranı
Özetle
Over the past week, Bitcoin (BTC) and Ethereum (ETH) prices have experienced wide range fluctuations after the decline, while the volatility and trading volume of these two cryptocurrencies reached the highest level during the decline on June 24. The open interest of Bitcoin and Ethereum has increased slightly. In addition, the implied volatility of Bitcoin has increased slightly, while the implied volatility of Ethereum has decreased slightly. The funding rate of Bitcoin has remained at a low level, which may reflect the continued low leverage sentiment of market participants towards Bitcoin. The market breadth indicator shows that most cryptocurrencies continue to fall, indicating that the overall market has maintained a weak trend over the past week.
Twitter: @ https://x.com/CTA_ChannelCmt
İnternet sitesi: kanalcmt.com
This article is sourced from the internet: Crypto Market Sentiment Research Report (2024.06.21-06.28): SOL rose 7%, VanEck submitted Solana Trust Fund application
Hong Kong Virtual Asset Spot ETF On April 30, a total of 6 virtual asset spot ETFs under Bosera HashKey, China Asset Management and Harvest Asset Management officially rang the bell and were listed on the Hong Kong Stock Exchange and opened for trading, including Bosera HashKey Bitcoin ETF (3008.HK), Bosera HashKey Ethereum ETF (3009.HK), China Asset Management Bitcoin ETF (3042.HK), China Asset Management Ethereum ETF (3046.HK), Harvest Bitcoin Spot ETF (3439.HK) and Harvest Ethereum Spot ETF (3179.HK). Li Yimei, CEO of China Asset Management, said in an interview with Bloomberg TV that the launch of Hong Kong spot Bitcoin and Ethereum ETFs opens the door for many RMB holders to seek alternative investments. As the opening-up develops, hopefully there will be new opportunities for mainland Chinese investors to participate…
