My XP
0
Login
The rising probability of Trumps victory has made risky assets such as Bitcoin popular. In particular, the Republican Party mentioned in its latest campaign platform that if Trump takes office, it will end the suppression of cryptocurrencies, which has greatly boosted confidence in the cryptocurrency market.
The “Trump deal” is a hit.
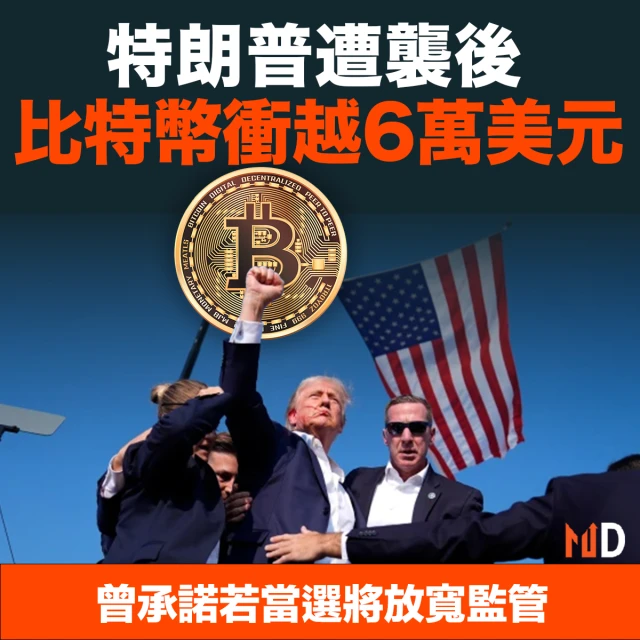
After Trump was attacked over the weekend, a series of Trump-related assets such as U.S. Treasury yields and Bitcoin soared. This is all thanks to the fact that he survived the assassination attempt, and the American peoples support for Trump has soared.
Among them, Bitcoin rose for six consecutive days, with a total increase of 11.59% this week, reaching a high of US$66,000.
There are about 11 days until the next Fed meeting (August 1, 2024)
https://hk.investing.com/economic-calendar/interest-rate-decision-168

องค์ประกอบการวิเคราะห์ความรู้สึก
In the past week, BTC prices rose 11.59% and ETH prices rose 10.55%.
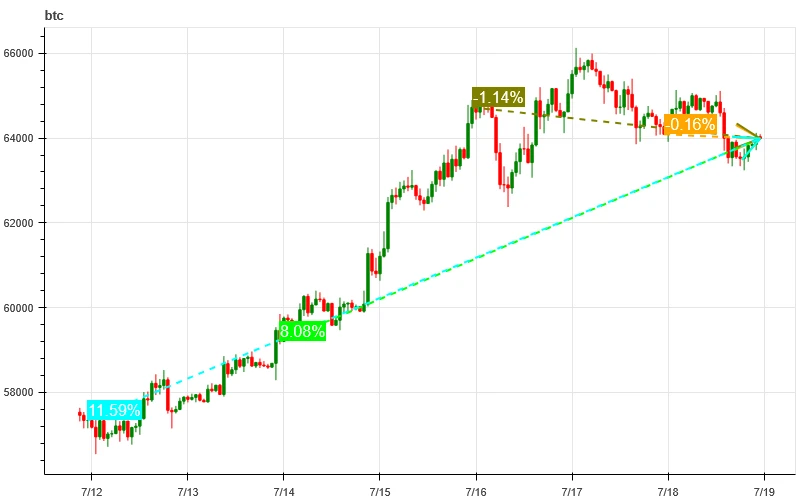
ภาพด้านบนคือกราฟราคาของ BTC ในสัปดาห์ที่ผ่านมา

ภาพด้านบนคือกราฟราคาของ ETH ในสัปดาห์ที่ผ่านมา
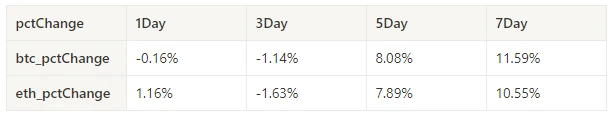
ตารางแสดงอัตราการเปลี่ยนแปลงราคาในช่วงสัปดาห์ที่ผ่านมา
In the past week, BTC and ETH formed a new intensive trading area as they rose to high levels and increased in volume.
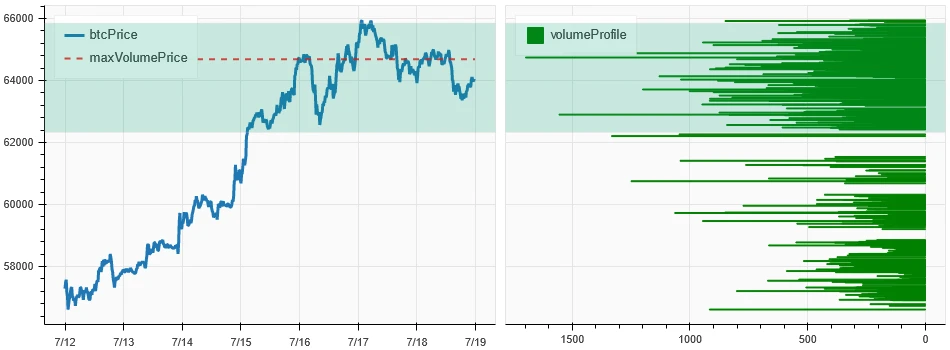
ภาพด้านบนแสดงการกระจายตัวของพื้นที่การซื้อขาย BTC ที่หนาแน่นในสัปดาห์ที่ผ่านมา

ภาพด้านบนแสดงการกระจายตัวของพื้นที่การซื้อขาย ETH ที่หนาแน่นในสัปดาห์ที่ผ่านมา
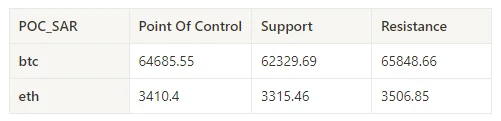
ตารางแสดงช่วงการซื้อขายรายสัปดาห์ของ BTC และ ETH ในสัปดาห์ที่ผ่านมา
In the past week, BTC and ETH had the largest trading volume when they rose from July 15 to 16; the open interest of BTC and ETH both fell slightly.

ด้านบนของภาพด้านบนแสดงแนวโน้มราคาของ BTC ตรงกลางแสดงปริมาณการซื้อขาย ด้านล่างแสดงดอกเบี้ยที่เปิดอยู่ สีฟ้าอ่อนคือค่าเฉลี่ย 1 วัน และสีส้มคือค่าเฉลี่ย 7 วัน สีของเส้น K แสดงถึงสถานะปัจจุบัน สีเขียวหมายถึงการเพิ่มขึ้นของราคาโดยปริมาณการซื้อขาย สีแดงหมายถึงสถานะปิด สีเหลืองหมายถึงสถานะที่สะสมช้า และสีดำหมายถึงสถานะที่มีผู้คนหนาแน่น

ด้านบนของภาพด้านบนแสดงแนวโน้มราคาของ ETH ตรงกลางคือปริมาณการซื้อขาย ด้านล่างคือดอกเบี้ยแบบเปิด สีฟ้าอ่อนคือค่าเฉลี่ย 1 วัน และสีส้มคือค่าเฉลี่ย 7 วัน สีของเส้น K แสดงถึงสถานะปัจจุบัน สีเขียวหมายถึงราคาที่เพิ่มขึ้นได้รับการสนับสนุนจากปริมาณการซื้อขาย สีแดงคือตำแหน่งปิด สีเหลืองคือตำแหน่งที่สะสมอย่างช้าๆ และสีดำคือตำแหน่งที่หนาแน่น
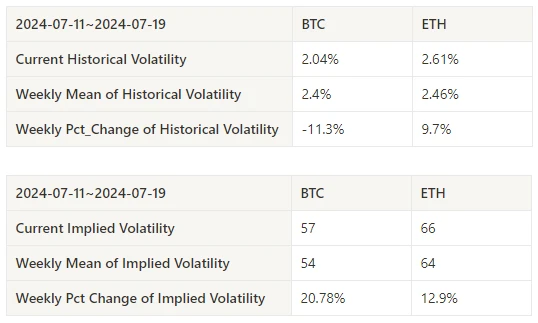
In the past week, the historical volatility of BTC and ETH was the highest when it rose to 7.16; the implied volatility of BTC and ETH rose synchronously.
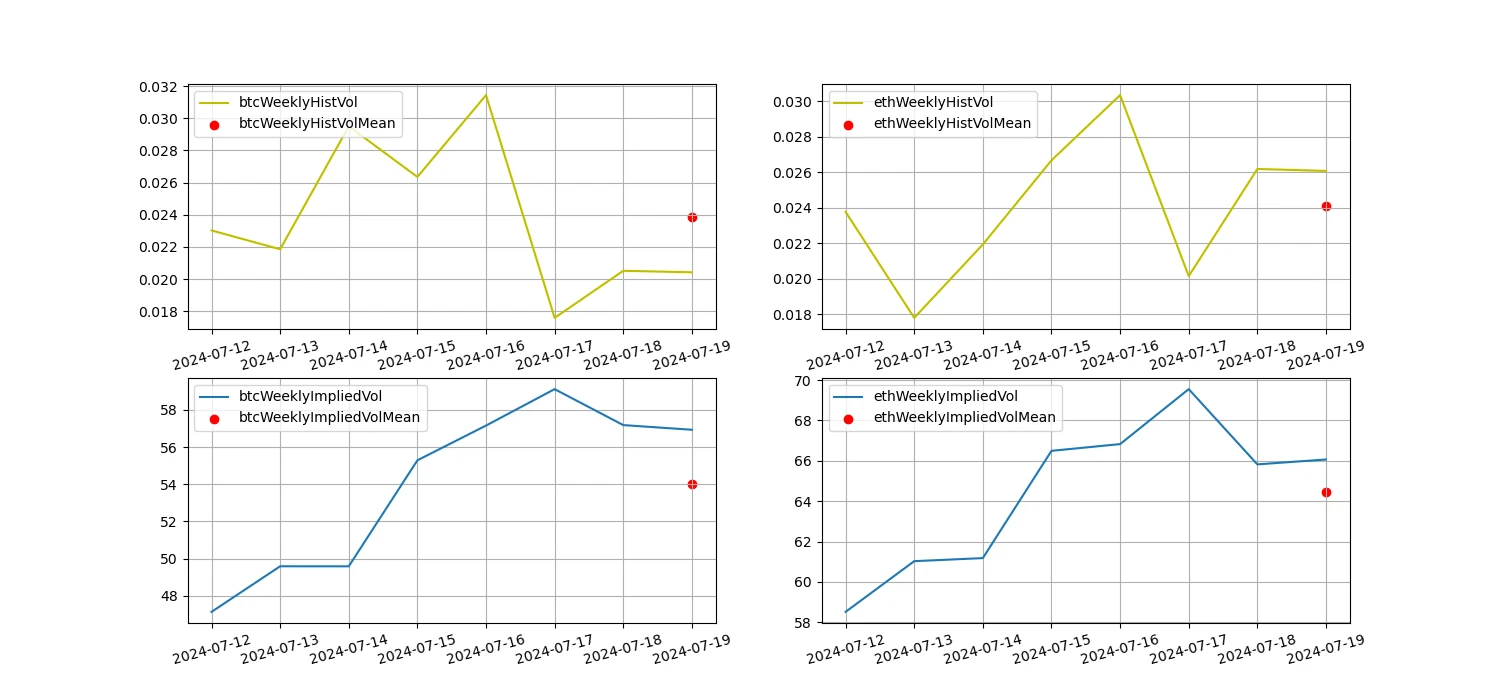
เส้นสีเหลืองคือความผันผวนในอดีต เส้นสีน้ำเงินคือความผันผวนโดยนัย และจุดสีแดงคือค่าเฉลี่ย 7 วัน
There were no major data releases in the past week.
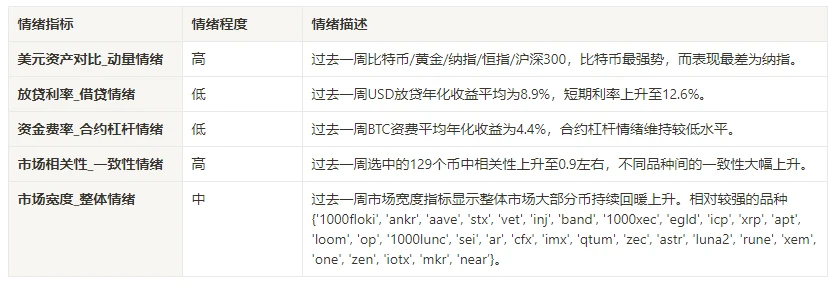
In the past week, among Bitcoin/Gold/Nasdaq/Hang Seng Index/SSE 300, Bitcoin was the strongest, while Nasdaq performed the worst.

ภาพด้านบนแสดงแนวโน้มของสินทรัพย์ต่างๆ ในสัปดาห์ที่ผ่านมา

The average annualized return on USD lending over the past week was 8.9%, and short-term interest rates rose to 12.6%.

เส้นสีเหลืองคือราคาสูงสุดของอัตราดอกเบี้ย USD เส้นสีน้ำเงินคือ 75% ของราคาสูงสุด และเส้นสีแดงคือค่าเฉลี่ย 7 วันของ 75% ของราคาสูงสุด
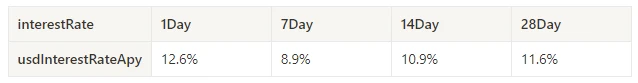
ตารางแสดงผลตอบแทนเฉลี่ยของอัตราดอกเบี้ย USD ณ วันถือครองที่แตกต่างกันในอดีต
The average annualized return on BTC fees in the past week was 4.4%, and contract leverage sentiment remained at a low level.
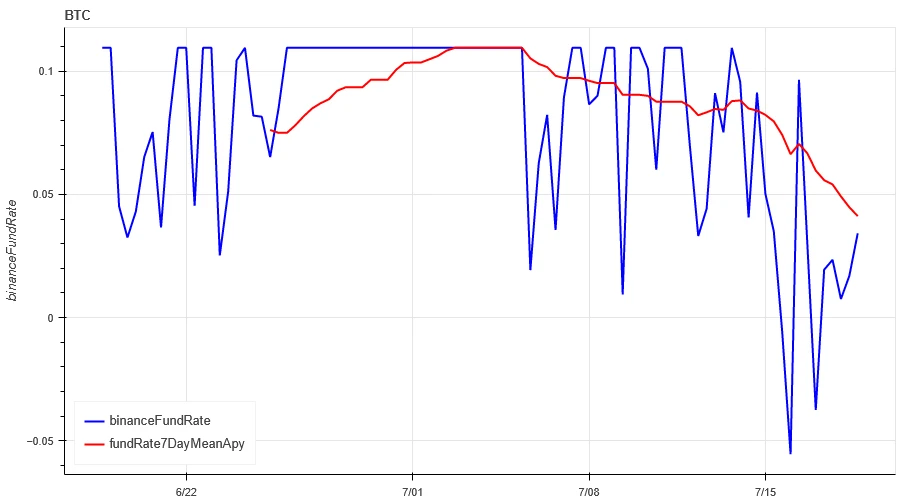
เส้นสีน้ำเงินคืออัตราการระดมทุนของ BTC บน Binance และเส้นสีแดงคือค่าเฉลี่ย 7 วัน

The table shows the average return of BTC fees for different holding days in the past.
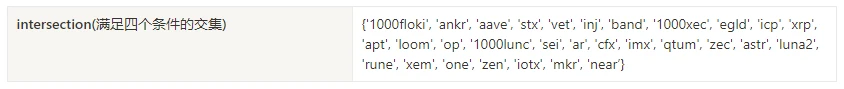
The correlation among the 129 coins selected in the past week remained at around 0.9, and the consistency between different varieties increased significantly.

ในภาพด้านบน เส้นสีน้ำเงินคือราคาของ Bitcoin และเส้นสีเขียวคือ [1000 floki, 1000 lunc, 1000 pepe, 1000 shib, 100 0x ec, 1inch, aave, ada, agix, algo, ankr, ant, ape, apt, arb, ar, astr, atom, audio, avax, axs, bal, band, bat, bch, bigtime, blur, bnb, btc, celo, cfx, chz, ckb, comp, crv, cvx, cyber, dash, doge, dot, dydx, egld, enj, ens, eos,etc, eth, fet, fil, flow, ftm, fxs, gala, gmt, gmx, grt, hbar, hot, icp, icx , imx, inj, iost, iotx, jasmy, kava, klay, ksm, ldo, ลิงค์, กี่, lpt, lqty, lrc, ltc, luna 2, มายากล, มานา, matic, Meme, mina, mkr, ใกล้, นีโอ, มหาสมุทร, หนึ่ง, ont, op, เพนเดิล, qnt, qtum, rndr, ดอกกุหลาบ, รูน, rvn, ทราย, sei, sfp, skl, snx , sol, ssv, stg, storj, stx, sui, ซูชิ, sxp, theta, tia, trx, t, uma, uni, vet, คลื่น, wld, woo, xem, xlm, xmr, xrp, xtz, yfi, zec, zen, zil, zrx] ความสัมพันธ์โดยรวม
Among the 129 coins selected in the past week, 78% of the prices were above the 30-day moving average, 37% of the prices were above the 30-day moving average relative to BTC, 33% of the prices were more than 20% away from the lowest price in the past 30 days, and 67.7% of the prices were less than 10% away from the highest price in the past 30 days. The market breadth indicators in the past week showed that most of the coins in the overall market rebounded and rose.

ภาพด้านบนคือ [bnb, btc, sol, eth, 1,000 floki, 1,000 lunc, 1,000 pepe, 1,000 sats, 1,000 shib, 100 0x ec, 1inch, aave, ada, agix, ai, algo, alt, ankr, ape, apt, arb, ar, astr, อะตอม, avax, axs, bal, วงดนตรี, ค้างคาว, bch, bigtime, เบลอ, เค้ก, celo, cfx, chz, ckb, comp, crv, cvx, ไซเบอร์, รีบ, doge, จุด, dydx, egld, enj, ens, eos, ฯลฯ, fet, fil, โฟลว์, ftm, fxs, งานกาล่า, gmt, gmx, grt, hbar, ร้อน ไอซีพี, ไอซีเอ็กซ์, ไอดู, imx, inj, iost, iotx, jasmy, jto, jup, kava, klay, ksm, ldo, ลิงค์, ทอผ้า, lpt, lqty, lrc, ltc, luna 2, มายากล, มานา, ราหู, หน้ากาก, matic, มีม, mina , mkr, ใกล้, นีโอ, nfp, มหาสมุทร, หนึ่ง, ont, op, ordi, เพนเดิล, pyth, qnt, qtum, rndr, โรบิน, กุหลาบ, รูน, rvn, ทราย, sei, sfp, skl, snx, ssv, stg, storj, stx, sui, ซูชิ, sxp, theta, tia, trx, t, uma, uni, สัตวแพทย์, คลื่น, Wif, Wld, วู, xai, xem, xlm, xmr, xrp, xtz, ใช่, เซค, เซน, ซิล, แซดอาร์เอ็กซ์ ] สัดส่วน 30 วันของตัวบ่งชี้ความกว้างแต่ละตัว
In the past week, the prices of Bitcoin (BTC) and Ethereum (ETH) rose for 6 consecutive days, while the volatility and trading volume of these two cryptocurrencies reached the highest level when they rose on July 16. The open interest of Bitcoin and Ethereum is declining. In addition, the implied volatility of Bitcoin and Ethereum has also risen in tandem. Bitcoins funding rate remains at a low level, which may reflect the continued low leverage sentiment of market participants towards Bitcoin. Market breadth indicators show that most cryptocurrencies have rebounded and risen, indicating that the overall market has rebounded from lows in the past week.
ทวิตเตอร์: @ https://x.com/CTA_ChannelCmt
เว็บไซต์: ช่อง cmt.com
This article is sourced from the internet: Crypto Market Sentiment Research Report (2024.07.12-07.19): Trumps assassination drives Bitcoin up
Related: Decoding Dar Open Network: The infrastructure layer for the next generation of Web3 games
At Dar Open Network, we firmly believe in the transformative power of blockchain games. Games are not only entertainment, but also empower players, revolutionize the digital economy, and push the boundaries of technological innovation. As the crypto industry grows, we believe that blockchain games will become the cornerstone of a new paradigm in driving adoption, creativity, and digital interaction. Our team is committed to building a gaming platform that serves game developers and players. We are not creating a new chain, but building an ecosystem. Guided by this vision, we developed Dar Open Network as the infrastructure layer for future games. The creation of Dar Open Network has been going on for six months. Starting from the mission of providing a one-stop solution, we have made progress in many aspects…