รายงานการวิจัยความรู้สึกของตลาด Crypto (14.06.2024-21.06.2024): ETF ของ Bitcoin ถูกขายออกไปอย่างต่อเนื่องในอดีต
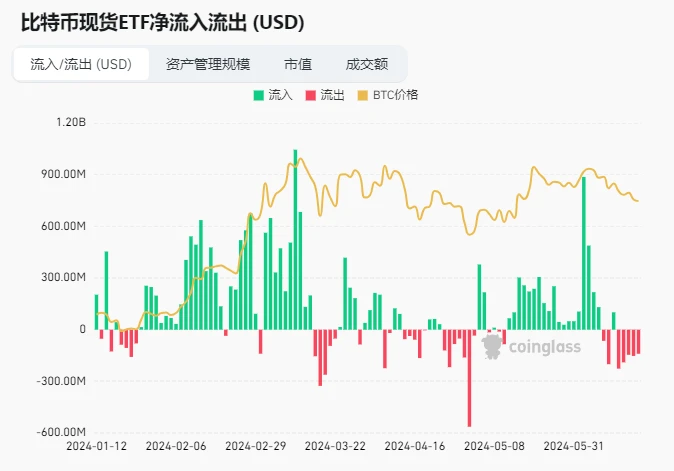
Bitcoin ETFs have been sold off continuously over the past 5 days
แหล่งข้อมูล: https://www.coinglass.com/en/bitcoin-etf
The latest data shows that the US spot Bitcoin ETF set off a selling storm on June 17! A total of 3,169 Bitcoins were sold, worth more than $200 million!
Among them, the well-known institution Fidelity reduced its holdings of 1,224 bitcoins, worth up to $80.34 million, and currently still holds a large amount of bitcoins. Another giant, Grayscale, also reduced its holdings of 936 bitcoins, worth more than $61.4 million. The reduction of holdings by these two giants has undoubtedly brought a lot of shock to the market.
This selling storm has created more uncertainty about the future trend of the Bitcoin market, and more risk management is needed.
There are about 38 days until the next Federal Reserve interest rate meeting (2024.08.01)
https://hk.investing.com/economic-calendar/interest-rate-decision-168
การวิเคราะห์สภาพแวดล้อมด้านเทคนิคและความเชื่อมั่นของตลาด
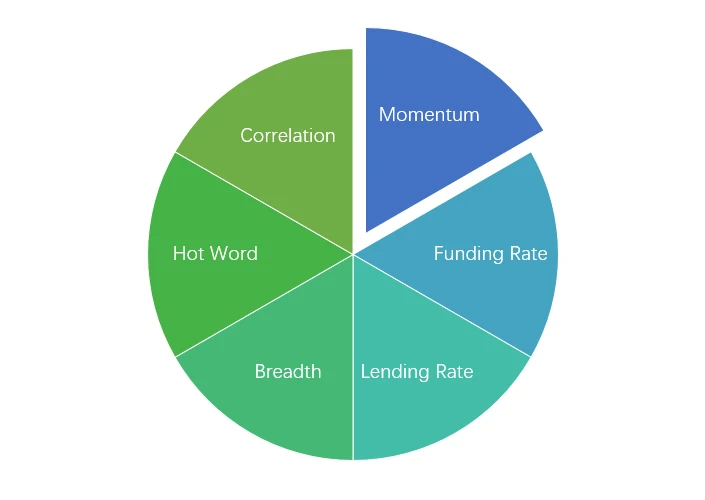
องค์ประกอบการวิเคราะห์ความรู้สึก
ตัวชี้วัดทางเทคนิค
แนวโน้มราคา
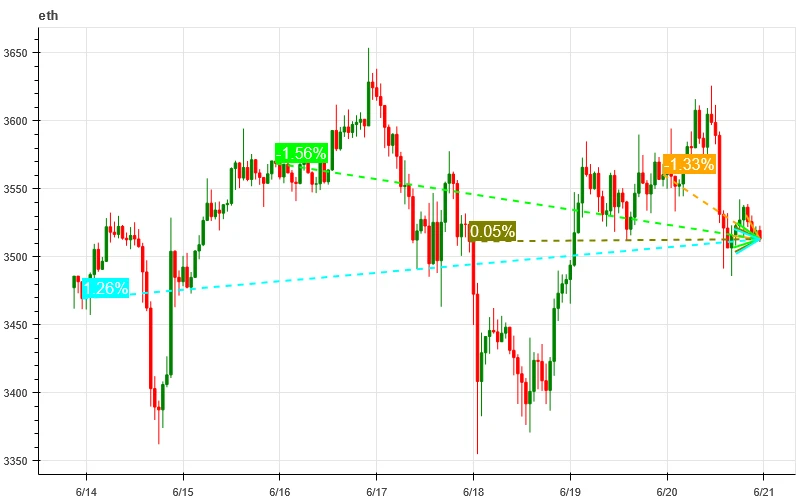
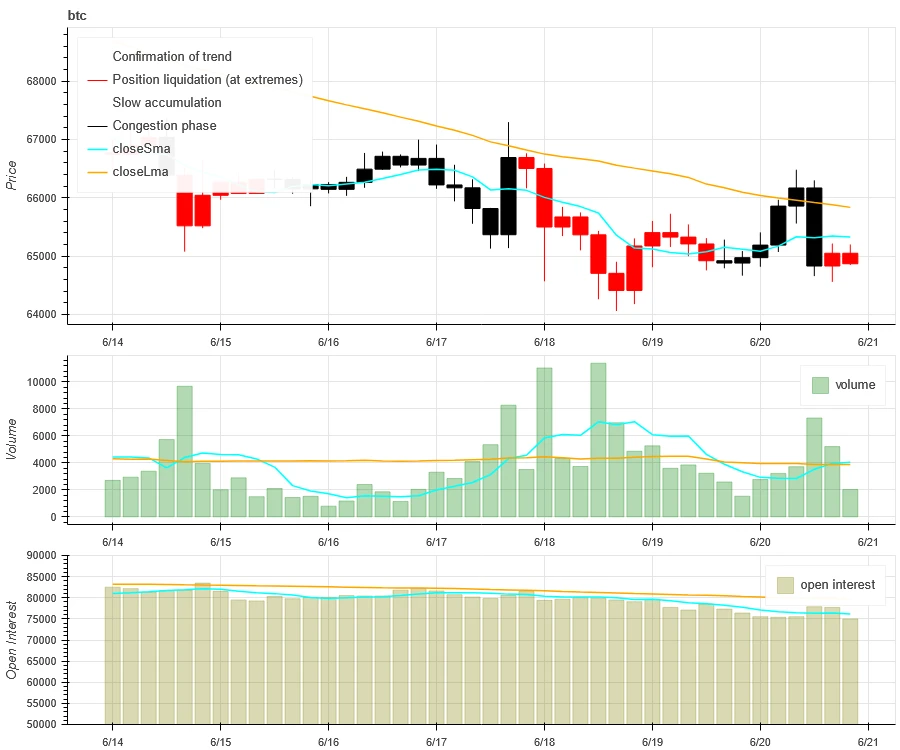
Over the past week, BTC prices fell -2.85% and ETH prices rose 1.26%.
ภาพด้านบนคือกราฟราคาของ BTC ในสัปดาห์ที่ผ่านมา
ภาพด้านบนคือกราฟราคาของ ETH ในสัปดาห์ที่ผ่านมา
ตารางแสดงอัตราการเปลี่ยนแปลงราคาในช่วงสัปดาห์ที่ผ่านมา
แผนภูมิการกระจายปริมาณราคา (แนวรับและแนวต้าน)
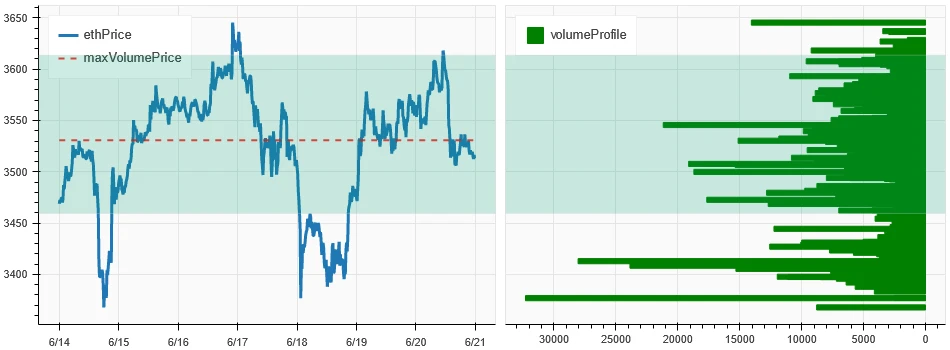
In the past week, BTC and ETH have fluctuated widely in the area of intensive trading.
ภาพด้านบนแสดงการกระจายตัวของพื้นที่การซื้อขาย BTC ที่หนาแน่นในสัปดาห์ที่ผ่านมา
ภาพด้านบนแสดงการกระจายตัวของพื้นที่การซื้อขาย ETH ที่หนาแน่นในสัปดาห์ที่ผ่านมา
ตารางแสดงช่วงการซื้อขายรายสัปดาห์ของ BTC และ ETH ในสัปดาห์ที่ผ่านมา
ปริมาณและดอกเบี้ยเปิด
BTC and ETH saw the largest volume this past week, with the decline on June 18; open interest for BTC fell while ETH rose slightly.
ด้านบนของภาพด้านบนแสดงแนวโน้มราคาของ BTC ตรงกลางแสดงปริมาณการซื้อขาย ด้านล่างแสดงดอกเบี้ยที่เปิดอยู่ สีฟ้าอ่อนคือค่าเฉลี่ย 1 วัน และสีส้มคือค่าเฉลี่ย 7 วัน สีของเส้น K แสดงถึงสถานะปัจจุบัน สีเขียวหมายถึงการเพิ่มขึ้นของราคาโดยปริมาณการซื้อขาย สีแดงหมายถึงสถานะปิด สีเหลืองหมายถึงสถานะที่สะสมช้า และสีดำหมายถึงสถานะที่มีผู้คนหนาแน่น
ด้านบนของภาพด้านบนแสดงแนวโน้มราคาของ ETH ตรงกลางคือปริมาณการซื้อขาย ด้านล่างคือดอกเบี้ยแบบเปิด สีฟ้าอ่อนคือค่าเฉลี่ย 1 วัน และสีส้มคือค่าเฉลี่ย 7 วัน สีของเส้น K แสดงถึงสถานะปัจจุบัน สีเขียวหมายถึงราคาที่เพิ่มขึ้นได้รับการสนับสนุนจากปริมาณการซื้อขาย สีแดงคือตำแหน่งปิด สีเหลืองคือตำแหน่งที่สะสมอย่างช้าๆ และสีดำคือตำแหน่งที่หนาแน่น
ความผันผวนในอดีตเทียบกับความผันผวนโดยนัย
In the past week, the historical volatility of BTC and ETH was the highest when it fell to 6.14; the implied volatility of BTC and ETH both increased compared to the beginning of the week.
เส้นสีเหลืองคือความผันผวนในอดีต เส้นสีน้ำเงินคือความผันผวนโดยนัย และจุดสีแดงคือค่าเฉลี่ย 7 วัน
ขับเคลื่อนด้วยเหตุการณ์
No data was released in the past week.
ตัวชี้วัดความเชื่อมั่น
ความรู้สึกโมเมนตัม
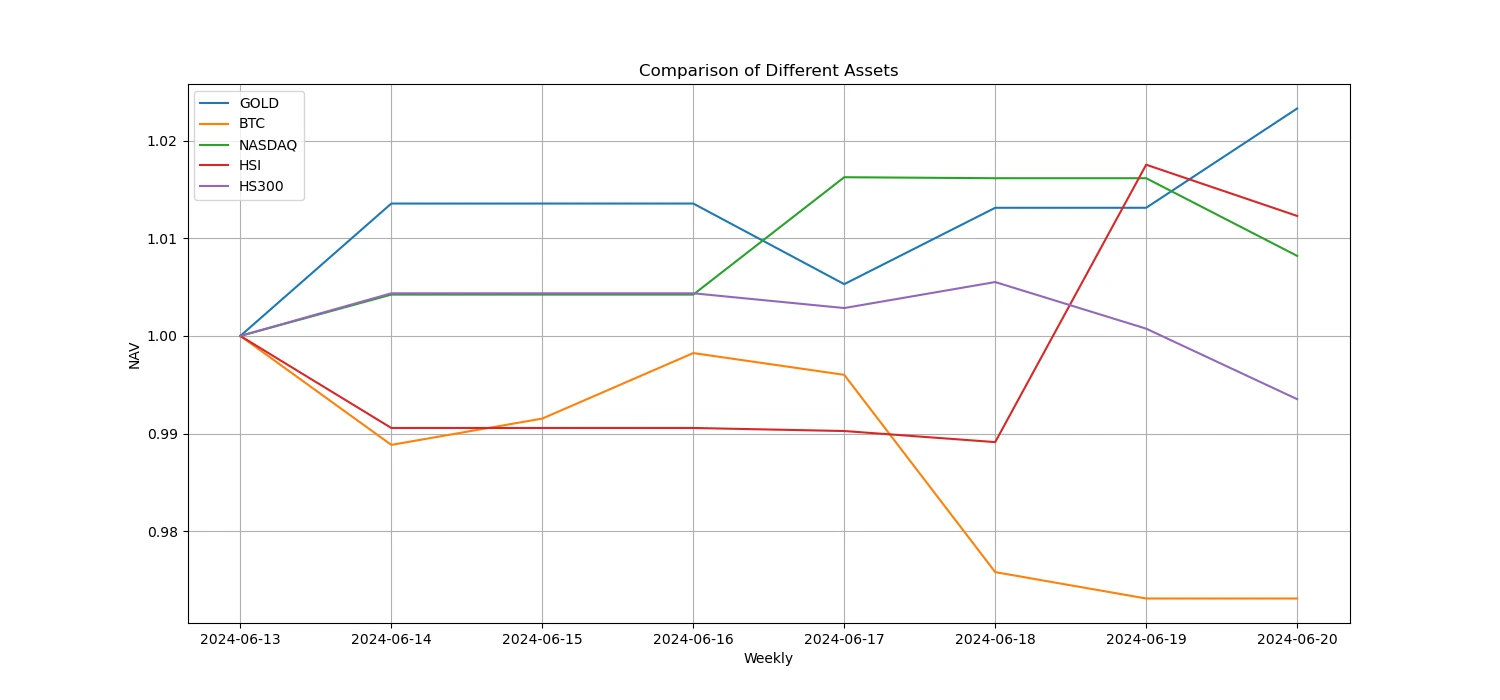
ในสัปดาห์ที่ผ่านมา ในกลุ่ม Bitcoin/Gold/Nasdaq/Hang Seng Index/SSE 300 ทองคำมีความแข็งแกร่งที่สุด ในขณะที่ Bitcoin มีผลการดำเนินงานแย่ที่สุด
ภาพด้านบนแสดงแนวโน้มของสินทรัพย์ต่างๆ ในสัปดาห์ที่ผ่านมา
อัตราการให้กู้ยืม_ความเชื่อมั่นในการให้กู้ยืม
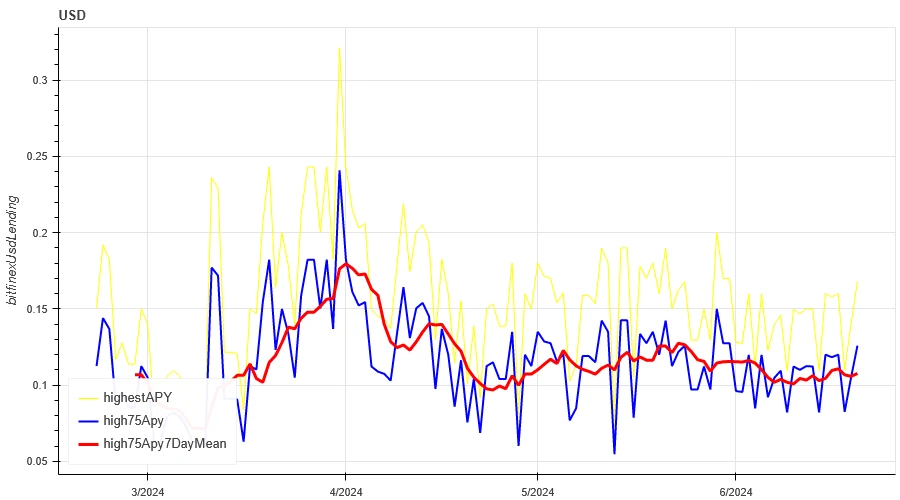
The average annualized return on USD lending in the past week was 10.8%, and short-term interest rates rebounded to around 12.6%.
เส้นสีเหลืองคือราคาสูงสุดของอัตราดอกเบี้ย USD เส้นสีน้ำเงินคือ 75% ของราคาสูงสุด และเส้นสีแดงคือค่าเฉลี่ย 7 วันของ 75% ของราคาสูงสุด
ตารางแสดงผลตอบแทนเฉลี่ยของอัตราดอกเบี้ย USD สำหรับวันที่ถือครองที่แตกต่างกันในอดีต
อัตราการระดมทุน_ความเชื่อมั่นเลเวอเรจตามสัญญา
The average annualized return on BTC fees in the past week was 9.6%, and contract leverage sentiment returned to a low level.
เส้นสีน้ำเงินคืออัตราการระดมทุนของ BTC บน Binance และเส้นสีแดงคือค่าเฉลี่ย 7 วัน
ตารางแสดงผลตอบแทนเฉลี่ยของค่าธรรมเนียม BTC สำหรับวันที่ถือครองที่แตกต่างกันในอดีต
ความสัมพันธ์ของตลาด_ความเชื่อมั่นที่เป็นเอกฉันท์
The correlation among the 129 coins selected in the past week remained at around 0.88, and the consistency between different varieties was at a high level.
In the above picture, the blue line is the price of Bitcoin, and the green line is [1000 floki, 1000 lunc, 1000 pepe, 1000 shib, 100 0x ec, 1inch, aave, ada, agix, algo, ankr, ant, ape, apt, arb, ar, astr, atom, audio, avax, axs, bal, band, bat, bch, bigtime, blur, bnb, btc, celo, cfx, chz, ckb, comp, crv, cvx, cyber, dash, doge, dot, dydx, egld, enj, ens, eos,etc, eth, fet, fil, flow, ftm, fxs, gala, gmt, gmx, grt, hbar, hot, icp, icx, imx, inj, iost, iotx, jasmy, kava, klay, ksm, ldo, link, loom, lpt, lqty, lrc, ltc, luna 2, magic, mana, matic, meme, mina, mkr, near, neo, ocean, one, ont, op, pendle, qnt, qtum, rndr, rose, rune, rvn, sand, sei, sfp, skl, snx, sol, ssv, stg, storj, stx, sui, sushi, sxp, theta, tia, trx, t, uma, uni, vet, waves, wld, woo, xem, xlm, xmr, xrp, xtz, yfi, zec, zen, zil, zrx] overall correlation
ความกว้างของตลาด_ความเชื่อมั่นโดยรวม
Among the 129 coins selected in the past week, 4% of them were priced above the 30-day moving average, 8.6% of them were above the 30-day moving average relative to BTC, 2.4% of them were more than 20% away from the lowest price in the past 30 days, and 4.7% of them were less than 10% away from the highest price in the past 30 days. The market breadth indicator in the past week showed that the overall market was in a continuous decline for most coins.
ภาพด้านบนแสดงถึง [bnb, btc, sol, eth, 1000 floki, 1000 lunc, 1000 pepe, 1000 sats, 1000 shib, 100 0x ec, 1inch, aave, ada, agix, ai, algo, alt, ankr, ape, apt, arb, ar, astr, atom, avax, axs, bal, band, bat, bch, bigtime, blur, cake, celo, cfx, chz, ckb, comp, crv, cvx, cyber, dash, doge, dot, dydx, egld, enj, ens, eos,etc, fet, fil, flow, ftm, fxs, gala, gmt, gmx, grt, hbar, hot, icp, icx, idu, imx, inj, iot, iotx, jasmy, jto, jup, kava, klay, ksm, ldo, ลิงค์, กี่, lpt, lqty, lrc, ltc, luna 2, มายากล, มานา, ราหู, หน้ากาก, matic, มีม, mina, mkr, ใกล้, นีโอ, nfp, มหาสมุทร, หนึ่ง, ont, op, ordi, เพนเดิล, pyth, qnt, qtum dr, robin, กุหลาบ, rune, rvn, ทราย, sei, sfp, skl, snx, ssv, stg, storj, stx, sui, ซูชิ, sxp, theta, tia, trx, t, uma, uni, สัตวแพทย์, คลื่น, wif, wld, woo, xai, xem, xlm, xmr, xrp, xtz, yfi, zec, เซน, ซิล, แซดอาร์เอ็กซ์ ] สัดส่วน 30 วันของตัวบ่งชี้ความกว้างแต่ละตัว
สรุป
Over the past week, the prices of Bitcoin (BTC) and Ethereum (ETH) experienced wide range declines, reaching the peak of volatility on June 18. At the same time, the trading volume of these two cryptocurrencies also reached the highest level during the decline on June 18. Bitcoins open interest volume has declined, while Ethereums open interest volume has increased slightly. In addition, both implied volatilities have increased slightly. In addition, Bitcoins funding rate has fallen to a low level, which may reflect the decline in leverage sentiment of market participants towards Bitcoin. In addition, the market breadth indicator shows that most currencies continue to fall, which indicates that the entire market has generally shown a weak trend over the past week.
ทวิตเตอร์: @ https://x.com/CTA_ChannelCmt
เว็บไซต์: ช่อง cmt.com
This article is sourced from the internet: Crypto Market Sentiment Research Report (2024.06.14-2024.06.21): Bitcoin ETFs have been continuously sold off in the past 5 days
ต้นฉบับ | Odaily Planet Daily Author | Azuma ณ เวลา 20:00 น. ตามเวลาปักกิ่งของวันที่ 30 เมษายน Kamino ซึ่งเป็นโปรโตคอล DeFi ชั้นนำในระบบนิเวศ Solana จะเปิดแอปพลิเคชันโทเค็นอย่างเป็นทางการสำหรับโทเค็นการกำกับดูแล KMNO ก่อนหน้านี้เมื่อวันที่ 5 เมษายน Kamino ได้เพิ่มหน้าการสร้างโทเค็นในเว็บไซต์อย่างเป็นทางการ ก่อนหน้านี้ผู้ใช้สามารถค้นหาการแชร์โทเค็น KMNO ที่เฉพาะเจาะจงผ่านหน้านี้ได้ การอ้างสิทธิ์แบบเปิดในคืนนี้หมายความว่าผู้ใช้จะสามารถอ้างสิทธิ์หุ้น KMNO ที่จัดตั้งขึ้นผ่านอินเทอร์เฟซนี้ และแลกเปลี่ยนกับ DEX หรือ CEX บางตัวที่รองรับ KMNO การแยกย่อยโมเดลธุรกิจของ Kamino โมเดลธุรกิจของ Kamino นั้นไม่ซับซ้อน และผลิตภัณฑ์พื้นฐานของมันคือโปรโตคอลการให้กู้ยืมที่ทุกคนคุ้นเคย จากข้อมูลของ DeFi Llama ปัจจุบัน Kamino อยู่ในอันดับที่สามของโปรโตคอล DeFi และโปรโตคอลการให้ยืมอันดับหนึ่ง...
