Key Metrics (August 19 4pm -> August 26 4pm Hong Kong time):
-
BTC/USD +8.5% ($58,600 -> $63,600), ETH/USD +4.4% ($2,620 -> $2,735)
-
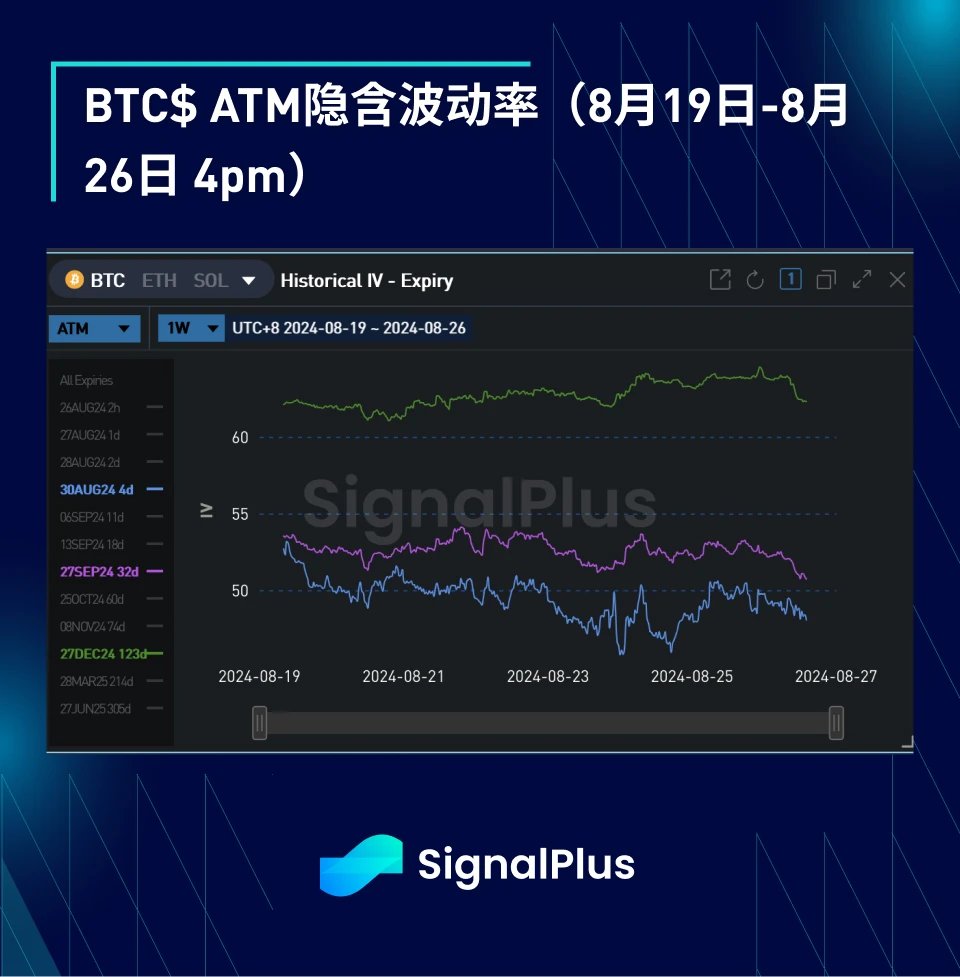
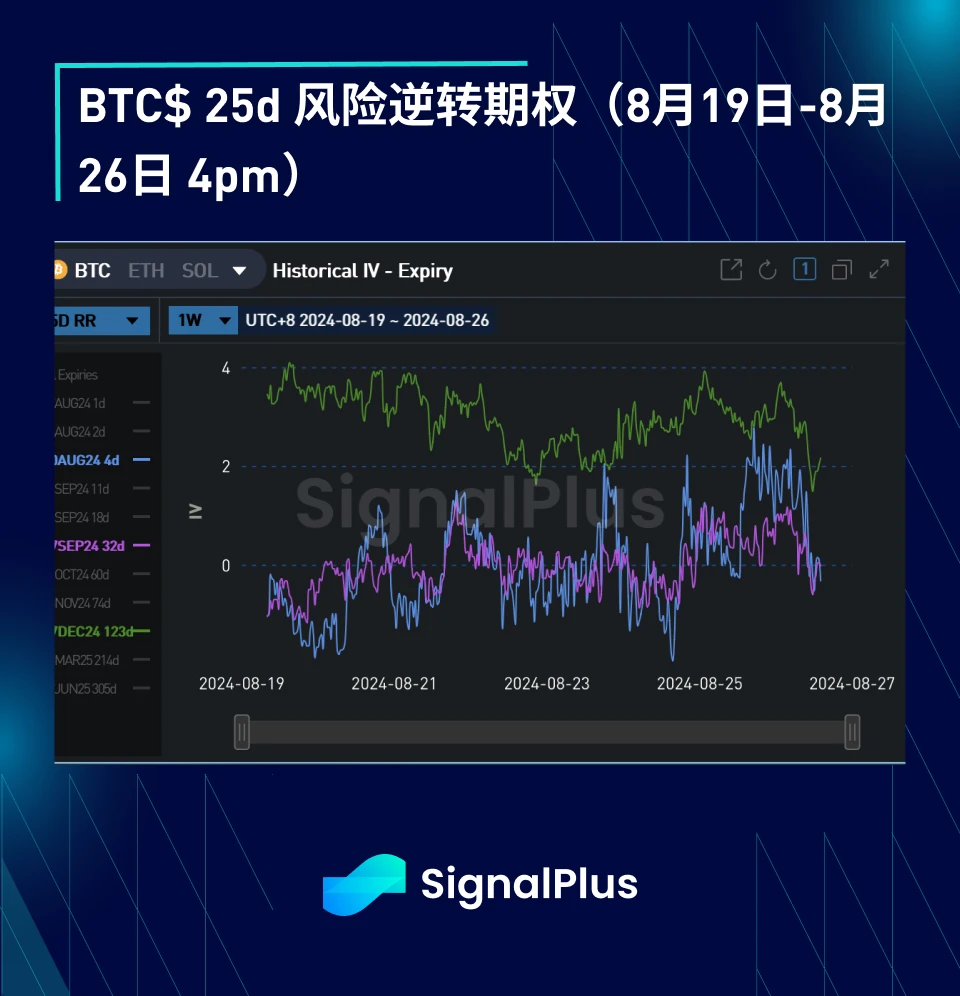
BTC/USD December (end of year) ATM volatility unchanged (62.2 -> 62.2), December 25 day risk reversal volatility -2.0 v (4.1 -> 2.1)

-
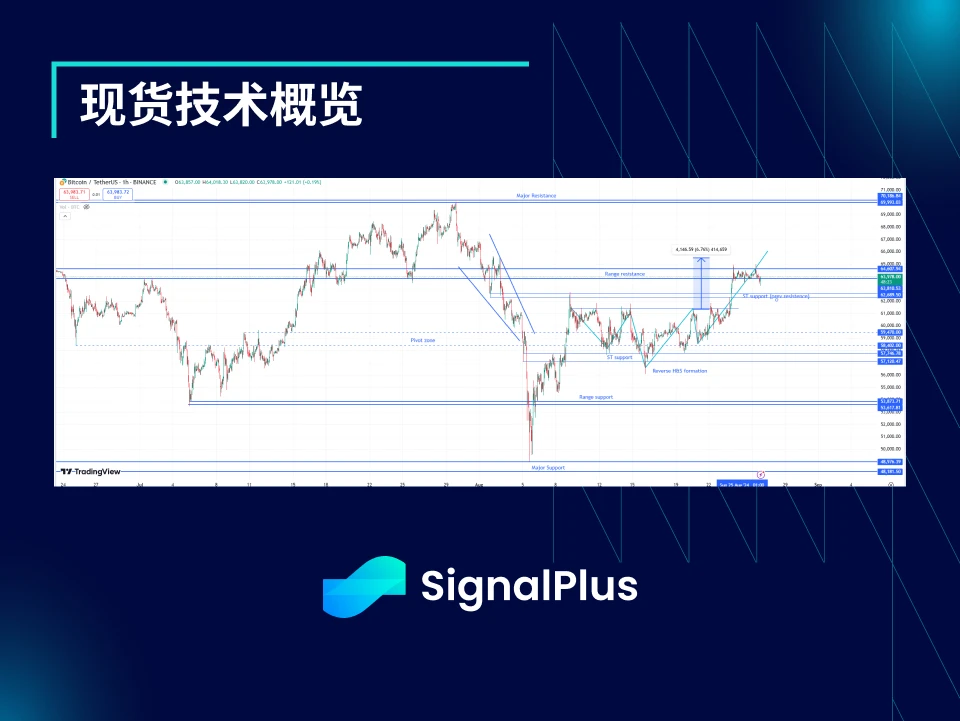
The spot price has finally managed to break through 54-63k and is testing the price range resistance of 64-65k. If it can break through this range, the BTC price may challenge the highs again (initial target is 70k, then above 74k). The initial support level is below 62.5k.
-
Combined with Fridays price breakout, the past few weeks volatile action has formed a (slightly confusing) inverse head and shoulders pattern, suggesting a more intentional move toward range lows could be in the cards if prices pull back again and fail to successfully break through overhead resistance.
Market Events:
-
The market was generally in a quiet consolidation phase at the beginning of this week, but as Powells speech at the Jackson Hole conference approached on Friday night, market expectations gradually heated up. Powell did not respond strongly to the markets expectations of a quick adjustment to faster and earlier rate cuts, but admitted that now is the time to start the Feds rate cut cycle.
-
The cryptocurrency market was relatively slow to react initially (compared to the rapid rise in US stocks/weakening of the USD versus the G10 currencies), but eventually BTCUSD broke through the recent 58-62k price range and stabilized at 64k, driving ETHUSD to the high of the recent range in tandem.
-
Geopolitical noise is now fading into the background, with no signs of an imminent escalation of tensions in the Middle East, while peace talks are struggling to make any substantial progress.
Подразумеваемая волатильность ATM:

-
Implied volatility has been mostly sideways this week, with spot prices range-bound ahead of the Jackson Hole meeting, which has pushed implied volatility up to the overnight breakeven of 2.5% (with an implied volatility of 60). This level is roughly reasonable based on high-frequency data, but low based on fixed-time data.
-
After the Jackson Hole meeting, the spot price broke out of the 58-62k range and the implied volatility initially rose. But by Monday, the implied volatility quickly fell back, and the spot/realized volatility stagnated around 64k.
-
There was continued demand for US election-related options, mostly through rolling September/October call options to November/December. However, a large supply of long-dated call options after the weekend also caused forward prices to fall, reducing the impact of the US election.
Асимметрия/Выпуклость:


-
The skew pricing has moved significantly lower (less demand for options on the upside), which is interestingly the opposite of the spot price movement. This could indicate that the market is still concerned about an accelerated decline in prices, as the previous two declines in this range were very volatile.
-
In addition, some traders are taking advantage of the rise in spot prices to sell covered calls, especially at longer maturities, which puts downward pressure on the tilt of the term structure.
-
Convexity has weakened this week, with both realized volatility and realized spot risk reversals showing low correlations, which has exerted some downward pressure on convexity.
Good luck with your trading this week!

Вы можете использовать функцию трейдинга SignalPlus на t.signalplus.com, чтобы получить больше информации о криптовалютах в режиме реального времени. Если вы хотите получать наши обновления немедленно, подпишитесь на наш аккаунт в Twitter @SignalPlusCN или присоединитесь к нашей группе WeChat (добавьте помощника WeChat: SignalPlus 123), группе Telegram и сообществу Discord, чтобы общаться и взаимодействовать с большим количеством друзей. Официальный сайт SignalPlus: https://www.signalplus.com
Добро пожаловать в официальное сообщество Odaily
Группа подписки в Telegram: https://t.me/Odaily_News
Группа чата в Telegram: https://t.me/Odaily_CryptoPunk
Официальный аккаунт в Twitter: https://twitter.com/OdailyChina
This article is sourced from the internet: BTC Volatility: Week in Review August 19–26, 2024
Оригинальный автор: Crypto, Distilled Оригинальный перевод: TechFlow Coinbase только что опубликовала отчет о том, как криптохедж-фонды генерируют избыточную прибыль. Вот самые ценные идеи. Обзор отчета В отчете раскрываются основные стратегии, используемые активными криптохедж-фондами. Он предоставляет ценную информацию для любого инвестора, который хочет: Лучше управлять рисками Получить избыточную прибыль Углубить свое понимание шифрования Предоставить ценную информацию. Пассивная или активная стратегия? Независимо от вашего уровня опыта, всегда сравнивайте свои результаты с $BTC. Если вы не можете превзойти $BTC в течение года или более, рассмотрите пассивную стратегию. Для большинства инвесторов DCAing $BTC на регулярной основе обычно является лучшим вариантом во время медвежьего рынка. Биткоин – эталон $BTC является предпочтительным эталоном для бета-версии криптовалютного рынка. С 2013 года $BTC имеет годовую доходность…


